Carlisle is the most northerly city in England, and the ... - NHS Cumbria
Carlisle is the most northerly city in England, and the ... - NHS Cumbria
Carlisle is the most northerly city in England, and the ... - NHS Cumbria
- No tags were found...

You also want an ePaper? Increase the reach of your titles
YUMPU automatically turns print PDFs into web optimized ePapers that Google loves.
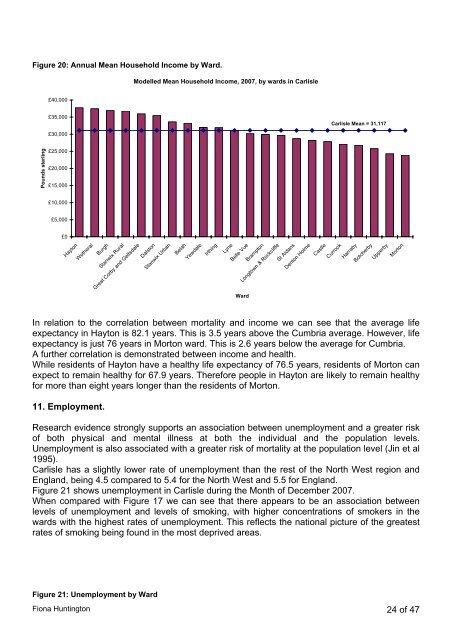
Figure 20: Annual Mean Household Income by Ward.Modelled Mean Household Income, 2007, by wards <strong>in</strong> <strong>Carl<strong>is</strong>le</strong>£40,000£35,000£30,000<strong>Carl<strong>is</strong>le</strong> Mean = 31,117Pounds sterl<strong>in</strong>g£25,000£20,000£15,000£10,000£5,000£0HaytonWe<strong>the</strong>ralBurghStanwix RuralGreat Corby <strong>and</strong> GeltsdaleDalstonStanwix UrbanBelahYewdaleIrth<strong>in</strong>gLyneBelle VueBramptonLongtown & RockcliffeSt AidansDenton HolmeCastleCurrockHarrabyBotcherbyUpperbyMortonWardIn relation to <strong>the</strong> correlation between mortality <strong>and</strong> <strong>in</strong>come we can see that <strong>the</strong> average lifeexpectancy <strong>in</strong> Hayton <strong>is</strong> 82.1 years. Th<strong>is</strong> <strong>is</strong> 3.5 years above <strong>the</strong> <strong>Cumbria</strong> average. However, lifeexpectancy <strong>is</strong> just 76 years <strong>in</strong> Morton ward. Th<strong>is</strong> <strong>is</strong> 2.6 years below <strong>the</strong> average for <strong>Cumbria</strong>.A fur<strong>the</strong>r correlation <strong>is</strong> demonstrated between <strong>in</strong>come <strong>and</strong> health.While residents of Hayton have a healthy life expectancy of 76.5 years, residents of Morton canexpect to rema<strong>in</strong> healthy for 67.9 years. Therefore people <strong>in</strong> Hayton are likely to rema<strong>in</strong> healthyfor more than eight years longer than <strong>the</strong> residents of Morton.11. Employment.Research evidence strongly supports an association between unemployment <strong>and</strong> a greater r<strong>is</strong>kof both physical <strong>and</strong> mental illness at both <strong>the</strong> <strong>in</strong>dividual <strong>and</strong> <strong>the</strong> population levels.Unemployment <strong>is</strong> also associated with a greater r<strong>is</strong>k of mortality at <strong>the</strong> population level (J<strong>in</strong> et al1995).<strong>Carl<strong>is</strong>le</strong> has a slightly lower rate of unemployment than <strong>the</strong> rest of <strong>the</strong> North West region <strong>and</strong><strong>Engl<strong>and</strong></strong>, be<strong>in</strong>g 4.5 compared to 5.4 for <strong>the</strong> North West <strong>and</strong> 5.5 for <strong>Engl<strong>and</strong></strong>.Figure 21 shows unemployment <strong>in</strong> <strong>Carl<strong>is</strong>le</strong> dur<strong>in</strong>g <strong>the</strong> Month of December 2007.When compared with Figure 17 we can see that <strong>the</strong>re appears to be an association betweenlevels of unemployment <strong>and</strong> levels of smok<strong>in</strong>g, with higher concentrations of smokers <strong>in</strong> <strong>the</strong>wards with <strong>the</strong> highest rates of unemployment. Th<strong>is</strong> reflects <strong>the</strong> national picture of <strong>the</strong> greatestrates of smok<strong>in</strong>g be<strong>in</strong>g found <strong>in</strong> <strong>the</strong> <strong>most</strong> deprived areas.Figure 21: Unemployment by WardFiona Hunt<strong>in</strong>gton 24 of 47