Heavy alcohol consumption, particularly <strong>in</strong> <strong>the</strong> early stage of pregnancy can lead to a babybe<strong>in</strong>g born with foetal alcohol syndrome. Retarded growth <strong>is</strong> associated with th<strong>is</strong> syndrome.Women from poorer social backgrounds are one <strong>and</strong> a half times more likely to produce a lowbirth weight babyOn average <strong>in</strong> <strong>Engl<strong>and</strong></strong> <strong>and</strong> Wales, eight percent of births produce a low birth weight baby.<strong>Carl<strong>is</strong>le</strong> has a slightly lower than <strong>the</strong> national average of low birth weight babies at 7% (Clay2007)2. Ethni<strong>city</strong>.Table 2 <strong>is</strong> taken from <strong>the</strong> 2001 census <strong>and</strong> relates to peoples’ ethnic group <strong>and</strong> culturalbackground. In <strong>Engl<strong>and</strong></strong> <strong>and</strong> Wales populations are classified <strong>in</strong>to 16 groups.The table demonstrates that <strong>in</strong> <strong>Carl<strong>is</strong>le</strong> 97.82% of <strong>the</strong> population are classified as ‘WhiteBrit<strong>is</strong>h’. Th<strong>is</strong> <strong>is</strong> considerably higher than <strong>the</strong> national figure of 86.99%.The largest ethnic m<strong>in</strong>ority group <strong>in</strong> <strong>Carl<strong>is</strong>le</strong> <strong>is</strong> ‘White O<strong>the</strong>r’ which may represent <strong>the</strong> <strong>in</strong>creas<strong>in</strong>gnumber of people com<strong>in</strong>g <strong>in</strong>to <strong>the</strong> area from Pol<strong>and</strong>, Portugal <strong>and</strong> o<strong>the</strong>r European countries,<strong>and</strong> reflects <strong>the</strong> national picture.Interest<strong>in</strong>gly <strong>the</strong> third largest ethnic m<strong>in</strong>ority group <strong>in</strong> <strong>Engl<strong>and</strong></strong> <strong>is</strong> ‘Asian Indian’ which makes up2.09% of <strong>the</strong> population. However <strong>in</strong> <strong>Carl<strong>is</strong>le</strong> th<strong>is</strong> group makes up just 0.09% of <strong>the</strong> population.<strong>Carl<strong>is</strong>le</strong> has a large Gypsy / Traveller population, however <strong>the</strong>re <strong>is</strong> no ethnic cod<strong>in</strong>g identified forth<strong>is</strong> group, <strong>the</strong>refore no accurate data <strong>is</strong> available <strong>in</strong> relation to actual numbers of Gypsy/Travellers with<strong>in</strong> our population.Table 2: Ethni<strong>city</strong>.<strong>Carl<strong>is</strong>le</strong> North West <strong>Engl<strong>and</strong></strong>All People (Persons) Count 100,739 6,729,764 49,138,831White: Brit<strong>is</strong>h (Persons) Count 98,547 6,203,043 42,747,136White: Brit<strong>is</strong>h (Persons) % 97.82 92.17 86.99White: Ir<strong>is</strong>h (Persons) Count 523 77,499 624,115White: Ir<strong>is</strong>h (Persons) % 0.52 1.15 1.27White: O<strong>the</strong>r White (Persons) Count 776 74,953 1,308,110White: O<strong>the</strong>r White (Persons) % 0.77 1.11 2.66Mixed: White <strong>and</strong> Black Caribbean (Persons) Count 72 22,119 231,424Mixed: White <strong>and</strong> Black Caribbean (Persons) % 0.07 0.33 0.47Mixed: White <strong>and</strong> Black African (Persons) Count 47 9,853 76,498Mixed: White <strong>and</strong> Black African (Persons) 1 % 0.05 0.15 0.16Mixed: White <strong>and</strong> Asian (Persons) Count 94 17,223 184,014Mixed: White <strong>and</strong> Asian (Persons) % 0.09 0.26 0.37Mixed: O<strong>the</strong>r Mixed (Persons) Count 87 13,344 151,437Mixed: O<strong>the</strong>r Mixed (Persons) % 0.09 0.20 0.31Asian or Asian Brit<strong>is</strong>h: Indian (Persons) Count 94 72,219 1,028,546Asian or Asian Brit<strong>is</strong>h: Indian (Persons) % 0.09 1.07 2.09Asian or Asian Brit<strong>is</strong>h: Pak<strong>is</strong>tani (Persons) Count 48 116,968 706,539Asian or Asian Brit<strong>is</strong>h: Pak<strong>is</strong>tani (Persons) % 0.05 1.74 1.44Asian or Asian Brit<strong>is</strong>h: Bangladeshi (Persons) Count 85 26,003 275,394Asian or Asian Brit<strong>is</strong>h: Bangladeshi (Persons) % 0.08 0.39 0.56Asian or Asian Brit<strong>is</strong>h: O<strong>the</strong>r Asian (Persons) Count 57 14,685 237,810Asian or Asian Brit<strong>is</strong>h: O<strong>the</strong>r Asian (Persons) % 0.06 0.22 0.48Black or Black Brit<strong>is</strong>h: Caribbean (Persons) Count 16 20,422 561,246Black or Black Brit<strong>is</strong>h: Caribbean (Persons) % 0.02 0.30 1.14Black or Black Brit<strong>is</strong>h: African (Persons) Count 43 15,912 475,938Black or Black Brit<strong>is</strong>h: African (Persons) % 0.04 0.24 0.97Black or Black Brit<strong>is</strong>h: O<strong>the</strong>r Black (Persons) Count 11 5,303 95,324Black or Black Brit<strong>is</strong>h: O<strong>the</strong>r Black (Persons) % 0.01 0.08 0.19Fiona Hunt<strong>in</strong>gton 7 of 47
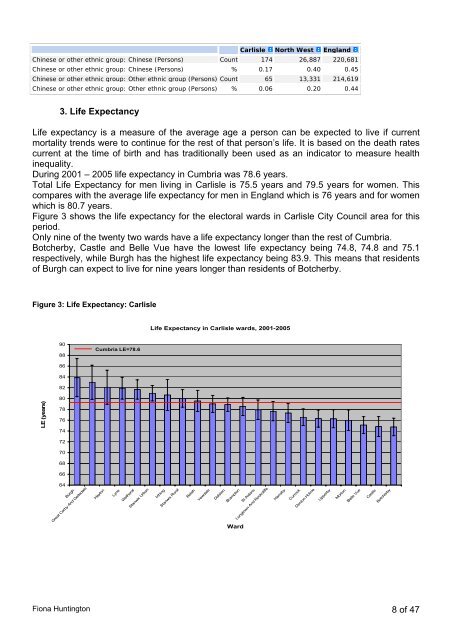
<strong>Carl<strong>is</strong>le</strong> North West <strong>Engl<strong>and</strong></strong>Ch<strong>in</strong>ese or o<strong>the</strong>r ethnic group: Ch<strong>in</strong>ese (Persons) Count 174 26,887 220,681Ch<strong>in</strong>ese or o<strong>the</strong>r ethnic group: Ch<strong>in</strong>ese (Persons) % 0.17 0.40 0.45Ch<strong>in</strong>ese or o<strong>the</strong>r ethnic group: O<strong>the</strong>r ethnic group (Persons) Count 65 13,331 214,619Ch<strong>in</strong>ese or o<strong>the</strong>r ethnic group: O<strong>the</strong>r ethnic group (Persons) % 0.06 0.20 0.443. Life ExpectancyLife expectancy <strong>is</strong> a measure of <strong>the</strong> average age a person can be expected to live if currentmortality trends were to cont<strong>in</strong>ue for <strong>the</strong> rest of that person’s life. It <strong>is</strong> based on <strong>the</strong> death ratescurrent at <strong>the</strong> time of birth <strong>and</strong> has traditionally been used as an <strong>in</strong>dicator to measure health<strong>in</strong>equality.Dur<strong>in</strong>g 2001 – 2005 life expectancy <strong>in</strong> <strong>Cumbria</strong> was 78.6 years.Total Life Expectancy for men liv<strong>in</strong>g <strong>in</strong> <strong>Carl<strong>is</strong>le</strong> <strong>is</strong> 75.5 years <strong>and</strong> 79.5 years for women. Th<strong>is</strong>compares with <strong>the</strong> average life expectancy for men <strong>in</strong> <strong>Engl<strong>and</strong></strong> which <strong>is</strong> 76 years <strong>and</strong> for womenwhich <strong>is</strong> 80.7 years.Figure 3 shows <strong>the</strong> life expectancy for <strong>the</strong> electoral wards <strong>in</strong> <strong>Carl<strong>is</strong>le</strong> City Council area for th<strong>is</strong>period.Only n<strong>in</strong>e of <strong>the</strong> twenty two wards have a life expectancy longer than <strong>the</strong> rest of <strong>Cumbria</strong>.Botcherby, Castle <strong>and</strong> Belle Vue have <strong>the</strong> lowest life expectancy be<strong>in</strong>g 74.8, 74.8 <strong>and</strong> 75.1respectively, while Burgh has <strong>the</strong> highest life expectancy be<strong>in</strong>g 83.9. Th<strong>is</strong> means that residentsof Burgh can expect to live for n<strong>in</strong>e years longer than residents of Botcherby.Figure 3: Life Expectancy: <strong>Carl<strong>is</strong>le</strong>Life Expectancy <strong>in</strong> <strong>Carl<strong>is</strong>le</strong> wards, 2001-20059088<strong>Cumbria</strong> LE=78.6868482LE (years)807876747270686664BurghGreat Corby And GeltsdaleHaytonLyneWe<strong>the</strong>ralStanwix UrbanIrth<strong>in</strong>gStanwix RuralBelahYewdaleDalstonWardBramptonSt AidansLongtown And RockcliffeHarrabyCurrockDenton HolmeUpperbyMortonBelle VueCastleBotcherbyFiona Hunt<strong>in</strong>gton 8 of 47