Carlisle is the most northerly city in England, and the ... - NHS Cumbria
Carlisle is the most northerly city in England, and the ... - NHS Cumbria
Carlisle is the most northerly city in England, and the ... - NHS Cumbria
- No tags were found...

Create successful ePaper yourself
Turn your PDF publications into a flip-book with our unique Google optimized e-Paper software.
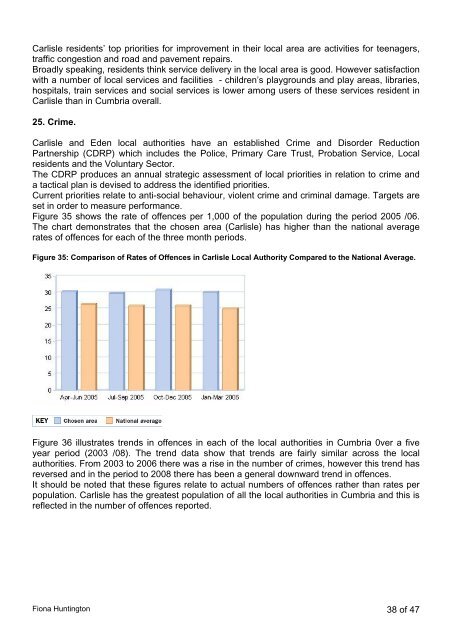
<strong>Carl<strong>is</strong>le</strong> residents’ top priorities for improvement <strong>in</strong> <strong>the</strong>ir local area are activities for teenagers,traffic congestion <strong>and</strong> road <strong>and</strong> pavement repairs.Broadly speak<strong>in</strong>g, residents th<strong>in</strong>k service delivery <strong>in</strong> <strong>the</strong> local area <strong>is</strong> good. However sat<strong>is</strong>factionwith a number of local services <strong>and</strong> facilities - children’s playgrounds <strong>and</strong> play areas, libraries,hospitals, tra<strong>in</strong> services <strong>and</strong> social services <strong>is</strong> lower among users of <strong>the</strong>se services resident <strong>in</strong><strong>Carl<strong>is</strong>le</strong> than <strong>in</strong> <strong>Cumbria</strong> overall.25. Crime.<strong>Carl<strong>is</strong>le</strong> <strong>and</strong> Eden local authorities have an establ<strong>is</strong>hed Crime <strong>and</strong> D<strong>is</strong>order ReductionPartnership (CDRP) which <strong>in</strong>cludes <strong>the</strong> Police, Primary Care Trust, Probation Service, Localresidents <strong>and</strong> <strong>the</strong> Voluntary Sector.The CDRP produces an annual strategic assessment of local priorities <strong>in</strong> relation to crime <strong>and</strong>a tactical plan <strong>is</strong> dev<strong>is</strong>ed to address <strong>the</strong> identified priorities.Current priorities relate to anti-social behaviour, violent crime <strong>and</strong> crim<strong>in</strong>al damage. Targets areset <strong>in</strong> order to measure performance.Figure 35 shows <strong>the</strong> rate of offences per 1,000 of <strong>the</strong> population dur<strong>in</strong>g <strong>the</strong> period 2005 /06.The chart demonstrates that <strong>the</strong> chosen area (<strong>Carl<strong>is</strong>le</strong>) has higher than <strong>the</strong> national averagerates of offences for each of <strong>the</strong> three month periods.Figure 35: Compar<strong>is</strong>on of Rates of Offences <strong>in</strong> <strong>Carl<strong>is</strong>le</strong> Local Authority Compared to <strong>the</strong> National Average.Figure 36 illustrates trends <strong>in</strong> offences <strong>in</strong> each of <strong>the</strong> local authorities <strong>in</strong> <strong>Cumbria</strong> 0ver a fiveyear period (2003 /08). The trend data show that trends are fairly similar across <strong>the</strong> localauthorities. From 2003 to 2006 <strong>the</strong>re was a r<strong>is</strong>e <strong>in</strong> <strong>the</strong> number of crimes, however th<strong>is</strong> trend hasreversed <strong>and</strong> <strong>in</strong> <strong>the</strong> period to 2008 <strong>the</strong>re has been a general downward trend <strong>in</strong> offences.It should be noted that <strong>the</strong>se figures relate to actual numbers of offences ra<strong>the</strong>r than rates perpopulation. <strong>Carl<strong>is</strong>le</strong> has <strong>the</strong> greatest population of all <strong>the</strong> local authorities <strong>in</strong> <strong>Cumbria</strong> <strong>and</strong> th<strong>is</strong> <strong>is</strong>reflected <strong>in</strong> <strong>the</strong> number of offences reported.Fiona Hunt<strong>in</strong>gton 38 of 47