Sports Marketing & Sponsorship - FIFA/CIES International University ...
Sports Marketing & Sponsorship - FIFA/CIES International University ...
Sports Marketing & Sponsorship - FIFA/CIES International University ...
- No tags were found...

You also want an ePaper? Increase the reach of your titles
YUMPU automatically turns print PDFs into web optimized ePapers that Google loves.
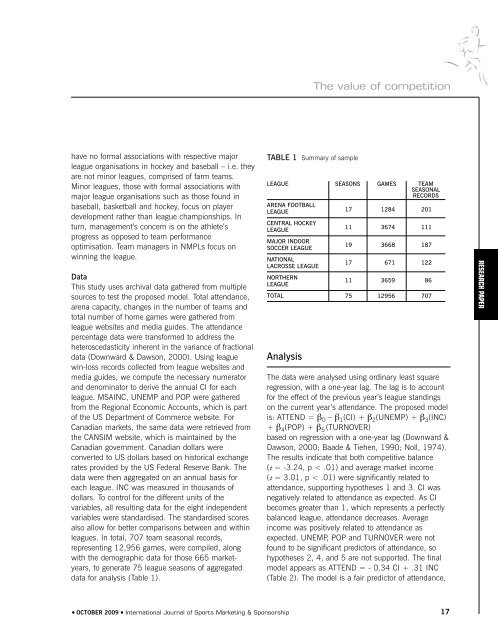
The value of competitionhave no formal associations with respective majorleague organisations in hockey and baseball – i.e. theyare not minor leagues, comprised of farm teams.Minor leagues, those with formal associations withmajor league organisations such as those found inbaseball, basketball and hockey, focus on playerdevelopment rather than league championships. Inturn, management’s concern is on the athlete’sprogress as opposed to team performanceoptimisation. Team managers in NMPLs focus onwinning the league.DataThis study uses archival data gathered from multiplesources to test the proposed model. Total attendance,arena capacity, changes in the number of teams andtotal number of home games were gathered fromleague websites and media guides. The attendancepercentage data were transformed to address theheteroscedasticity inherent in the variance of fractionaldata (Downward & Dawson, 2000). Using leaguewin-loss records collected from league websites andmedia guides, we compute the necessary numeratorand denominator to derive the annual CI for eachleague. MSAINC, UNEMP and POP were gatheredfrom the Regional Economic Accounts, which is partof the US Department of Commerce website. ForCanadian markets, the same data were retrieved fromthe CANSIM website, which is maintained by theCanadian government. Canadian dollars wereconverted to US dollars based on historical exchangerates provided by the US Federal Reserve Bank. Thedata were then aggregated on an annual basis foreach league. INC was measured in thousands ofdollars. To control for the different units of thevariables, all resulting data for the eight independentvariables were standardised. The standardised scoresalso allow for better comparisons between and withinleagues. In total, 707 team seasonal records,representing 12,956 games, were compiled, alongwith the demographic data for those 665 marketyears,to generate 75 league seasons of aggregateddata for analysis (Table 1).TABLE 1 Summary of sampleLEAGUEARENA FOOTBALLLEAGUECENTRAL HOCKEYLEAGUEMAJOR INDOORSOCCER LEAGUENATIONALLACROSSE LEAGUENORTHERNLEAGUETOTALAnalysisSEASONS171119171175GAMES128436743668671365912956TEAMSEASONALRECORDS201111187122The data were analysed using ordinary least squareregression, with a one-year lag. The lag is to accountfor the effect of the previous year’s league standingson the current year’s attendance. The proposed modelis: ATTEND = β 0 – β 1 (CI) + β 2 (UNEMP) + β 3 (INC)+ β 4 (POP) + β 5 (TURNOVER)based on regression with a one-year lag (Downward &Dawson, 2000; Baade & Tiehen, 1990; Noll, 1974).The results indicate that both competitive balance(t = -3.24, p < .01) and average market income(t = 3.01, p < .01) were significantly related toattendance, supporting hypotheses 1 and 3. CI wasnegatively related to attendance as expected. As CIbecomes greater than 1, which represents a perfectlybalanced league, attendance decreases. Averageincome was positively related to attendance asexpected. UNEMP, POP and TURNOVER were notfound to be significant predictors of attendance, sohypotheses 2, 4, and 5 are not supported. The finalmodel appears as ATTEND = - 0.34 CI + .31 INC(Table 2). The model is a fair predictor of attendance,86707RESEARCH PAPER● OCTOBER 2009 ● <strong>International</strong> Journal of <strong>Sports</strong> <strong>Marketing</strong> & <strong>Sponsorship</strong>17