annual report - Jindal Group of Companies
annual report - Jindal Group of Companies
annual report - Jindal Group of Companies

Create successful ePaper yourself
Turn your PDF publications into a flip-book with our unique Google optimized e-Paper software.
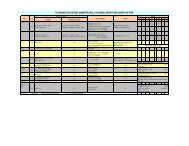
FINANCIAL HIGHLIGHTS(Rs. in million)Particulars FY07 FY08 FY09FY10 FY11Audited Audited Audited Audited AuditedIncome from Operations 3045 4128 7778 11954 10526Other Income 23 38 60 54 109Total Income 3068 4166 7838 12008 10635PBIDT 434 411 728 1421 1622Operating Pr<strong>of</strong>it (EBIDTA) 411 373 6691367 1513Interest & Financial Charges 41 33 27 199Depreciation 100 90 128 121 111Tax 93 67 148 423 507Deferred Tax 20 37 52 17 -13Pr<strong>of</strong>it After Tax (PAT) 180 184 373 841 1008Cash Pr<strong>of</strong>it 300 311 553 979 1106Equity Share Capital 103 115 115 115 115Net Worth 703 2362 2703 3511 4520RatiosEBIDTA as % <strong>of</strong> Sales 13.5 9.0 8.6 11.44 14.37PAT as % <strong>of</strong> Sales 5.94.4 4.8 7.04 9.57ROCE (%) (Annualised) 17.8 11.4 11.5 22.21 22.37RONW (%) (Annualised) 25.6 16.05 13.8 23.95 22.30Basic EPS (Annualised) * 8.75 8.76 16.28 36.6943.97Gross Block <strong>of</strong> Fixed Assets 564 1023 1275 1294 1288*Computed on the face value <strong>of</strong> Rs. 5/- per share.1500012000Turnover(Rs. in million)1200810635160014001200EBIDTA/ PAT(Rs. in million)EBIDTAPAT136715139000600030003068416678381000800600400200411373180 184669373841100802007 2008 20092010201102007 2008 2009201020115000Net Worth(Rs. in million)452050EPS(In Rs.)43.97400035114036.693000270330200023622016.281000703108.75 8.7602007 2008 20092010201102007 2008 20092010201108