Thesis (PDF) - Signal & Image Processing Lab
Thesis (PDF) - Signal & Image Processing Lab
Thesis (PDF) - Signal & Image Processing Lab

You also want an ePaper? Increase the reach of your titles
YUMPU automatically turns print PDFs into web optimized ePapers that Google loves.
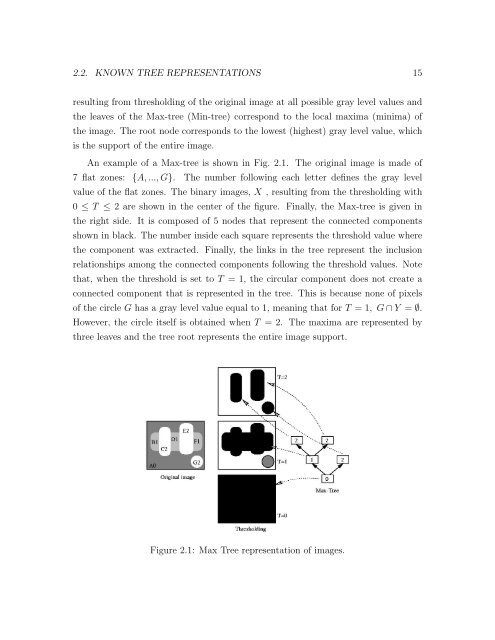
2.2. KNOWN TREE REPRESENTATIONS 15<br />
resulting from thresholding of the original image at all possible gray level values and<br />
the leaves of the Max-tree (Min-tree) correspond to the local maxima (minima) of<br />
the image. The root node corresponds to the lowest (highest) gray level value, which<br />
is the support of the entire image.<br />
An example of a Max-tree is shown in Fig. 2.1. The original image is made of<br />
7 flat zones: {A, ..., G}. The number following each letter defines the gray level<br />
value of the flat zones. The binary images, X , resulting from the thresholding with<br />
0 ≤ T ≤ 2 are shown in the center of the figure. Finally, the Max-tree is given in<br />
the right side. It is composed of 5 nodes that represent the connected components<br />
shown in black. The number inside each square represents the threshold value where<br />
the component was extracted. Finally, the links in the tree represent the inclusion<br />
relationships among the connected components following the threshold values. Note<br />
that, when the threshold is set to T = 1, the circular component does not create a<br />
connected component that is represented in the tree. This is because none of pixels<br />
of the circle G has a gray level value equal to 1, meaning that for T = 1, G ∩ Y = ∅.<br />
However, the circle itself is obtained when T = 2. The maxima are represented by<br />
three leaves and the tree root represents the entire image support.<br />
Figure 2.1: Max Tree representation of images.