AC Choksi Share Brokers Private Limited
AC Choksi Share Brokers Private Limited
AC Choksi Share Brokers Private Limited
- No tags were found...

Create successful ePaper yourself
Turn your PDF publications into a flip-book with our unique Google optimized e-Paper software.
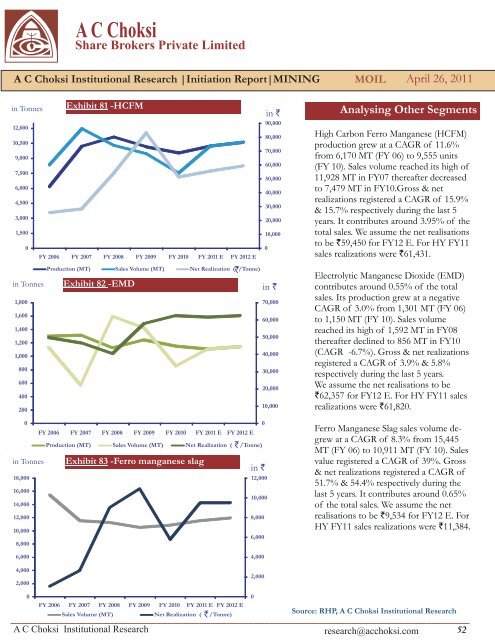
A C <strong>Choksi</strong><strong>Share</strong> <strong>Brokers</strong> <strong>Private</strong> <strong>Limited</strong>A C <strong>Choksi</strong> Institutional Research |Initiation Report|MINING MOILApril 26, 2011in Tonnes Exhibit 81 -HCFMin `12,00090,00080,00010,50070,0009,00060,0007,50050,0006,00040,0004,50030,0003,00020,0001,50010,00000FY 2006 FY 2007 FY 2008 FY 2009 FY 2010 FY 2011 E FY 2012 Ein Tonnes`Exhibit 82 -EMDin `Production (MT) Sales Volume (MT) Net Realization ( `/Tonne)1,80070,0001,60060,0001,40050,0001,2001,00040,00080030,00060020,00040020010,00000FY 2006 FY 2007 FY 2008 FY 2009 FY 2010 FY 2011 E FY 2012 EProduction (MT) Sales Volume (MT) Net Realization ( /Tonne)in Tonnes Exhibit 83 -Ferro manganese slagin `18,00012,00016,00010,00014,00012,0008,00010,0006,0008,000`Analysing Other SegmentsHigh Carbon Ferro Manganese (HCFM)production grew at a CAGR of 11.6%from 6,170 MT (FY 06) to 9,555 units(FY 10). Sales volume reached its high of11,928 MT in FY07 thereafter decreasedto 7,479 MT in FY10.Gross & netrealizations registered a CAGR of 15.9%& 15.7% respectively during the last 5years. It contributes around 3.95% of thetotal sales. We assume the net realisationsto be `59,450 for FY12 E. For HY FY11sales realizations were `61,431.Electrolytic Manganese Dioxide (EMD)contributes around 0.55% of the totalsales. Its production grew at a negativeCAGR of 3.0% from 1,301 MT (FY 06)to 1,150 MT (FY 10). Sales volumereached its high of 1,592 MT in FY08thereafter declined to 856 MT in FY10(CAGR -6.7%). Gross & net realizationsregistered a CAGR of 3.9% & 5.8%respectively during the last 5 years.We assume the net realisations to be`62,357 for FY12 E. For HY FY11 salesrealizations were `61,820.Ferro Manganese Slag sales volume degrewat a CAGR of 8.3% from 15,445MT (FY 06) to 10,911 MT (FY 10). Salesvalue registered a CAGR of 39%. Gross& net realizations registered a CAGR of51.7% & 54.4% respectively during thelast 5 years. It contributes around 0.65%of the total sales. We assume the netrealisations to be `9,534 for FY12 E. ForHY FY11 sales realizations were `11,384.6,0004,0002,0004,0002,00000FY 2006 FY 2007 FY 2008 FY 2009 FY 2010 FY 2011 E FY 2012 ESales Volume (MT) Net Realization (_____________________________________________________________________________________`/Tonne)Source: RHP, A C <strong>Choksi</strong> Institutional ResearchA C <strong>Choksi</strong> Institutional Researchresearch@acchoksi.com 52