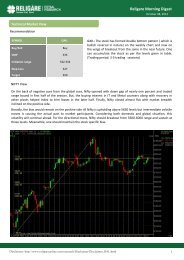
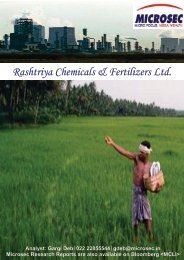
A C <strong>Choksi</strong><strong>Share</strong> <strong>Brokers</strong> <strong>Private</strong> <strong>Limited</strong>A C <strong>Choksi</strong> Institutional Research |Initiation Report|MINING MOILApril 26, 2011CAGRExhibit 86 -CAGR of key revenue items36%36%36%PATTaxationCAGR E^17%23%34%PBTOther income17%16%27%28%DepreciationEBITD<strong>AC</strong>AGR *17%21%20%22%31%33%39%42%45%43%Total operating expensesTotal Other Expenses58%Administrative andselling expensesManufacturing andelectricity generationexpensesOre expenses (incl rawmaterial costs)Net sales-10.00% 0.00% 10.00% 20.00% 30.00% 40.00% 50.00% 60.00% 70.00%* 4 Year CAGR from FY 06 to FY 10 ^ 6 Year CAGR from FY 06 to FY 12 ESource: A C <strong>Choksi</strong> Institutional Research7.00%6.00%Exhibit 87 - 10 year CAGR ofphysical production5.00%4.00%3.00%ManganeseOre 5.91%Output perMan Shift6.44%2.00%EMD 3.82%Ferro-1.00%Manganese1.90%0.00%Source: MOIL, A C <strong>Choksi</strong> Institutional Research_____________________________________________________________________________________A C <strong>Choksi</strong> Institutional Researchresearch@acchoksi.com 54
A C <strong>Choksi</strong><strong>Share</strong> <strong>Brokers</strong> <strong>Private</strong> <strong>Limited</strong>A C <strong>Choksi</strong> Institutional Research |Initiation Report|MINING MOILApril 26, 2011sExhibit 20 88 -Income StatementMOILParticulars (` in Mn except EPS )FY 2006 FY 2007 FY 2008 FY 2009 FY 2010 FY 2011 E FY 2012 EPeriod Ended 31-Mar-06 31-Mar-07 31-Mar-08 31-Mar-09 31-Mar-10 31-Mar-11 31-Mar-12IncomeNet sales 3,313 4,173 9,775 12,933 9,694 12,815 13,680Other Operating Income 0 0 0 0 0 0 0Total Operating Income 3,313 4,173 9,775 12,933 9,694 12,815 13,680% Change 26% 134% 32% -25% 32% 7%Ore expenses (incl raw material costs) 1,260 1,770 1,870 2,537 2,638 2,699 3,019% change 40% 6% 36% 4% 2% 12%Manufacturing and electricity generation expenses 196 259 289 443 372 475 505% change 32% 11% 54% -16% 28% 6%Administrative and selling expenses 197 224 476 722 615 815 865% change 14% 112% 52% -15% 33% 6%Other Expenses 61 85 97 34 47 46 53% change 38% 15% -65% 39% -3% 15%Total operating expenses 1,714 2,338 2,732 3,736 3,673 4,035 4,442% change 36% 17% 37% -2% 10% 10%EBITDA 1,600 1,835 7,043 9,197 6,021 8,780 9,238% change 15% 284% 31% -35% 46% 5%Depreciation 115 141 161 247 253 301 395EBIT 1,485 1,695 6,883 8,951 5,768 8,479 8,844% change 14% 306% 30% -36% 47% 4%Less : Interest and finance charges 0 0 0 0 0 0 0Other income 206 284 466 1,117 1,300 1,504 1,798% change 38% 64% 139% 16% 16% 20%PBT 1,691 1,979 7,349 10,068 7,068 9,983 10,641Taxation 545 669 2,551 3,430 2,404 3,294 3,512Other Items/Adjustments 16 -4 183 -265 7 0 0PAT 1,131 1,313 4,616 6,903 4,656 6,688 7,130% change 16% 251% 50% -33% 44% 7%Basic EPS (`)6.7 7.8 27.5 41.1 27.7 39.8 42.4Fully Diluted EPS (`)6.7 7.8 27.5 41.1 27.7 39.8 42.4_____________________________________________________________________________________Source: RHP, A C <strong>Choksi</strong> Institutional ResearchA C <strong>Choksi</strong> Institutional Researchresearch@acchoksi.com 55