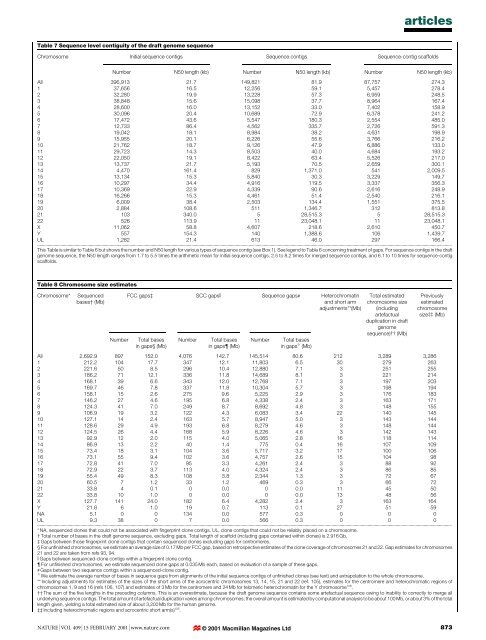
articlesTable 7 Sequence level contiguity <strong>of</strong> <strong>the</strong> draft <strong>genome</strong> sequenceChromosome <strong>Initial</strong> sequence contigs Sequence contigs Sequence-contig scaffoldsNumber N50 length (kb) Number N50 length (kb) Number N50 length (kb)All 396,913 21.7 149,821 81.9 87,757 274.31 37,656 16.5 12,256 59.1 5,457 278.42 32,280 19.9 13,228 57.3 6,959 248.53 38,848 15.6 15,098 37.7 8,964 167.44 28,600 16.0 13,152 33.0 7,402 158.95 30,096 20.4 10,689 72.9 6,378 241.26 17,472 43.6 5,547 180.3 2,554 485.07 12,733 86.4 4,562 335.7 2,726 591.38 19,042 18.1 8,984 38.2 4,631 198.99 15,955 20.1 6,226 55.6 3,766 216.210 21,762 18.7 9,126 47.9 6,886 133.011 29,723 14.3 8,503 40.0 4,684 193.212 22,050 19.1 8,422 63.4 5,526 217.013 13,737 21.7 5,193 70.5 2,659 300.114 4,470 161.4 829 1,371.0 541 2,009.515 13,134 15.3 5,840 30.3 3,229 149.716 10,297 34.4 4,916 119.5 3,337 356.317 10,369 22.9 4,339 90.6 2,616 248.918 16,266 15.3 4,461 51.4 2,540 216.119 6,009 38.4 2,503 134.4 1,551 375.520 2,884 108.6 511 1,346.7 312 813.821 103 340.0 5 28,515.3 5 28,515.322 526 113.9 11 23,048.1 11 23,048.1X 11,062 58.8 4,607 218.6 2,610 450.7Y 557 154.3 140 1,388.6 106 1,439.7UL 1,282 21.4 613 46.0 297 166.4...................................................................................................................................................................................................................................................................................................................................................................This Table is similar to Table 6 but shows <strong>the</strong> number <strong>and</strong> N50 length for various types <strong>of</strong> sequence contig (see Box 1). See legend to Table 6 concerning treatment <strong>of</strong> gaps. For sequence contigs in <strong>the</strong> draft<strong>genome</strong> sequence, <strong>the</strong> N50 length ranges from 1.7 to 5.5 times <strong>the</strong> arithmetic mean for initial sequence contigs, 2.5 to 8.2 times for merged sequence contigs, <strong>and</strong> 6.1 to 10 times for sequence-contigscaffolds.Table 8 Chromosome size estimatesChromosome*Sequencedbases² (Mb)NumberFCC gaps³ SCC gapsk Sequence gaps# Heterochromatin<strong>and</strong> short armadjustments**(Mb)Total basesin gaps§ (Mb)NumberTotal basesin gaps (Mb)NumberTotal basesin gaps I (Mb)Total estimatedchromosome size(includingartefactualduplication in draft<strong>genome</strong>sequence)²² (Mb)Previouslyestimatedchromosomesize³³ (Mb)All 2,692.9 897 152.0 4,076 142.7 145,514 80.6 212 3,289 3,2861 212.2 104 17.7 347 12.1 11,803 6.5 30 279 2632 221.6 50 8.5 296 10.4 12,880 7.1 3 251 2553 186.2 71 12.1 336 11.8 14,689 8.1 3 221 2144 168.1 39 6.6 343 12.0 12,768 7.1 3 197 2035 169.7 46 7.8 337 11.8 10,304 5.7 3 198 1946 158.1 15 2.6 275 9.6 5,225 2.9 3 176 1837 146.2 27 4.6 195 6.8 4,338 2.4 3 163 1718 124.3 41 7.0 249 8.7 8,692 4.8 3 148 1559 106.9 19 3.2 122 4.3 6,083 3.4 22 140 14510 127.1 14 2.4 163 5.7 8,947 5.0 3 143 14411 128.6 29 4.9 193 6.8 8,279 4.6 3 148 14412 124.5 26 4.4 168 5.9 8,226 4.6 3 142 14313 92.9 12 2.0 115 4.0 5,065 2.8 16 118 11414 86.9 13 2.2 40 1.4 775 0.4 16 107 10915 73.4 18 3.1 104 3.6 5,717 3.2 17 100 10616 73.1 55 9.4 102 3.6 4,757 2.6 15 104 9817 72.8 41 7.0 95 3.3 4,261 2.4 3 88 9218 72.9 22 3.7 113 4.0 4,324 2.4 3 86 8519 55.4 49 8.3 108 3.8 2,344 1.3 3 72 6720 60.5 7 1.2 33 1.2 469 0.3 3 66 7221 33.8 4 0.1 0 0.0 0 0.0 11 45 5022 33.8 10 1.0 0 0.0 0 0.0 13 48 56X 127.7 141 24.0 182 6.4 4,282 2.4 3 163 164Y 21.8 6 1.0 19 0.7 113 0.1 27 51 59NA 5.1 0 0 134 0.0 577 0.3 0 0 0UL 9.3 38 0 7 0.0 566 0.3 0 0 0...................................................................................................................................................................................................................................................................................................................................................................* NA, sequenced clones that could not be associated with ®ngerprint clone contigs. UL, clone contigs that could not be reliably placed on a chromosome.² Total number <strong>of</strong> bases in <strong>the</strong> draft <strong>genome</strong> sequence, excluding gaps. Total length <strong>of</strong> scaffold (including gaps contained within clones) is 2.916 Gb.³ Gaps between those ®ngerprint clone contigs that contain sequenced clones excluding gaps for centromeres.§ For un®nished chromosomes, we estimate an average size <strong>of</strong> 0.17 Mb per FCC gap, based on retrospective estimates <strong>of</strong> <strong>the</strong> clone coverage <strong>of</strong> chromosomes 21 <strong>and</strong> 22. Gap estimates for chromosomes21 <strong>and</strong> 22 are taken from refs 93, 94.k Gaps between sequenced-clone contigs within a ®ngerprint clone contig. For un®nished chromosomes, we estimate sequenced clone gaps at 0.035 Mb each, based on evaluation <strong>of</strong> a sample <strong>of</strong> <strong>the</strong>se gaps.# Gaps between two sequence contigs within a sequenced-clone contig.I We estimate <strong>the</strong> average number <strong>of</strong> bases in sequence gaps from alignments <strong>of</strong> <strong>the</strong> initial sequence contigs <strong>of</strong> un®nished clones (see text) <strong>and</strong> extrapolation to <strong>the</strong> whole chromosome.** Including adjustments for estimates <strong>of</strong> <strong>the</strong> sizes <strong>of</strong> <strong>the</strong> short arms <strong>of</strong> <strong>the</strong> acrocentric chromosomes 13, 14, 15, 21 <strong>and</strong> 22 (ref. 105), estimates for <strong>the</strong> centromere <strong>and</strong> heterochromatic regions <strong>of</strong>chromosomes 1, 9 <strong>and</strong> 16 (refs 106, 107) <strong>and</strong> estimates <strong>of</strong> 3 Mb for <strong>the</strong> centromere <strong>and</strong> 24 Mb for telomeric heterochromatin for <strong>the</strong> Y chromosome 108 .²² The sum <strong>of</strong> <strong>the</strong> ®ve lengths in <strong>the</strong> preceding columns. This is an overestimate, because <strong>the</strong> draft <strong>genome</strong> sequence contains some artefactual sequence owing to inability to correctly to merge allunderlying sequence contigs. The total amount <strong>of</strong> artefactual duplication varies among chromosomes; <strong>the</strong> overall amount is estimated by computational <strong>analysis</strong> to be about 100 Mb, or about 3% <strong>of</strong> <strong>the</strong> totallength given, yielding a total estimated size <strong>of</strong> about 3,200 Mb for <strong>the</strong> <strong>human</strong> <strong>genome</strong>.³³ Including heterochromatic regions <strong>and</strong> acrocentric short arm(s) 105 .NATURE | VOL 409 | 15 FEBRUARY 2001 | www.nature.com © 2001 Macmillan Magazines Ltd873
articles®ngerprint map. However, many involve STSs that have beenlocalized on only one or two <strong>of</strong> <strong>the</strong> previous maps or that occuras isolated discrepancies in con¯ict with several ¯anking STSs.Many <strong>of</strong> <strong>the</strong>se cases are probably due to errors in <strong>the</strong> previousmaps (with error rates for individual maps estimated at 1±2% 100 ).O<strong>the</strong>rs may be due to incorrect assignment <strong>of</strong> <strong>the</strong> STSs to <strong>the</strong> draft<strong>genome</strong> sequence (by <strong>the</strong> electronic polymerase chain reaction(e-PCR) computer program) or to database entries that containsequence data from more than one clone (owing to crosscontamination).Graphical views <strong>of</strong> <strong>the</strong> independent data sets were particularlyuseful in detecting problems with order or orientation (Fig. 5).Areas <strong>of</strong> con¯ict were reviewed <strong>and</strong> corrected if supported by <strong>the</strong>underlying data. In <strong>the</strong> version discussed here, <strong>the</strong>re were 41sequenced clones falling in 14 sequenced-clone contigs with STScontent information from multiple maps that disagreed with <strong>the</strong>¯anking clones or sequenced-clone contigs; <strong>the</strong> placement <strong>of</strong> <strong>the</strong>seclones thus remains suspect. Four <strong>of</strong> <strong>the</strong>se instances suggest errorsin <strong>the</strong> ®ngerprint map, whereas <strong>the</strong> o<strong>the</strong>rs suggest errors in <strong>the</strong>layout <strong>of</strong> sequenced clones. These cases are being investigated <strong>and</strong>will be corrected in future versions.Assembly <strong>of</strong> <strong>the</strong> sequenced clones. We assessed <strong>the</strong> accuracy <strong>of</strong> <strong>the</strong>assembly by using a set <strong>of</strong> 148 draft clones comprising 22.4 Mb forwhich ®nished sequence subsequently became available 104 . Theinitial sequence contigs lack information about order <strong>and</strong> orientation,<strong>and</strong> GigAssembler attempts to use linking data to infer suchinformation as far as possible 104 . Starting with initial sequencecontigs that were unordered <strong>and</strong> unoriented, <strong>the</strong> program placed90% <strong>of</strong> <strong>the</strong> initial sequence contigs in <strong>the</strong> correct orientation <strong>and</strong>85% in <strong>the</strong> correct order with respect to one ano<strong>the</strong>r. In a separatetest, GigAssembler was tested on simulated draft data producedfrom ®nished sequence on chromosome 22 <strong>and</strong> similar results wereobtained.Some problems remain at all levels. First, errors in <strong>the</strong> initialsequence contigs persist in <strong>the</strong> merged sequence contigs built from<strong>the</strong>m <strong>and</strong> can cause dif®culties in <strong>the</strong> assembly <strong>of</strong> <strong>the</strong> draft <strong>genome</strong>sequence. Second, GigAssembler may fail to merge some overlappingsequences because <strong>of</strong> poor data quality, allelic differences ormisassemblies <strong>of</strong> <strong>the</strong> initial sequence contigs; this may result inapparent local duplication <strong>of</strong> a sequence. We have estimated byvarious methods <strong>the</strong> amount <strong>of</strong> such artefactual duplication in <strong>the</strong>assembly from <strong>the</strong>se <strong>and</strong> o<strong>the</strong>r sources to be about 100 Mb. On <strong>the</strong>o<strong>the</strong>r h<strong>and</strong>, nearby duplicated sequences may occasionally be incorrectlymerged. Some sequenced clones remain incorrectly placed on<strong>the</strong> layout, as discussed above, <strong>and</strong> o<strong>the</strong>rs (, 0.5%) remain unplaced.The ®ngerprint map has undoubtedly failed to resolve some closelyrelated duplicated regions, such as <strong>the</strong> Williams region <strong>and</strong> severalhighly repetitive subtelomeric <strong>and</strong> pericentric regions (see below).Detailed examination <strong>and</strong> sequence ®nishing may be required tosort out <strong>the</strong>se regions precisely, as has been done with chromosomeY 89 . Finally, small sequenced-clone contigs with limited or no STSTable 9 Distribution <strong>of</strong> PHRAP scores in <strong>the</strong> draft <strong>genome</strong> sequencePHRAP scorePercentage <strong>of</strong> bases in <strong>the</strong> draft<strong>genome</strong> sequence0±9 0.610±19 1.320±29 2.230±39 4.840±49 8.150±59 8.760±69 9.070±79 12.180±89 17.3.90 35.9.............................................................................................................................................................................PHRAP scores are a logarithmically based representation <strong>of</strong> <strong>the</strong> error probability. A PHRAP score <strong>of</strong>X corresponds to an error probability <strong>of</strong> 10 -X/10 . Thus, PHRAP scores <strong>of</strong> 20, 30 <strong>and</strong> 40 correspond toaccuracy <strong>of</strong> 99%, 99.9% <strong>and</strong> 99.99%, respectively. PHRAP scores are derived from qualityscores <strong>of</strong> <strong>the</strong> underlying sequence reads used in sequence assembly. See http://www.<strong>genome</strong>.washington.edu/UWGC/<strong>analysis</strong>tools/phrap.htm.l<strong>and</strong>mark content remain dif®cult to place. Full utilization <strong>of</strong><strong>the</strong> higher resolution radiation hybrid map (<strong>the</strong> TNG map) mayhelp in this 95 . Future targeted FISH experiments <strong>and</strong> increased mapcontinuity will also facilitate positioning <strong>of</strong> <strong>the</strong>se sequences.Genome coverageWe next assessed <strong>the</strong> nature <strong>of</strong> <strong>the</strong> gaps within <strong>the</strong> draft <strong>genome</strong>sequence, <strong>and</strong> attempted to estimate <strong>the</strong> fraction <strong>of</strong> <strong>the</strong> <strong>human</strong><strong>genome</strong> not represented within <strong>the</strong> current version.Gaps in draft <strong>genome</strong> sequence coverage. There are three types <strong>of</strong>gap in <strong>the</strong> draft <strong>genome</strong> sequence: gaps within un®nishedsequenced clones; gaps between sequenced-clone contigs, butwithin ®ngerprint clone contigs; <strong>and</strong> gaps between ®ngerprintclone contigs. The ®rst two types are relatively straightforward toclose simply by performing additional <strong>sequencing</strong> <strong>and</strong> ®nishing onalready identi®ed clones. Closing <strong>the</strong> third type may require screening<strong>of</strong> additional large-insert clone libraries <strong>and</strong> possibly newtechnologies for <strong>the</strong> most recalcitrant regions. We consider <strong>the</strong>sethree cases in turn.We estimated <strong>the</strong> size <strong>of</strong> gaps within draft clones by studyinginstances in which <strong>the</strong>re was substantial overlap between a draftclone <strong>and</strong> a ®nished clone, as described above. The average gap sizein <strong>the</strong>se draft sequenced clones was 554 bp, although <strong>the</strong> preciseestimate was sensitive to certain assumptions in <strong>the</strong> <strong>analysis</strong>.Assuming that <strong>the</strong> sequence gaps in <strong>the</strong> draft <strong>genome</strong> sequenceare fairly represented by this sample, about 80 Mb or about 3%(likely range 2±4%) <strong>of</strong> sequence may lie in <strong>the</strong> 145,514 gaps withindraft sequenced clones.The gaps between sequenced-clone contigs but within ®ngerprintclone contigs are more dif®cult to evaluate directly, because <strong>the</strong>draft <strong>genome</strong> sequence ¯anking many <strong>of</strong> <strong>the</strong> gaps is <strong>of</strong>ten notprecisely aligned with <strong>the</strong> ®ngerprinted clones. However, most aremuch smaller than a single BAC. In fact, nearly three-quarters <strong>of</strong><strong>the</strong>se gaps are bridged by one or more individual BACs, as indicatedby linking information from BAC end sequences. We measured <strong>the</strong>sizes <strong>of</strong> a subset <strong>of</strong> gaps directly by examining restriction fragment®ngerprints <strong>of</strong> overlapping clones. A study <strong>of</strong> 157 `bridged' gaps <strong>and</strong>55 `unbridged' gaps gave an average gap size <strong>of</strong> 25 kb. Allowing for <strong>the</strong>possibility that <strong>the</strong>se gaps may not be fully representative <strong>and</strong> thatsome restriction fragments are not included in <strong>the</strong> calculation, a moreconservative estimate <strong>of</strong> gap size would be 35 kb. This would indicatethat about 150 Mb or 5% <strong>of</strong> <strong>the</strong> <strong>human</strong> <strong>genome</strong> may reside in <strong>the</strong>4,076 gaps between sequenced-clone contigs. This sequence shouldbe readily obtained as <strong>the</strong> clones spanning <strong>the</strong>m are sequenced.The size <strong>of</strong> <strong>the</strong> gaps between ®ngerprint clone contigs wasestimated by comparing <strong>the</strong> ®ngerprint maps to <strong>the</strong> essentiallycompleted chromosomes 21 <strong>and</strong> 22. The <strong>analysis</strong> shows that <strong>the</strong>®ngerprinted BAC clones in <strong>the</strong> global database cover 97±98% <strong>of</strong><strong>the</strong> sequenced portions <strong>of</strong> those chromosomes 86 . The publishedsequences <strong>of</strong> <strong>the</strong>se chromosomes also contain a few small gaps (5<strong>and</strong> 11, respectively) amounting to some 1.6% <strong>of</strong> <strong>the</strong> euchromaticsequence, <strong>and</strong> do not include <strong>the</strong> heterochromatic portion. Thissuggests that <strong>the</strong> gaps between contigs in <strong>the</strong> ®ngerprint mapcontain about 4% <strong>of</strong> <strong>the</strong> euchromatic <strong>genome</strong>. Experience withclosure <strong>of</strong> such gaps on chromosomes 20 <strong>and</strong> 7 suggests that many<strong>of</strong> <strong>the</strong>se gaps are less than one clone in length <strong>and</strong> will be closed byclones from o<strong>the</strong>r libraries. However, recovery <strong>of</strong> sequence from<strong>the</strong>se gaps represents <strong>the</strong> most challenging aspect <strong>of</strong> producing acomplete ®nished sequence <strong>of</strong> <strong>the</strong> <strong>human</strong> <strong>genome</strong>.As ano<strong>the</strong>r measure <strong>of</strong> <strong>the</strong> representation <strong>of</strong> <strong>the</strong> BAC libraries,Riethman 109 has found BAC or cosmid clones that link to telomerichalf-YACs or to <strong>the</strong> telomeric sequence itself for 40 <strong>of</strong> <strong>the</strong> 41 nonsatellitetelomeres. Thus, <strong>the</strong> ®ngerprint map appears to have nosubstantial gaps in <strong>the</strong>se regions. Many <strong>of</strong> <strong>the</strong> pericentric regions arealso represented, but <strong>analysis</strong> is less complete here (see below).Representation <strong>of</strong> r<strong>and</strong>om raw sequences. In ano<strong>the</strong>r approach tomeasuring coverage, we compared a collection <strong>of</strong> r<strong>and</strong>om rawsequence reads to <strong>the</strong> existing draft <strong>genome</strong> sequence. In principle,874 © 2001 Macmillan Magazines Ltd NATURE | VOL 409 | 15 FEBRUARY 2001 | www.nature.com