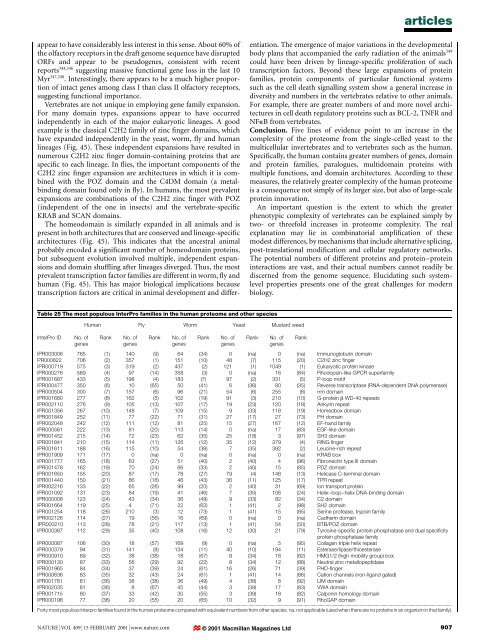
articlesappear to have considerably less interest in this sense. About 60% <strong>of</strong><strong>the</strong> olfactory receptors in <strong>the</strong> draft <strong>genome</strong> sequence have disruptedORFs <strong>and</strong> appear to be pseudogenes, consistent with recentreports 344,346 suggesting massive functional gene loss in <strong>the</strong> last 10Myr 347,348 . Interestingly, <strong>the</strong>re appears to be a much higher proportion<strong>of</strong> intact genes among class I than class II olfactory receptors,suggesting functional importance.Vertebrates are not unique in employing gene family expansion.For many domain types, expansions appear to have occurredindependently in each <strong>of</strong> <strong>the</strong> major eukaryotic lineages. A goodexample is <strong>the</strong> classical C2H2 family <strong>of</strong> zinc ®nger domains, whichhave exp<strong>and</strong>ed independently in <strong>the</strong> yeast, worm, ¯y <strong>and</strong> <strong>human</strong>lineages (Fig. 45). These independent expansions have resulted innumerous C2H2 zinc ®nger domain-containing proteins that arespeci®c to each lineage. In ¯ies, <strong>the</strong> important components <strong>of</strong> <strong>the</strong>C2H2 zinc ®nger expansion are architectures in which it is combinedwith <strong>the</strong> POZ domain <strong>and</strong> <strong>the</strong> C4DM domain (a metalbindingdomain found only in ¯y). In <strong>human</strong>s, <strong>the</strong> most prevalentexpansions are combinations <strong>of</strong> <strong>the</strong> C2H2 zinc ®nger with POZ(independent <strong>of</strong> <strong>the</strong> one in insects) <strong>and</strong> <strong>the</strong> vertebrate-speci®cKRAB <strong>and</strong> SCAN domains.The homeodomain is similarly exp<strong>and</strong>ed in all animals <strong>and</strong> ispresent in both architectures that are conserved <strong>and</strong> lineage-speci®carchitectures (Fig. 45). This indicates that <strong>the</strong> ancestral animalprobably encoded a signi®cant number <strong>of</strong> homeodomain proteins,but subsequent evolution involved multiple, independent expansions<strong>and</strong> domain shuf¯ing after lineages diverged. Thus, <strong>the</strong> mostprevalent transcription factor families are different in worm, ¯y <strong>and</strong><strong>human</strong> (Fig. 45). This has major biological implications becausetranscription factors are critical in animal development <strong>and</strong> differentiation.The emergence <strong>of</strong> major variations in <strong>the</strong> developmentalbody plans that accompanied <strong>the</strong> early radiation <strong>of</strong> <strong>the</strong> animals 349could have been driven by lineage-speci®c proliferation <strong>of</strong> suchtranscription factors. Beyond <strong>the</strong>se large expansions <strong>of</strong> proteinfamilies, protein components <strong>of</strong> particular functional systemssuch as <strong>the</strong> cell death signalling system show a general increase indiversity <strong>and</strong> numbers in <strong>the</strong> vertebrates relative to o<strong>the</strong>r animals.For example, <strong>the</strong>re are greater numbers <strong>of</strong> <strong>and</strong> more novel architecturesin cell death regulatory proteins such as BCL-2, TNFR <strong>and</strong>NFkB from vertebrates.Conclusion. Five lines <strong>of</strong> evidence point to an increase in <strong>the</strong>complexity <strong>of</strong> <strong>the</strong> proteome from <strong>the</strong> single-celled yeast to <strong>the</strong>multicellular invertebrates <strong>and</strong> to vertebrates such as <strong>the</strong> <strong>human</strong>.Speci®cally, <strong>the</strong> <strong>human</strong> contains greater numbers <strong>of</strong> genes, domain<strong>and</strong> protein families, paralogues, multidomain proteins withmultiple functions, <strong>and</strong> domain architectures. According to <strong>the</strong>semeasures, <strong>the</strong> relatively greater complexity <strong>of</strong> <strong>the</strong> <strong>human</strong> proteomeis a consequence not simply <strong>of</strong> its larger size, but also <strong>of</strong> large-scaleprotein innovation.An important question is <strong>the</strong> extent to which <strong>the</strong> greaterphenotypic complexity <strong>of</strong> vertebrates can be explained simply bytwo- or threefold increases in proteome complexity. The realexplanation may lie in combinatorial ampli®cation <strong>of</strong> <strong>the</strong>semodest differences, by mechanisms that include alternative splicing,post-translational modi®cation <strong>and</strong> cellular regulatory networks.The potential numbers <strong>of</strong> different proteins <strong>and</strong> protein±proteininteractions are vast, <strong>and</strong> <strong>the</strong>ir actual numbers cannot readily bediscerned from <strong>the</strong> <strong>genome</strong> sequence. Elucidating such systemlevelproperties presents one <strong>of</strong> <strong>the</strong> great challenges for modernbiology.Table 25 The most populous InterPro families in <strong>the</strong> <strong>human</strong> proteome <strong>and</strong> o<strong>the</strong>r speciesInterPro IDNo. <strong>of</strong>genesHuman Fly Worm Yeast Mustard weedRankNo. <strong>of</strong>genesRankNo. <strong>of</strong>genesRankNo. <strong>of</strong>genesIPR003006 765 (1) 140 (9) 64 (34) 0 (na) 0 (na) Immunoglobulin domainPR000822 706 (2) 357 (1) 151 (10) 48 (7) 115 (20) C2H2 zinc ®ngerIPR000719 575 (3) 319 (2) 437 (2) 121 (1) 1049 (1) Eukaryotic protein kinaseIPR000276 569 (4) 97 (14) 358 (3) 0 (na) 16 (84) Rhodopsin-like GPCR superfamilyIPR001687 433 (5) 198 (4) 183 (7) 97 (2) 331 (5) P-loop motifIPR000477 350 (6) 10 (65) 50 (41) 6 (36) 80 (35) Reverse transcriptase (RNA-dependent DNA polymerase)IPR000504 300 (7) 157 (6) 96 (21) 54 (6) 255 (8) rrm domainIPR001680 277 (8) 162 (5) 102 (19) 91 (3) 210 (10) G-protein b WD-40 repeatsIPR002110 276 (9) 105 (13) 107 (17) 19 (23) 120 (18) Ankyrin repeatIPR001356 267 (10) 148 (7) 109 (15) 9 (33) 118 (19) Homeobox domainIPR001849 252 (11) 77 (22) 71 (31) 27 (17) 27 (73) PH domainIPR002048 242 (12) 111 (12) 81 (25) 15 (27) 167 (12) EF-h<strong>and</strong> familyIPR000561 222 (13) 81 (20) 113 (14) 0 (na) 17 (83) EGF-like domainIPR001452 215 (14) 72 (23) 62 (35) 25 (18) 3 (97) SH3 domainIPR001841 210 (15) 114 (11) 126 (12) 35 (12) 379 (4) RING ®ngerIPR001611 188 (16) 115 (10) 54 (38) 7 (35) 392 (2) Leucine-rich repeatIPR001909 171 (17) 0 (na) 0 (na) 0 (na) 0 (na) KRAB boxIPR001777 165 (18) 63 (27) 51 (40) 2 (40) 4 (96) Fibronectin type III domainIPR001478 162 (19) 70 (24) 66 (33) 2 (40) 15 (85) PDZ domainIPR001650 155 (20) 87 (17) 78 (27) 79 (4) 148 (13) Helicase C-terminal domainIPR001440 150 (21) 86 (18) 46 (43) 36 (11) 125 (17) TPR repeatIPR002216 133 (22) 65 (26) 99 (20) 2 (40) 31 (69) Ion transport proteinIPR001092 131 (23) 84 (19) 41 (46) 7 (35) 106 (24) Helix±loop±helix DNA-binding domainIPR000008 123 (24) 43 (34) 36 (49) 9 (33) 82 (34) C2 domainIPR001664 119 (25) 4 (71) 22 (63) 1 (41) 2 (98) SH2 domainIPR001254 118 (26) 210 (3) 12 (73) 1 (41) 15 (85) Serine protease, trypsin familyIPR002126 114 (27) 19 (56) 16 (69) 0 (na) 0 (na) Cadherin domainIPR000210 113 (28) 78 (21) 117 (13) 1 (41) 54 (50) BTB/POZ domainIPR000387 112 (29) 35 (40) 108 (16) 12 (30) 21 (79) Tyrosine-speci®c protein phosphatase <strong>and</strong> dual speci®cityprotein phosphatase familyIPR000087 106 (30) 18 (57) 169 (9) 0 (na) 5 (95) Collagen triple helix repeatIPR000379 94 (31) 141 (8) 134 (11) 40 (10) 194 (11) Esterase/lipase/thioesteraseIPR000910 89 (32) 38 (38) 18 (67) 8 (34) 18 (82) HMG1/2 (high mobility group) boxIPR000130 87 (33) 56 (29) 92 (22) 8 (34) 12 (88) Neutral zinc metallopeptidaseIPR001965 84 (34) 37 (39) 24 (61) 16 (26) 71 (39) PHD-®ngerIPR000636 83 (35) 32 (43) 24 (61) 1 (41) 14 (86) Cation channels (non-lig<strong>and</strong> gated)IPR001781 81 (36) 38 (38) 36 (49) 4 (38) 8 (92) LIM domainIPR002035 81 (36) 8 (67) 45 (44) 3 (39) 17 (83) VWA domainIPR001715 80 (37) 33 (42) 30 (55) 3 (39) 18 (82) Calponin homology domainIPR000198 77 (38) 20 (55) 20 (65) 10 (32) 9 (91) RhoGAP domain...................................................................................................................................................................................................................................................................................................................................................................Forty most populous Interpro families found in <strong>the</strong> <strong>human</strong> proteome compared with equivalent numbers from o<strong>the</strong>r species. na, not applicable (used when <strong>the</strong>re are no proteins in an organism in that family).RankNo. <strong>of</strong>genesRankNATURE | VOL 409 | 15 FEBRUARY 2001 | www.nature.com © 2001 Macmillan Magazines Ltd907
articlesSegmental history <strong>of</strong> <strong>the</strong> <strong>human</strong> <strong>genome</strong>In bacteria, genomic segments <strong>of</strong>ten convey important informationabout function: genes located close to one ano<strong>the</strong>r <strong>of</strong>ten encodeproteins in a common pathway <strong>and</strong> are regulated in a commonoperon. In mammals, genes found close to each o<strong>the</strong>r only rarelyhave common functions, but <strong>the</strong>y are still interesting because <strong>the</strong>yhave a common history. In fact, <strong>the</strong> study <strong>of</strong> genomic segments canshed light on biological events as long as 500 Myr ago <strong>and</strong> as recentlyas 20,000 years ago.Conserved segments between <strong>human</strong> <strong>and</strong> mouseHumans <strong>and</strong> mice shared a common ancestor about 100 Myr ago.Despite <strong>the</strong> 200 Myr <strong>of</strong> evolutionary distance between <strong>the</strong> species, asigni®cant fraction <strong>of</strong> genes show synteny between <strong>the</strong> two, beingpreserved within conserved segments. Genes tightly linked in onemammalian species tend to be linked in o<strong>the</strong>rs. In fact, conservedsegments have been observed in even more distant species: <strong>human</strong>sshow conserved segments with ®sh 350,351 <strong>and</strong> even with invertebratessuch as ¯y <strong>and</strong> worm 352 . In general, <strong>the</strong> likelihood that a syntenicrelationship will be disrupted correlates with <strong>the</strong> physical distancebetween <strong>the</strong> loci <strong>and</strong> <strong>the</strong> evolutionary distance between <strong>the</strong> species.Studying conserved segments between <strong>human</strong> <strong>and</strong> mouse hasseveral uses. First, conservation <strong>of</strong> gene order has been used toidentify likely orthologues between <strong>the</strong> species, particularly wheninvestigating disease phenotypes. Second, <strong>the</strong> study <strong>of</strong> conservedsegments among <strong>genome</strong>s helps us to deduce evolutionary ancestry.Fly (number <strong>of</strong> genes)4003503002502820058 71501032117 15 12 9100 36437 23 2129 20 1334 2211351933 18 145027 263130242516600 100 200 300 400 500 600 700 800 900Human (number <strong>of</strong> genes)Figure 44 Relative expansions <strong>of</strong> protein families between <strong>human</strong> <strong>and</strong> ¯y. These datahave not been normalized for proteomic size differences. Blue line, equality betweennormalized family sizes in <strong>the</strong> two organisms. Green line, equality between unnormalizedfamily sizes. Numbered InterPro entries: (1) immunoglobulin domain [IPR003006]; (2) zinc®nger, C2H2 type [IPR000822]; (3) eukaryotic protein kinase [IPR000719]; (4) rhodopsinlikeGPCR superfamily [IPR000276]; (5) ATP/GTP-binding site motif A (P-loop)[IPR001687]; (6) reverse transcriptase (RNA-dependent DNA polymerase) [IPR000477];(7) RNA-binding region RNP-1 (RNA recognition motif) [IPR000504]; (8) G-proteinb WD-40 repeats [IPR001680]; (9) ankyrin repeat [IPR002110]; (10) homeobox domain[IPR001356]; (11) PH domain [IPR001849]; (12) EF-h<strong>and</strong> family [IPR002048]; (13) EGFlikedomain [IPR000561]; (14) Src homology 3 (SH3) domain [IPR001452]; (15) RING®nger [IPR001841]; (16) KRAB box [IPR001909]; (17) leucine-rich repeat [IPR001611];(18) ®bronectin type III domain [IPR001777]; (19) PDZ domain (also known as DHR orGLGF) [IPR001478]; (20) TPR repeat [IPR001440]; (21) helicase C-terminal domain[IPR001650]; (22) ion transport protein [IPR002216]; (23) helix±loop±helix DNA-bindingdomain [IPR001092]; (24) cadherin domain [IPR002126]; (25) intermediate ®lamentproteins [IPR001664]; (26) C2 domain [IPR000008]; (27) Src homology 2 (SH2) domain[IPR000980]; (28) serine proteases, trypsin family [IPR001254]; (29) BTB/POZ domain[IPR000210]; (30) tyrosine-speci®c protein phosphatase <strong>and</strong> dual speci®city proteinphosphatase family [IPR000387]; (31) collagen triple helix repeat [IPR000087]; (32)esterase/lipase/thioesterase [IPR000379]; (33) neutral zinc metallopeptidases, zincbindingregion [IPR000130]; (34) ATP-binding transport protein, 2nd P-loop motif[IPR001051]; (35) ABC transporters family [IPR001617]; (36) cytochrome P450 enzyme[IPR001128]; (37) insect cuticle protein [IPR000618].32And third, detailed comparative maps may assist in <strong>the</strong> assembly <strong>of</strong><strong>the</strong> mouse sequence, using <strong>the</strong> <strong>human</strong> sequence as a scaffold.Two types <strong>of</strong> linkage conservation are commonly described 353 .`Conserved synteny' indicates that at least two genes that reside on acommon chromosome in one species are also located on a commonchromosome in <strong>the</strong> o<strong>the</strong>r species. Syntenic loci are said to lie in a`conserved segment' when not only <strong>the</strong> chromosomal position but<strong>the</strong> linear order <strong>of</strong> <strong>the</strong> loci has been preserved, without interruptionby o<strong>the</strong>r chromosomal rearrangements.An initial survey <strong>of</strong> homologous loci in <strong>human</strong> <strong>and</strong> mouse 354suggested that <strong>the</strong> total number <strong>of</strong> conserved segments would beabout 180. Subsequent estimates based on increasingly detailedcomparative maps have remained close to this projection 353,355,356(http://www.informatics.jax.org). The distribution <strong>of</strong> segmentlengths has corresponded reasonably well to <strong>the</strong> truncated negativeexponential curve predicted by <strong>the</strong> r<strong>and</strong>om breakage model 357 .The availability <strong>of</strong> a draft <strong>human</strong> <strong>genome</strong> sequence allows <strong>the</strong> ®rstglobal <strong>human</strong>±mouse comparison in which <strong>human</strong> physical distancescan be measured in Mb, ra<strong>the</strong>r than cM or orthologous genecounts. We identi®ed likely orthologues by reciprocal comparison<strong>of</strong> <strong>the</strong> <strong>human</strong> <strong>and</strong> mouse mRNAs in <strong>the</strong> LocusLink database, usingmegaBLAST. For each orthologous pair, we mapped <strong>the</strong> location <strong>of</strong><strong>the</strong> <strong>human</strong> gene in <strong>the</strong> draft <strong>genome</strong> sequence <strong>and</strong> <strong>the</strong>n checked <strong>the</strong>location <strong>of</strong> <strong>the</strong> mouse gene in <strong>the</strong> Mouse Genome Informaticsdatabase (http://www.informatics.jax.org). Using a conservativethreshold, we identi®ed 3,920 orthologous pairs in which <strong>the</strong><strong>human</strong> gene could be mapped on <strong>the</strong> draft <strong>genome</strong> sequence withhigh con®dence. Of <strong>the</strong>se, 2,998 corresponding mouse genes had aknown position in <strong>the</strong> mouse <strong>genome</strong>. We <strong>the</strong>n searched forde®nitive conserved segments, de®ned as <strong>human</strong> regions containingorthologues <strong>of</strong> at least two genes from <strong>the</strong> same mouse chromosomeregion (, 15 cM) without interruption by segments from o<strong>the</strong>rchromosomes.We identi®ed 183 de®nitive conserved segments (Fig. 46). Theaverage segment length was 15.4 Mb, with <strong>the</strong> largest segment being90.5 Mb <strong>and</strong> <strong>the</strong> smallest 24 kb. There were also 141 `singletons',segments that contained only a single locus; <strong>the</strong>se are not counted in<strong>the</strong> statistics. Although some <strong>of</strong> <strong>the</strong>se could be short conservedsegments, <strong>the</strong>y could also re¯ect incorrect choices <strong>of</strong> orthologues orproblems with <strong>the</strong> <strong>human</strong> or mouse maps. Because <strong>of</strong> this conservativeapproach, <strong>the</strong> observed number <strong>of</strong> de®nitive segments islikely be lower than <strong>the</strong> correct total. One piece <strong>of</strong> evidence for thisconclusion comes from a more detailed <strong>analysis</strong> on <strong>human</strong> chromosome7 (ref. 358), which identi®ed 20 conserved segments, <strong>of</strong>which three were singletons. Our <strong>analysis</strong> revealed only 13 de®nitivesegments on this chromosome, with nine singletons.The frequency <strong>of</strong> observing a particular gene count in a conservedsegment is plotted on a logarithmic scale in Fig. 47. If chromosomalbreaks occur in a r<strong>and</strong>om fashion (as has been proposed) <strong>and</strong>differences in gene density are ignored, a roughly straight lineshould result. There is a clear excess for n = 1, suggesting that 50%or more <strong>of</strong> <strong>the</strong> singletons are indeed artefactual. Thus, we estimatethat true number <strong>of</strong> conserved segments is around 190±230, in goodagreement with <strong>the</strong> original Nadeau±Taylor prediction 354 .Figure 48 shows a plot <strong>of</strong> <strong>the</strong> frequency <strong>of</strong> lengths <strong>of</strong> conservedsegments, where <strong>the</strong> x-axis scale is shown in Mb. As before, <strong>the</strong>re is afair amount <strong>of</strong> scatter in <strong>the</strong> data for <strong>the</strong> larger segments (where <strong>the</strong>numbers are small), but <strong>the</strong> trend appears to be consistent with ar<strong>and</strong>om breakage model.We attempted to ascertain whe<strong>the</strong>r <strong>the</strong> breakpoint regions haveany special characteristics. This <strong>analysis</strong> was complicated by imprecisionin <strong>the</strong> positioning <strong>of</strong> <strong>the</strong>se breaks, which will tend to blur anyrelationships. With 2,998 orthologues, <strong>the</strong> average interval withinwhich a break is known to have occurred is about 1.1 Mb. Wecompared <strong>the</strong> aggregate features <strong>of</strong> <strong>the</strong>se breakpoint intervals with<strong>the</strong> <strong>genome</strong> as a whole. The mean gene density was lower inbreakpoint regions than in <strong>the</strong> conserved segments (13.8 versus908 © 2001 Macmillan Magazines Ltd NATURE | VOL 409 | 15 FEBRUARY 2001 | www.nature.com