Initial sequencing and analysis of the human genome - Vitagenes
Initial sequencing and analysis of the human genome - Vitagenes
Initial sequencing and analysis of the human genome - Vitagenes

Create successful ePaper yourself
Turn your PDF publications into a flip-book with our unique Google optimized e-Paper software.
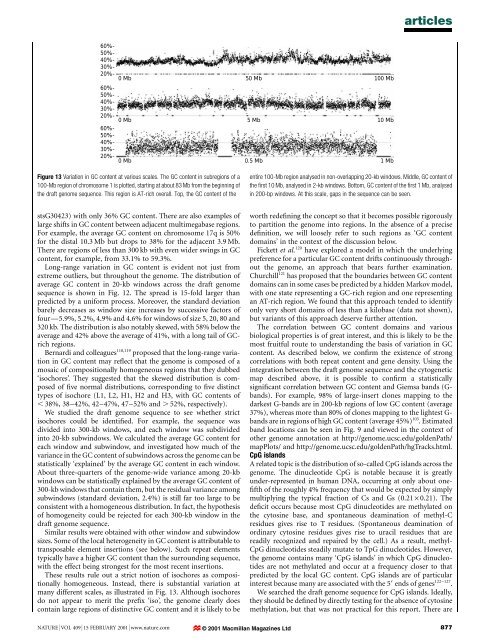
articles60%-50%-40%-30%-20%-60%-50%-40%-30%-20%-60%-50%-40%-30%-20%-0 Mb0 Mb0 Mb50 Mb5 Mb0.5 Mb100 Mb10 Mb1 MbFigure 13 Variation in GC content at various scales. The GC content in subregions <strong>of</strong> a100-Mb region <strong>of</strong> chromosome 1 is plotted, starting at about 83 Mb from <strong>the</strong> beginning <strong>of</strong><strong>the</strong> draft <strong>genome</strong> sequence. This region is AT-rich overall. Top, <strong>the</strong> GC content <strong>of</strong> <strong>the</strong>entire 100-Mb region analysed in non-overlapping 20-kb windows. Middle, GC content <strong>of</strong><strong>the</strong> ®rst 10 Mb, analysed in 2-kb windows. Bottom, GC content <strong>of</strong> <strong>the</strong> ®rst 1 Mb, analysedin 200-bp windows. At this scale, gaps in <strong>the</strong> sequence can be seen.stsG30423) with only 36% GC content. There are also examples <strong>of</strong>large shifts in GC content between adjacent multimegabase regions.For example, <strong>the</strong> average GC content on chromosome 17q is 50%for <strong>the</strong> distal 10.3 Mb but drops to 38% for <strong>the</strong> adjacent 3.9 Mb.There are regions <strong>of</strong> less than 300 kb with even wider swings in GCcontent, for example, from 33.1% to 59.3%.Long-range variation in GC content is evident not just fromextreme outliers, but throughout <strong>the</strong> <strong>genome</strong>. The distribution <strong>of</strong>average GC content in 20-kb windows across <strong>the</strong> draft <strong>genome</strong>sequence is shown in Fig. 12. The spread is 15-fold larger thanpredicted by a uniform process. Moreover, <strong>the</strong> st<strong>and</strong>ard deviationbarely decreases as window size increases by successive factors <strong>of</strong>fourÐ5.9%, 5.2%, 4.9% <strong>and</strong> 4.6% for windows <strong>of</strong> size 5, 20, 80 <strong>and</strong>320 kb. The distribution is also notably skewed, with 58% below <strong>the</strong>average <strong>and</strong> 42% above <strong>the</strong> average <strong>of</strong> 41%, with a long tail <strong>of</strong> GCrichregions.Bernardi <strong>and</strong> colleagues 118,119 proposed that <strong>the</strong> long-range variationin GC content may re¯ect that <strong>the</strong> <strong>genome</strong> is composed <strong>of</strong> amosaic <strong>of</strong> compositionally homogeneous regions that <strong>the</strong>y dubbed`isochores'. They suggested that <strong>the</strong> skewed distribution is composed<strong>of</strong> ®ve normal distributions, corresponding to ®ve distincttypes <strong>of</strong> isochore (L1, L2, H1, H2 <strong>and</strong> H3, with GC contents <strong>of</strong>, 38%, 38±42%, 42±47%, 47±52% <strong>and</strong> . 52%, respectively).We studied <strong>the</strong> draft <strong>genome</strong> sequence to see whe<strong>the</strong>r strictisochores could be identi®ed. For example, <strong>the</strong> sequence wasdivided into 300-kb windows, <strong>and</strong> each window was subdividedinto 20-kb subwindows. We calculated <strong>the</strong> average GC content foreach window <strong>and</strong> subwindow, <strong>and</strong> investigated how much <strong>of</strong> <strong>the</strong>variance in <strong>the</strong> GC content <strong>of</strong> subwindows across <strong>the</strong> <strong>genome</strong> can bestatistically `explained' by <strong>the</strong> average GC content in each window.About three-quarters <strong>of</strong> <strong>the</strong> <strong>genome</strong>-wide variance among 20-kbwindows can be statistically explained by <strong>the</strong> average GC content <strong>of</strong>300-kb windows that contain <strong>the</strong>m, but <strong>the</strong> residual variance amongsubwindows (st<strong>and</strong>ard deviation, 2.4%) is still far too large to beconsistent with a homogeneous distribution. In fact, <strong>the</strong> hypo<strong>the</strong>sis<strong>of</strong> homogeneity could be rejected for each 300-kb window in <strong>the</strong>draft <strong>genome</strong> sequence.Similar results were obtained with o<strong>the</strong>r window <strong>and</strong> subwindowsizes. Some <strong>of</strong> <strong>the</strong> local heterogeneity in GC content is attributable totransposable element insertions (see below). Such repeat elementstypically have a higher GC content than <strong>the</strong> surrounding sequence,with <strong>the</strong> effect being strongest for <strong>the</strong> most recent insertions.These results rule out a strict notion <strong>of</strong> isochores as compositionallyhomogeneous. Instead, <strong>the</strong>re is substantial variation atmany different scales, as illustrated in Fig. 13. Although isochoresdo not appear to merit <strong>the</strong> pre®x `iso', <strong>the</strong> <strong>genome</strong> clearly doescontain large regions <strong>of</strong> distinctive GC content <strong>and</strong> it is likely to beworth rede®ning <strong>the</strong> concept so that it becomes possible rigorouslyto partition <strong>the</strong> <strong>genome</strong> into regions. In <strong>the</strong> absence <strong>of</strong> a precisede®nition, we will loosely refer to such regions as `GC contentdomains' in <strong>the</strong> context <strong>of</strong> <strong>the</strong> discussion below.Fickett et al. 120 have explored a model in which <strong>the</strong> underlyingpreference for a particular GC content drifts continuously throughout<strong>the</strong> <strong>genome</strong>, an approach that bears fur<strong>the</strong>r examination.Churchill 121 has proposed that <strong>the</strong> boundaries between GC contentdomains can in some cases be predicted by a hidden Markov model,with one state representing a GC-rich region <strong>and</strong> one representingan AT-rich region. We found that this approach tended to identifyonly very short domains <strong>of</strong> less than a kilobase (data not shown),but variants <strong>of</strong> this approach deserve fur<strong>the</strong>r attention.The correlation between GC content domains <strong>and</strong> variousbiological properties is <strong>of</strong> great interest, <strong>and</strong> this is likely to be <strong>the</strong>most fruitful route to underst<strong>and</strong>ing <strong>the</strong> basis <strong>of</strong> variation in GCcontent. As described below, we con®rm <strong>the</strong> existence <strong>of</strong> strongcorrelations with both repeat content <strong>and</strong> gene density. Using <strong>the</strong>integration between <strong>the</strong> draft <strong>genome</strong> sequence <strong>and</strong> <strong>the</strong> cytogeneticmap described above, it is possible to con®rm a statisticallysigni®cant correlation between GC content <strong>and</strong> Giemsa b<strong>and</strong>s (Gb<strong>and</strong>s).For example, 98% <strong>of</strong> large-insert clones mapping to <strong>the</strong>darkest G-b<strong>and</strong>s are in 200-kb regions <strong>of</strong> low GC content (average37%), whereas more than 80% <strong>of</strong> clones mapping to <strong>the</strong> lightest G-b<strong>and</strong>s are in regions <strong>of</strong> high GC content (average 45%) 103 . Estimatedb<strong>and</strong> locations can be seen in Fig. 9 <strong>and</strong> viewed in <strong>the</strong> context <strong>of</strong>o<strong>the</strong>r <strong>genome</strong> annotation at http://<strong>genome</strong>.ucsc.edu/goldenPath/mapPlots/ <strong>and</strong> http://<strong>genome</strong>.ucsc.edu/goldenPath/hgTracks.html.CpG isl<strong>and</strong>sA related topic is <strong>the</strong> distribution <strong>of</strong> so-called CpG isl<strong>and</strong>s across <strong>the</strong><strong>genome</strong>. The dinucleotide CpG is notable because it is greatlyunder-represented in <strong>human</strong> DNA, occurring at only about one-®fth <strong>of</strong> <strong>the</strong> roughly 4% frequency that would be expected by simplymultiplying <strong>the</strong> typical fraction <strong>of</strong> Cs <strong>and</strong> Gs (0.21 ´ 0.21). Thede®cit occurs because most CpG dinucleotides are methylated on<strong>the</strong> cytosine base, <strong>and</strong> spontaneous deamination <strong>of</strong> methyl-Cresidues gives rise to T residues. (Spontaneous deamination <strong>of</strong>ordinary cytosine residues gives rise to uracil residues that arereadily recognized <strong>and</strong> repaired by <strong>the</strong> cell.) As a result, methyl-CpG dinucleotides steadily mutate to TpG dinucleotides. However,<strong>the</strong> <strong>genome</strong> contains many `CpG isl<strong>and</strong>s' in which CpG dinucleotidesare not methylated <strong>and</strong> occur at a frequency closer to thatpredicted by <strong>the</strong> local GC content. CpG isl<strong>and</strong>s are <strong>of</strong> particularinterest because many are associated with <strong>the</strong> 59 ends <strong>of</strong> genes 122±127 .We searched <strong>the</strong> draft <strong>genome</strong> sequence for CpG isl<strong>and</strong>s. Ideally,<strong>the</strong>y should be de®ned by directly testing for <strong>the</strong> absence <strong>of</strong> cytosinemethylation, but that was not practical for this report. There areNATURE | VOL 409 | 15 FEBRUARY 2001 | www.nature.com © 2001 Macmillan Magazines Ltd877