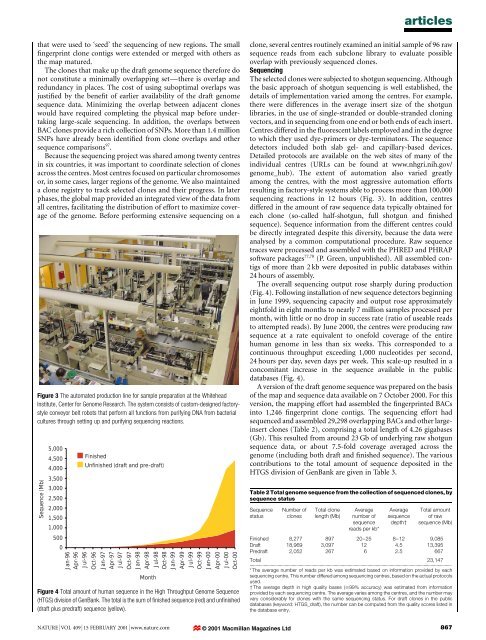
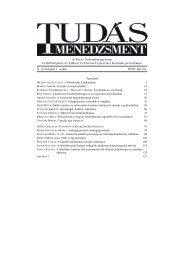
articlesthat were used to `seed' <strong>the</strong> <strong>sequencing</strong> <strong>of</strong> new regions. The small®ngerprint clone contigs were extended or merged with o<strong>the</strong>rs as<strong>the</strong> map matured.The clones that make up <strong>the</strong> draft <strong>genome</strong> sequence <strong>the</strong>refore donot constitute a minimally overlapping setÐ<strong>the</strong>re is overlap <strong>and</strong>redundancy in places. The cost <strong>of</strong> using suboptimal overlaps wasjusti®ed by <strong>the</strong> bene®t <strong>of</strong> earlier availability <strong>of</strong> <strong>the</strong> draft <strong>genome</strong>sequence data. Minimizing <strong>the</strong> overlap between adjacent cloneswould have required completing <strong>the</strong> physical map before undertakinglarge-scale <strong>sequencing</strong>. In addition, <strong>the</strong> overlaps betweenBAC clones provide a rich collection <strong>of</strong> SNPs. More than 1.4 millionSNPs have already been identi®ed from clone overlaps <strong>and</strong> o<strong>the</strong>rsequence comparisons 97 .Because <strong>the</strong> <strong>sequencing</strong> project was shared among twenty centresin six countries, it was important to coordinate selection <strong>of</strong> clonesacross <strong>the</strong> centres. Most centres focused on particular chromosomesor, in some cases, larger regions <strong>of</strong> <strong>the</strong> <strong>genome</strong>. We also maintaineda clone registry to track selected clones <strong>and</strong> <strong>the</strong>ir progress. In laterphases, <strong>the</strong> global map provided an integrated view <strong>of</strong> <strong>the</strong> data fromall centres, facilitating <strong>the</strong> distribution <strong>of</strong> effort to maximize coverage<strong>of</strong> <strong>the</strong> <strong>genome</strong>. Before performing extensive <strong>sequencing</strong> on aFigure 3 The automated production line for sample preparation at <strong>the</strong> WhiteheadInstitute, Center for Genome Research. The system consists <strong>of</strong> custom-designed factorystyleconveyor belt robots that perform all functions from purifying DNA from bacterialcultures through setting up <strong>and</strong> purifying <strong>sequencing</strong> reactions.Sequence (Mb)5,0004,5004,0003,5003,0002,5002,0001,5001,0005000Jan-96Apr-96Jul-96FinishedUnfinished (draft <strong>and</strong> pre-draft)Oct-96Jan-97Apr-97Jul-97Oct-97Jan-98Apr-98MonthJul-98Oct-98Jan-99Apr-99Jul-99Oct-99Jan-00Apr-00Jul-00Oct-00Figure 4 Total amount <strong>of</strong> <strong>human</strong> sequence in <strong>the</strong> High Throughput Genome Sequence(HTGS) division <strong>of</strong> GenBank. The total is <strong>the</strong> sum <strong>of</strong> ®nished sequence (red) <strong>and</strong> un®nished(draft plus predraft) sequence (yellow).clone, several centres routinely examined an initial sample <strong>of</strong> 96 rawsequence reads from each subclone library to evaluate possibleoverlap with previously sequenced clones.SequencingThe selected clones were subjected to shotgun <strong>sequencing</strong>. Although<strong>the</strong> basic approach <strong>of</strong> shotgun <strong>sequencing</strong> is well established, <strong>the</strong>details <strong>of</strong> implementation varied among <strong>the</strong> centres. For example,<strong>the</strong>re were differences in <strong>the</strong> average insert size <strong>of</strong> <strong>the</strong> shotgunlibraries, in <strong>the</strong> use <strong>of</strong> single-str<strong>and</strong>ed or double-str<strong>and</strong>ed cloningvectors, <strong>and</strong> in <strong>sequencing</strong> from one end or both ends <strong>of</strong> each insert.Centres differed in <strong>the</strong> ¯uorescent labels employed <strong>and</strong> in <strong>the</strong> degreeto which <strong>the</strong>y used dye-primers or dye-terminators. The sequencedetectors included both slab gel- <strong>and</strong> capillary-based devices.Detailed protocols are available on <strong>the</strong> web sites <strong>of</strong> many <strong>of</strong> <strong>the</strong>individual centres (URLs can be found at www.nhgri.nih.gov/<strong>genome</strong>_hub). The extent <strong>of</strong> automation also varied greatlyamong <strong>the</strong> centres, with <strong>the</strong> most aggressive automation effortsresulting in factory-style systems able to process more than 100,000<strong>sequencing</strong> reactions in 12 hours (Fig. 3). In addition, centresdiffered in <strong>the</strong> amount <strong>of</strong> raw sequence data typically obtained foreach clone (so-called half-shotgun, full shotgun <strong>and</strong> ®nishedsequence). Sequence information from <strong>the</strong> different centres couldbe directly integrated despite this diversity, because <strong>the</strong> data wereanalysed by a common computational procedure. Raw sequencetraces were processed <strong>and</strong> assembled with <strong>the</strong> PHRED <strong>and</strong> PHRAPs<strong>of</strong>tware packages 77,78 (P. Green, unpublished). All assembled contigs<strong>of</strong> more than 2 kb were deposited in public databases within24 hours <strong>of</strong> assembly.The overall <strong>sequencing</strong> output rose sharply during production(Fig. 4). Following installation <strong>of</strong> new sequence detectors beginningin June 1999, <strong>sequencing</strong> capacity <strong>and</strong> output rose approximatelyeightfold in eight months to nearly 7 million samples processed permonth, with little or no drop in success rate (ratio <strong>of</strong> useable readsto attempted reads). By June 2000, <strong>the</strong> centres were producing rawsequence at a rate equivalent to onefold coverage <strong>of</strong> <strong>the</strong> entire<strong>human</strong> <strong>genome</strong> in less than six weeks. This corresponded to acontinuous throughput exceeding 1,000 nucleotides per second,24 hours per day, seven days per week. This scale-up resulted in aconcomitant increase in <strong>the</strong> sequence available in <strong>the</strong> publicdatabases (Fig. 4).A version <strong>of</strong> <strong>the</strong> draft <strong>genome</strong> sequence was prepared on <strong>the</strong> basis<strong>of</strong> <strong>the</strong> map <strong>and</strong> sequence data available on 7 October 2000. For thisversion, <strong>the</strong> mapping effort had assembled <strong>the</strong> ®ngerprinted BACsinto 1,246 ®ngerprint clone contigs. The <strong>sequencing</strong> effort hadsequenced <strong>and</strong> assembled 29,298 overlapping BACs <strong>and</strong> o<strong>the</strong>r largeinsertclones (Table 2), comprising a total length <strong>of</strong> 4.26 gigabases(Gb). This resulted from around 23 Gb <strong>of</strong> underlying raw shotgunsequence data, or about 7.5-fold coverage averaged across <strong>the</strong><strong>genome</strong> (including both draft <strong>and</strong> ®nished sequence). The variouscontributions to <strong>the</strong> total amount <strong>of</strong> sequence deposited in <strong>the</strong>HTGS division <strong>of</strong> GenBank are given in Table 3.Table 2 Total <strong>genome</strong> sequence from <strong>the</strong> collection <strong>of</strong> sequenced clones, bysequence statusSequencestatusNumber <strong>of</strong>clonesTotal clonelength (Mb)Averagenumber <strong>of</strong>sequencereads per kb*Averagesequencedepth²Total amount<strong>of</strong> rawsequence (Mb)Finished 8,277 897 20±25 8±12 9,085Draft 18,969 3,097 12 4.5 13,395Predraft 2,052 267 6 2.5 667Total 23,147.............................................................................................................................................................................* The average number <strong>of</strong> reads per kb was estimated based on information provided by each<strong>sequencing</strong> centre. This number differed among <strong>sequencing</strong> centres, based on <strong>the</strong> actual protocolsused.² The average depth in high quality bases ($99% accuracy) was estimated from informationprovided by each <strong>sequencing</strong> centre. The average varies among <strong>the</strong> centres, <strong>and</strong> <strong>the</strong> number mayvary considerably for clones with <strong>the</strong> same <strong>sequencing</strong> status. For draft clones in <strong>the</strong> publicdatabases (keyword: HTGS_draft), <strong>the</strong> number can be computed from <strong>the</strong> quality scores listed in<strong>the</strong> database entry.NATURE | VOL 409 | 15 FEBRUARY 2001 | www.nature.com © 2001 Macmillan Magazines Ltd867
articlesBy agreement among <strong>the</strong> centres, <strong>the</strong> collection <strong>of</strong> draft clonesproduced by each centre was required to have fourfold averagesequence coverage, with no clone below threefold. (For this purpose,sequence coverage was de®ned as <strong>the</strong> average number <strong>of</strong> timesthat each base was independently read with a base-quality scorecorresponding to at least 99% accuracy.) We attained an overallaverage <strong>of</strong> 4.5-fold coverage across <strong>the</strong> <strong>genome</strong> for draft clones. Afew <strong>of</strong> <strong>the</strong> sequenced clones fell below <strong>the</strong> minimum <strong>of</strong> threefoldsequence coverage or have not been formally designated by centresas meeting draft st<strong>and</strong>ards; <strong>the</strong>se are referred to as predraft (Table 2).Some <strong>of</strong> <strong>the</strong>se are clones that span remaining gaps in <strong>the</strong> draft<strong>genome</strong> sequence <strong>and</strong> were in <strong>the</strong> process <strong>of</strong> being sequenced on 7October 2000; a few are old submissions from centres that are nolonger active.The lengths <strong>of</strong> <strong>the</strong> initial sequence contigs in <strong>the</strong> draft clones varyas a function <strong>of</strong> coverage, but half <strong>of</strong> all nucleotides reside in initialsequence contigs <strong>of</strong> at least 21.7 kb (see below). Various properties<strong>of</strong> <strong>the</strong> draft clones can be assessed from instances in which <strong>the</strong>re wassubstantial overlap between a draft clone <strong>and</strong> a ®nished (or nearly®nished) clone. By examining <strong>the</strong> sequence alignments in <strong>the</strong>overlap regions, we estimated that <strong>the</strong> initial sequence contigs in adraft sequence clone cover an average <strong>of</strong> about 96% <strong>of</strong> <strong>the</strong> clone <strong>and</strong>are separated by gaps with an average size <strong>of</strong> about 500 bp.Although <strong>the</strong> main emphasis was on producing a draft <strong>genome</strong>sequence, <strong>the</strong> centres also maintained sequence ®nishing activitiesduring this period, leading to a tw<strong>of</strong>old increase in ®nishedsequence from June 1999 to June 2000 (Fig. 4). The total amount<strong>of</strong> <strong>human</strong> sequence in this ®nal form stood at more than 835 Mb on7 October 2000, or more than 25% <strong>of</strong> <strong>the</strong> <strong>human</strong> <strong>genome</strong>. Thisincludes <strong>the</strong> ®nished sequences <strong>of</strong> chromosomes 21 <strong>and</strong> 22 (refs 93,94). As centres have begun to shift from draft to ®nished <strong>sequencing</strong>in <strong>the</strong> last quarter <strong>of</strong> 2000, <strong>the</strong> production <strong>of</strong> ®nished sequence hasincreased to an annualized rate <strong>of</strong> 1 Gb per year <strong>and</strong> is continuing torise.Table 3 Total <strong>human</strong> sequence deposited in <strong>the</strong> HTGS division <strong>of</strong> GenBankSequencing centreTotal <strong>human</strong>sequence (kb)Finished <strong>human</strong>sequence (kb)Whitehead Institute, Center for Genome Research* 1,196,888 46,560The Sanger Centre* 970,789 284,353Washington University Genome Sequencing Center* 765,898 175,279US DOE Joint Genome Institute 377,998 78,486Baylor College <strong>of</strong> Medicine Human Genome Sequencing 345,125 53,418CenterRIKEN Genomic Sciences Center 203,166 16,971Genoscope 85,995 48,808GTC Sequencing Center 71,357 7,014Department <strong>of</strong> Genome Analysis, Institute <strong>of</strong> Molecular 49,865 17,788BiotechnologyBeijing Genomics Institute/Human Genome Center 42,865 6,297Multimegabase Sequencing Center; Institute for Systems 31,241 9,676BiologyStanford Genome Technology Center 29,728 3,530The Stanford Human Genome Center <strong>and</strong> Department <strong>of</strong> 28,162 9,121GeneticsUniversity <strong>of</strong> Washington Genome Center 24,115 14,692Keio University 17,364 13,058University <strong>of</strong> Texas Southwestern Medical Center at Dallas 11,670 7,028University <strong>of</strong> Oklahoma Advanced Center for Genome 10,071 9,155TechnologyMax Planck Institute for Molecular Genetics 7,650 2,940GBF ± German Research Centre for Biotechnology 4,639 2,338Cold Spring Harbor Laboratory Lita Annenberg Hazen 4,338 2,104Genome CenterO<strong>the</strong>r 59,574 35,911Total 4,338,224 842,027.............................................................................................................................................................................Total <strong>human</strong> sequence deposited in GenBank by members <strong>of</strong> <strong>the</strong> International Human GenomeSequencing Consortium, as <strong>of</strong> 8 October 2000.The amount <strong>of</strong> total sequence (®nished plus draftplus predraft) is shown in <strong>the</strong> second column <strong>and</strong> <strong>the</strong> amount <strong>of</strong> ®nished sequence is shown in<strong>the</strong> third column. Total sequence differs from totals in Tables 1 <strong>and</strong> 2 because <strong>of</strong> inclusion <strong>of</strong>padding characters <strong>and</strong> <strong>of</strong> some clones not used in assembly. HTGS, high throughput <strong>genome</strong>sequence.*These three centres produced an additional 2.4 Gb <strong>of</strong> raw plasmid paired-end reads (see Table 4),consisting <strong>of</strong> 0.99 Gb from Whitehead Institute, 0.66 Gb from The Sanger Centre <strong>and</strong> 0.75 Gb fromWashington University.In addition to <strong>sequencing</strong> large-insert clones, three centresgenerated a large collection <strong>of</strong> r<strong>and</strong>om raw sequence reads fromwhole-<strong>genome</strong> shotgun libraries (Table 4; ref. 98). These 5.77million successful sequences contained 2.4 Gb <strong>of</strong> high-qualitybases; this corresponds to about 0.75-fold coverage <strong>and</strong> would bestatistically expected to include about 50% <strong>of</strong> <strong>the</strong> nucleotides in <strong>the</strong><strong>human</strong> <strong>genome</strong> (data available at http://snp.cshl.org/data). Theprimary objective <strong>of</strong> this work was to discover SNPs, by comparing<strong>the</strong>se r<strong>and</strong>om raw sequences (which came from different individuals)with <strong>the</strong> draft <strong>genome</strong> sequence. However, many <strong>of</strong> <strong>the</strong>se rawsequences were obtained from both ends <strong>of</strong> plasmid clones <strong>and</strong><strong>the</strong>reby also provided valuable `linking' information that was usedin sequence assembly. In addition, <strong>the</strong> r<strong>and</strong>om raw sequencesprovide sequence coverage <strong>of</strong> about half <strong>of</strong> <strong>the</strong> nucleotides not yetrepresented in <strong>the</strong> sequenced large-insert clones; <strong>the</strong>se can be usedas probes for portions <strong>of</strong> <strong>the</strong> <strong>genome</strong> not yet recovered.Assembly <strong>of</strong> <strong>the</strong> draft <strong>genome</strong> sequenceWe <strong>the</strong>n set out to assemble <strong>the</strong> sequences from <strong>the</strong> individual largeinsertclones into an integrated draft sequence <strong>of</strong> <strong>the</strong> <strong>human</strong><strong>genome</strong>. The assembly process had to resolve problems arisingfrom <strong>the</strong> draft nature <strong>of</strong> much <strong>of</strong> <strong>the</strong> sequence, from <strong>the</strong> variety <strong>of</strong>clone sources, <strong>and</strong> from <strong>the</strong> high fraction <strong>of</strong> repeated sequences in<strong>the</strong> <strong>human</strong> <strong>genome</strong>. This process involved three steps: ®ltering,layout <strong>and</strong> merging.The entire data set was ®ltered uniformly to eliminate contaminationfrom non<strong>human</strong> sequences <strong>and</strong> o<strong>the</strong>r artefacts that had notalready been removed by <strong>the</strong> individual centres. (Information aboutcontamination was also sent back to <strong>the</strong> centres, which are updating<strong>the</strong> individual entries in <strong>the</strong> public databases.) We also identi®edinstances in which <strong>the</strong> sequence data from one BAC clone wassubstantially contaminated with sequence data from ano<strong>the</strong>r(<strong>human</strong> or non<strong>human</strong>) clone. The problems were resolved inmost instances; 231 clones remained unresolved, <strong>and</strong> <strong>the</strong>se wereeliminated from <strong>the</strong> assembly reported here. Instances <strong>of</strong> lowerlevels <strong>of</strong> cross-contamination (for example, a single 96-well microplatemisassigned to <strong>the</strong> wrong BAC) are more dif®cult to detect;some undoubtedly remain <strong>and</strong> may give rise to small spurioussequence contigs in <strong>the</strong> draft <strong>genome</strong> sequence. Such issues arereadily resolved as <strong>the</strong> clones progress towards ®nished sequence,but <strong>the</strong>y necessitate some caution in certain applications <strong>of</strong> <strong>the</strong>current data.The sequenced clones were <strong>the</strong>n associated with speci®c clones on<strong>the</strong> physical map to produce a `layout'. In principle, sequencedclones that correspond to ®ngerprinted BACs could be directlyassigned by name to ®ngerprint clone contigs on <strong>the</strong> ®ngerprintbasedphysical map. In practice, however, laboratory mixups occasionallyresulted in incorrect assignments. To eliminate such problems,sequenced clones were associated with <strong>the</strong> ®ngerprint clonecontigs in <strong>the</strong> physical map by using <strong>the</strong> sequence data to calculate aTable 4 Plasmid paired-end readsTotal reads deposited* Read pairs² Size range <strong>of</strong> inserts(kb)R<strong>and</strong>om-sheared 3,227,685 1,155,284 1.8±6Enzyme digest 2,539,222 761,010 0.8±4.7Total 5,766,907 1,916,294.............................................................................................................................................................................The plasmid paired-end reads used a mixture <strong>of</strong> DNA from a set <strong>of</strong> 24 samples from <strong>the</strong> DNAPolymorphism Discovery Resource (http://locus.umdnj.edu/nigms/pdr.html). This set <strong>of</strong> 24 anonymousUS residents contains samples from European-Americans, African-Americans, Mexican-Americans, Native Americans <strong>and</strong> Asian-Americans, although <strong>the</strong> ethnicities <strong>of</strong> <strong>the</strong> individualsamples are not identi®ed. Informed consent to contribute samples to <strong>the</strong> DNA PolymorphismDiscovery Resource was obtained from all 450 individuals who contributed samples. Samples from<strong>the</strong> European-American, African-American <strong>and</strong> Mexican-American individuals came from NHANES(http://www.cdc.gov/nchs/nhanes.htm); individuals were recontacted to obtain <strong>the</strong>ir consent for<strong>the</strong> Resource project. New samples were obtained from Asian-Americans whose ancestry wasfrom a variety <strong>of</strong> East <strong>and</strong> South Asian countries. New samples were also obtained for <strong>the</strong> NativeAmericans; tribal permission was obtained ®rst, <strong>and</strong> <strong>the</strong>n individual consents. See http://www.nhgri.nih.gov/Grant_info/Funding/RFA/discover_polymorphisms.html <strong>and</strong> ref. 98.*Re¯ects data deposited with <strong>and</strong> released by The SNP Consortium (see http://snp.cshl.org/data).² Read pairs represents <strong>the</strong> number <strong>of</strong> cases in which sequence from both ends <strong>of</strong> a genomiccloned fragment was determined <strong>and</strong> used in this study as linking information.868 © 2001 Macmillan Magazines Ltd NATURE | VOL 409 | 15 FEBRUARY 2001 | www.nature.com