Mixture Design Tutorial (Part 2 â Optimization) - Statease.info
Mixture Design Tutorial (Part 2 â Optimization) - Statease.info
Mixture Design Tutorial (Part 2 â Optimization) - Statease.info

Create successful ePaper yourself
Turn your PDF publications into a flip-book with our unique Google optimized e-Paper software.
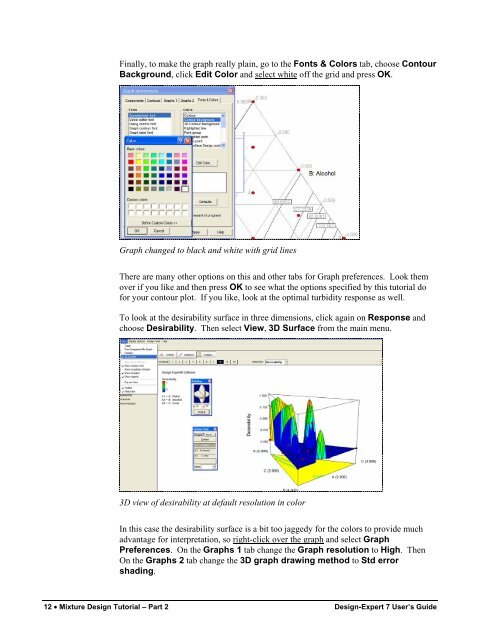
Finally, to make the graph really plain, go to the Fonts & Colors tab, choose ContourBackground, click Edit Color and select white off the grid and press OK.Graph changed to black and white with grid linesThere are many other options on this and other tabs for Graph preferences. Look themover if you like and then press OK to see what the options specified by this tutorial dofor your contour plot. If you like, look at the optimal turbidity response as well.To look at the desirability surface in three dimensions, click again on Response andchoose Desirability. Then select View, 3D Surface from the main menu.3D view of desirability at default resolution in colorIn this case the desirability surface is a bit too jaggedy for the colors to provide muchadvantage for interpretation, so right-click over the graph and select GraphPreferences. On the Graphs 1 tab change the Graph resolution to High. ThenOn the Graphs 2 tab change the 3D graph drawing method to Std errorshading.12 • <strong>Mixture</strong> <strong>Design</strong> <strong>Tutorial</strong> – <strong>Part</strong> 2 <strong>Design</strong>-Expert 7 User’s Guide