Mixture Design Tutorial (Part 2 â Optimization) - Statease.info
Mixture Design Tutorial (Part 2 â Optimization) - Statease.info
Mixture Design Tutorial (Part 2 â Optimization) - Statease.info

You also want an ePaper? Increase the reach of your titles
YUMPU automatically turns print PDFs into web optimized ePapers that Google loves.
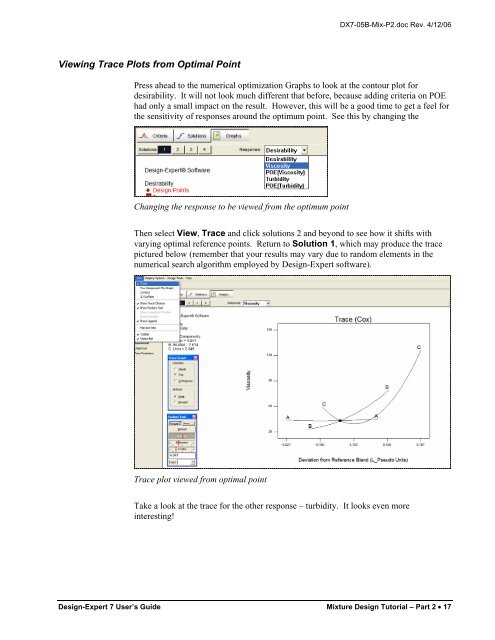
DX7-05B-Mix-P2.doc Rev. 4/12/06Viewing Trace Plots from Optimal PointPress ahead to the numerical optimization Graphs to look at the contour plot fordesirability. It will not look much different that before, because adding criteria on POEhad only a small impact on the result. However, this will be a good time to get a feel forthe sensitivity of responses around the optimum point. See this by changing theChanging the response to be viewed from the optimum pointThen select View, Trace and click solutions 2 and beyond to see how it shifts withvarying optimal reference points. Return to Solution 1, which may produce the tracepictured below (remember that your results may vary due to random elements in thenumerical search algorithm employed by <strong>Design</strong>-Expert software).Trace plot viewed from optimal pointTake a look at the trace for the other response – turbidity. It looks even moreinteresting!<strong>Design</strong>-Expert 7 User’s Guide <strong>Mixture</strong> <strong>Design</strong> <strong>Tutorial</strong> – <strong>Part</strong> 2 • 17