The tw<strong>in</strong>n<strong>in</strong>g <strong>and</strong> zipp<strong>in</strong>g policies adopted for Scottish <strong>and</strong> Welsh elections produced even morestrik<strong>in</strong>g results. Women won more than 37 per cent of the seats <strong>in</strong> the first Scottish Parliament <strong>in</strong>1999 – 41 per cent of all constituency seats <strong>and</strong> 32 per cent of all regional list seats (Squires 2004:10). Due to the tw<strong>in</strong>n<strong>in</strong>g policy, Scottish Labour elected 50 per cent women. Although the SNP didnot adopt any formal measures, women formed nearly one-third of all constituency c<strong>and</strong>idates <strong>and</strong>were placed at the upper end of all regional lists (Brown et al. 2002), elect<strong>in</strong>g 43 per cent women.Similar patterns emerged <strong>in</strong> Wales. Women won 40 per cent of the seats <strong>in</strong> the first NationalAssembly for Wales <strong>in</strong> 1999 – 48 per cent of all constituency seats <strong>and</strong> 25 per cent of all regionallist seats (Russell 2003: 73; Squires 2004: 11). The tw<strong>in</strong>n<strong>in</strong>g strategy used by Welsh Labour led tothe election of women to more than 57 per cent of the seats won by Labour <strong>in</strong> the new WelshAssembly. Plaid Cymru applied a zipp<strong>in</strong>g policy for the first three positions on the regional lists,start<strong>in</strong>g with a woman (Bradbury et al. 2000). However, the party did better than anticipated <strong>in</strong> theconstituency-based elections, result<strong>in</strong>g <strong>in</strong> the election of only 35 per cent women overall.Table 40. Women’s representation <strong>in</strong> the Scottish Parliament, 1999–2007Year Total Labour Conservative Lib. Dem. SNP1999 37.0% 50.0% 17.0% 12.0% 43.0%2003 39.0% 50.0% 22.2% 11.8% 25.7%2007 34.1% 50.0% 29.4% 12.5% 27.7%Sources: Russell, Meg, ‘Women <strong>in</strong> Elected Office <strong>in</strong> the UK, 1992–2002: Struggles, Achievements <strong>and</strong> PossibleSea Change’, <strong>in</strong> Alex<strong>and</strong>ra Dobrowolsky <strong>and</strong> Vivien Hart (eds), Women Mak<strong>in</strong>g Constitutions: New Politics <strong>and</strong>Comparative Perspectives (New York: Palgrave, 2003), p. 76; Scottish Parliament, ‘Female MSPs: Session 3’,Scottish Parliament Fact Sheet, 31 August 2007; Scottish Parliament, ‘List of Male MSPs: Session 3’, ScottishParliament Fact Sheet, 31 August 2007; Squires, Judith, ‘Gender Quotas <strong>in</strong> Brita<strong>in</strong>: A Fast Track to Equality?’,Stockholm University Work<strong>in</strong>g Paper 2004:1 (2004), p. 11.114
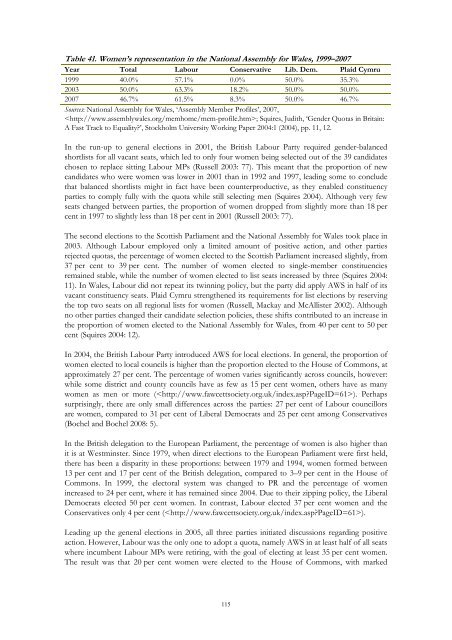
Table 41. Women’s representation <strong>in</strong> the National Assembly for Wales, 1999–2007Year Total Labour Conservative Lib. Dem. Plaid Cymru1999 40.0% 57.1% 0.0% 50.0% 35.3%2003 50.0% 63.3% 18.2% 50.0% 50.0%2007 46.7% 61.5% 8.3% 50.0% 46.7%Sources: National Assembly for Wales, ‘Assembly Member Profiles’, 2007,; Squires, Judith, ‘Gender Quotas <strong>in</strong> Brita<strong>in</strong>:A Fast Track to Equality?’, Stockholm University Work<strong>in</strong>g Paper 2004:1 (2004), pp. 11, 12.In the run-up to general elections <strong>in</strong> 2001, the British Labour Party required <strong>gender</strong>-balancedshortlists for all vacant seats, which led to only four women be<strong>in</strong>g selected out of the 39 c<strong>and</strong>idateschosen to replace sitt<strong>in</strong>g Labour MPs (Russell 2003: 77). This meant that the proportion of newc<strong>and</strong>idates who were women was lower <strong>in</strong> 2001 than <strong>in</strong> 1992 <strong>and</strong> 1997, lead<strong>in</strong>g some to concludethat balanced shortlists might <strong>in</strong> fact have been counterproductive, as they enabled constituencyparties to comply fully with the quota while still select<strong>in</strong>g men (Squires 2004). Although very fewseats changed between parties, the proportion of women dropped from slightly more than 18 percent <strong>in</strong> 1997 to slightly less than 18 per cent <strong>in</strong> 2001 (Russell 2003: 77).The second elections to the Scottish Parliament <strong>and</strong> the National Assembly for Wales took place <strong>in</strong>2003. Although Labour employed only a limited amount of positive action, <strong>and</strong> other partiesrejected <strong>quotas</strong>, the percentage of women elected to the Scottish Parliament <strong>in</strong>creased slightly, from37 per cent to 39 per cent. The number of women elected to s<strong>in</strong>gle-member constituenciesrema<strong>in</strong>ed stable, while the number of women elected to list seats <strong>in</strong>creased by three (Squires 2004:11). In Wales, Labour did not repeat its tw<strong>in</strong>n<strong>in</strong>g policy, but the party did apply AWS <strong>in</strong> half of itsvacant constituency seats. Plaid Cymru strengthened its requirements for list elections by reserv<strong>in</strong>gthe top two seats on all regional lists for women (Russell, Mackay <strong>and</strong> McAllister 2002). Althoughno other parties changed <strong>their</strong> c<strong>and</strong>idate selection policies, these shifts contributed to an <strong>in</strong>crease <strong>in</strong>the proportion of women elected to the National Assembly for Wales, from 40 per cent to 50 percent (Squires 2004: 12).In 2004, the British Labour Party <strong>in</strong>troduced AWS for local elections. In general, the proportion ofwomen elected to local councils is higher than the proportion elected to the House of Commons, atapproximately 27 per cent. The percentage of women varies significantly across councils, however:while some district <strong>and</strong> county councils have as few as 15 per cent women, others have as manywomen as men or more (). Perhapssurpris<strong>in</strong>gly, there are only small differences across the parties: 27 per cent of Labour councillorsare women, compared to 31 per cent of Liberal Democrats <strong>and</strong> 25 per cent among Conservatives(Bochel <strong>and</strong> Bochel 2008: 5).In the British delegation to the <strong>Europe</strong>an Parliament, the percentage of women is also higher thanit is at Westm<strong>in</strong>ster. S<strong>in</strong>ce 1979, when direct elections to the <strong>Europe</strong>an Parliament were first held,there has been a disparity <strong>in</strong> these proportions: between 1979 <strong>and</strong> 1994, women formed between13 per cent <strong>and</strong> 17 per cent of the British delegation, compared to 3–9 per cent <strong>in</strong> the House ofCommons. In 1999, the electoral system was changed to PR <strong>and</strong> the percentage of women<strong>in</strong>creased to 24 per cent, where it has rema<strong>in</strong>ed s<strong>in</strong>ce 2004. Due to <strong>their</strong> zipp<strong>in</strong>g policy, the LiberalDemocrats elected 50 per cent women. In contrast, Labour elected 37 per cent women <strong>and</strong> theConservatives only 4 per cent ().Lead<strong>in</strong>g up the general elections <strong>in</strong> 2005, all three parties <strong>in</strong>itiated discussions regard<strong>in</strong>g positiveaction. However, Labour was the only one to adopt a quota, namely AWS <strong>in</strong> at least half of all seatswhere <strong>in</strong>cumbent Labour MPs were retir<strong>in</strong>g, with the goal of elect<strong>in</strong>g at least 35 per cent women.The result was that 20 per cent women were elected to the House of Commons, with marked115
- Page 3 and 4:
Directorate-General Internal Polici
- Page 5 and 6:
Electoral Gender Quota Systems andT
- Page 8 and 9:
AppendicesThe methodology of the qu
- Page 10 and 11:
Table 41. Women’s representation
- Page 12 and 13:
1. Mapping of electoral gender quot
- Page 14 and 15:
Committee of Ministers’ Recommend
- Page 16 and 17:
have occurred after election day -
- Page 18 and 19:
parties and take the form of intern
- Page 20 and 21:
Knowledge of different electoral qu
- Page 22 and 23:
support for female candidates has s
- Page 24 and 25:
of more women in politics. Many opp
- Page 26 and 27:
Figure 3. The incremental track mod
- Page 28 and 29:
is probably that gender quotas rema
- Page 30 and 31:
to gender quotas. Likewise, the dat
- Page 32 and 33:
‘Special organisation for women w
- Page 34 and 35:
individual parties that adopt them,
- Page 36 and 37:
political party in the Swedish Parl
- Page 38 and 39:
then the requirement of 50 per cent
- Page 40 and 41:
proportion of women elected in the
- Page 42 and 43:
and organisation of women are cruci
- Page 44 and 45:
Matland, Richard E., ‘Enhancing W
- Page 46 and 47:
Case studyBelgium: a best practice
- Page 48 and 49:
While the 1994 act applied to all e
- Page 50 and 51:
need to include at least one woman,
- Page 52 and 53:
introduced, individual parties adop
- Page 54 and 55:
Marissal, Claudie and Hansen, Ingri
- Page 56 and 57:
In order to correct the discriminat
- Page 58 and 59:
The legal vacuum pertaining to the
- Page 60 and 61:
y women in terms of number of seats
- Page 62 and 63:
5. ‘Virtuous dynamic’: the symb
- Page 64 and 65:
Case studyGermany: successful quota
- Page 66 and 67:
party positions (Gruppenwahlen zu P
- Page 68 and 69: districts, quota rules are often no
- Page 70 and 71: Table 14. Success rates of female a
- Page 72 and 73: Figure 5. Development of the percen
- Page 74 and 75: so far no formal rules have been ad
- Page 76 and 77: Case studyPoland: one step forward,
- Page 78 and 79: 16 in Poland)Rady powiatów(second
- Page 80 and 81: 3. Evaluation3.1. Candidate lists i
- Page 82 and 83: List, in Ozorków Women of Tomorrow
- Page 84 and 85: 3.4. Representation of women in oth
- Page 86 and 87: Case studySlovenia: from voluntary
- Page 88 and 89: council. The positions of candidate
- Page 90 and 91: 3.2.2. The introduction of legislat
- Page 92 and 93: Table 25 shows that only one of the
- Page 94 and 95: Source: Author’s own calculation
- Page 96 and 97: Zakon o volitvah v Evropski parlame
- Page 98 and 99: Advocates for quotas for women lobb
- Page 100 and 101: Table 31. The percentage and number
- Page 102 and 103: Table 33. Municipality elections in
- Page 104 and 105: Case studySweden: small steps, big
- Page 106 and 107: 40 per cent of either sex on the pa
- Page 108 and 109: voluntary party quotas than in part
- Page 110 and 111: The zipper system (50 per cent) int
- Page 112 and 113: While quotas for minority groups ha
- Page 114 and 115: Case studyThe United Kingdom: polit
- Page 116 and 117: In contrast to Labour, the Scottish
- Page 120 and 121: differences across the political pa
- Page 122 and 123: Appendix IThe methodology of the qu
- Page 124 and 125: Brigitte Geissel is a political sci
- Page 126: ZLSDZZPUnited List of Social Democr