Short Lab Report Examples and Guide
Short Lab Report Examples and Guide
Short Lab Report Examples and Guide
- No tags were found...
You also want an ePaper? Increase the reach of your titles
YUMPU automatically turns print PDFs into web optimized ePapers that Google loves.
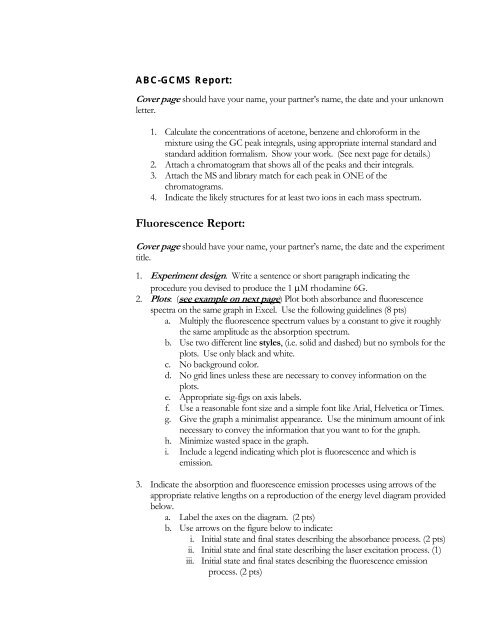
ABC-GCMS <strong>Report</strong>:Cover page should have your name, your partner’s name, the date <strong>and</strong> your unknownletter.1. Calculate the concentrations of acetone, benzene <strong>and</strong> chloroform in themixture using the GC peak integrals, using appropriate internal st<strong>and</strong>ard <strong>and</strong>st<strong>and</strong>ard addition formalism. Show your work. (See next page for details.)2. Attach a chromatogram that shows all of the peaks <strong>and</strong> their integrals.3. Attach the MS <strong>and</strong> library match for each peak in ONE of thechromatograms.4. Indicate the likely structures for at least two ions in each mass spectrum.Fluorescence <strong>Report</strong>:Cover page should have your name, your partner’s name, the date <strong>and</strong> the experimenttitle.1. Experiment design. Write a sentence or short paragraph indicating theprocedure you devised to produce the 1 μM rhodamine 6G.2. Plots: (see example on next page) Plot both absorbance <strong>and</strong> fluorescencespectra on the same graph in Excel. Use the following guidelines (8 pts)a. Multiply the fluorescence spectrum values by a constant to give it roughlythe same amplitude as the absorption spectrum.b. Use two different line styles, (i.e. solid <strong>and</strong> dashed) but no symbols for theplots. Use only black <strong>and</strong> white.c. No background color.d. No grid lines unless these are necessary to convey information on theplots.e. Appropriate sig-figs on axis labels.f. Use a reasonable font size <strong>and</strong> a simple font like Arial, Helvetica or Times.g. Give the graph a minimalist appearance. Use the minimum amount of inknecessary to convey the information that you want to for the graph.h. Minimize wasted space in the graph.i. Include a legend indicating which plot is fluorescence <strong>and</strong> which isemission.3. Indicate the absorption <strong>and</strong> fluorescence emission processes using arrows of theappropriate relative lengths on a reproduction of the energy level diagram providedbelow.a. <strong>Lab</strong>el the axes on the diagram. (2 pts)b. Use arrows on the figure below to indicate:i. Initial state <strong>and</strong> final states describing the absorbance process. (2 pts)ii. Initial state <strong>and</strong> final state describing the laser excitation process. (1)iii. Initial state <strong>and</strong> final states describing the fluorescence emissionprocess. (2 pts)


