survey of admissions directors - Inside Higher Ed
survey of admissions directors - Inside Higher Ed
survey of admissions directors - Inside Higher Ed

Create successful ePaper yourself
Turn your PDF publications into a flip-book with our unique Google optimized e-Paper software.
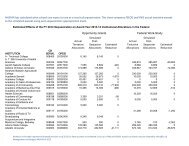
the 2011 inside higher ed <strong>survey</strong> <strong>of</strong> college & UNiversity <strong>admissions</strong> Directors: Data TablesPUBLIC PRIVATE nonpr<strong>of</strong>it Undergraduate SelectivityFour-Year Admit less Admit from Admit atColleges & Community than 20% <strong>of</strong> 20% to 50% least 50% <strong>of</strong>Universities Colleges Doctoral Master’s Bacc. Doctoral Master’s Bacc. applicants <strong>of</strong> applicants applicantsNumber <strong>of</strong> institutions 344 118 45 50 25 29 81 114 14 86 241As you think about the future, which <strong>of</strong> the following are the TWO most important <strong>admissions</strong> issues/challenges confronting your institution over the next two-three years?(Please select TWO items from the list below.)Increased competition from other institutions that are similar to your institution 22.1 8.5 24.4 28.0 24.0 31.0 14.8 21.1 28.6 26.7 19.9Increased competition from institutions in different sectors(public vs. private, two-year vs. four-year; for-pr<strong>of</strong>it vs. nonpr<strong>of</strong>it). 20.9 16.9 11.1 12.0 16.0 17.2 28.4 25.4 7.1 18.6 22.4Rising concerns from families about tuition and affordability 75.0 49.2 66.7 66.0 60.0 86.2 79.0 79.8 64.3 82.6 73.9Student/family concerns about student debt 17.7 5.1 4.4 6.0 12.0 24.1 24.7 22.8 0.0 22.1 17.0Debates over whether higher education produces graduates who can get jobs 4.9 16.1 4.4 4.0 4.0 6.9 2.5 7.0 21.4 4.7 4.1Increased commercialization <strong>of</strong> the <strong>admissions</strong> process 4.1 2.5 4.4 2.0 0.0 13.8 2.5 4.4 21.4 5.8 2.5Difficulty <strong>of</strong> attracting a diverse student body 3.2 2.5 2.2 2.0 4.0 6.9 6.2 0.9 14.3 3.5 2.5Reduced state funding that affects the quality and availability <strong>of</strong> academic programs 14.8 51.7 40.0 52.0 28.0 0.0 0.0 0.0 14.3 15.1 14.9Enrollment caps on undergraduate <strong>admissions</strong> 1.2 0.8 0.0 4.0 8.0 0.0 0.0 0.0 0.0 1.2 1.2Potential cuts in federal student aid programs (Pell Grants, etc.) 23.3 34.7 31.1 20.0 28.0 10.3 23.5 23.7 7.1 14.0 27.8Potential cuts in state student aid programs 8.1 7.6 8.9 4.0 8.0 3.4 11.1 8.8 14.3 3.5 8.7Potential cuts in the federal student loan program 4.7 1.7 2.2 0.0 8.0 0.0 7.4 6.1 7.1 2.3 5.0As you think about the various populations <strong>of</strong> undergraduates at your institution, have you focused more attention and increased your recruitment efforts to target some <strong>of</strong>the groups listed below in the last year than in prior recent years? Percent reporting more attention (score= 6/7; scale 1=less attention; 7=more attention)Full-time undergraduates 60.2 44.7 50.0 55.6 68.0 59.3 63.3 62.0 46.2 57.0 62.0Part-time undergraduates 33.5 27.8 34.5 21.1 17.4 52.4 19.7 46.9 54.5 47.8 26.8Home-schooled students 19.6 21.1 21.2 17.9 13.6 30.8 15.3 21.2 16.7 25.4 18.0International students 29.3 28.3 42.2 21.7 17.4 41.4 17.8 34.3 23.1 35.0 27.9Transfer students 36.1 27.7 27.9 40.0 45.8 27.6 42.3 33.3 23.1 28.8 38.5Minority students 30.4 31.8 34.9 32.0 37.5 38.5 19.7 31.8 28.6 34.6 29.4First-generation college students 17.8 42.5 10.5 17.4 37.5 20.0 14.7 17.8 14.3 21.5 16.9Out-<strong>of</strong>-state students 35.9 25.0 50.0 37.8 27.3 57.1 30.3 29.6 25.0 42.0 34.4Full-pay students 34.2 32.3 51.3 41.9 38.1 28.0 24.3 32.4 9.1 48.0 31.2Adult students (over age 24) 32.4 41.1 14.7 19.5 17.4 40.0 24.3 53.3 54.5 42.9 28.5Veterans/military personnel 24.1 33.9 19.5 18.8 29.2 20.0 23.4 28.7 28.6 23.7 24.23. How important are the following strategies for the undergraduate <strong>admissions</strong> efforts (and enrollment targets) at your institution over the next two-three years?Percent reporting very important (score= 6/7; scale 1=not important; 7=very important)Recruiting more “local” students (students who live closer to the college) 25.2 62.6 18.9 31.7 41.7 4.2 23.1 27.5 30.0 19.7 27.0Recruiting more out-<strong>of</strong>-state students (domestic) 37.6 26.3 53.3 47.9 26.1 25.9 34.2 34.5 9.1 28.9 42.4Recruiting more international students 30.3 21.2 42.2 31.9 18.2 42.9 21.8 29.9 33.3 32.1 29.7Recruiting more “full-pay” students 31.7 34.4 46.5 44.7 25.0 11.1 20.8 34.3 0.0 33.3 32.9Using social media (Facebook, Twitter, etc.) as part <strong>of</strong> ourcommunication strategy with applicants 30.2 38.3 22.0 38.8 26.1 24.1 34.2 29.1 28.6 33.3 28.8Using merit scholarships to enhance the academic pr<strong>of</strong>ile <strong>of</strong> our student population 28.3 24.5 19.0 31.9 21.7 28.0 28.8 31.4 27.3 32.1 27.0Maintaining close relationships and communications withhigh school guidance counselors 35.6 63.6 35.7 37.5 64.0 34.5 26.9 34.8 38.5 33.3 36.3Maintaining close relationships and communications withindependent/private college counselors 17.6 24.2 8.1 18.2 22.7 16.7 17.3 20.2 10.0 18.2 17.6Enhancing our standing in the US News ratings and similar college guides 13.3 n/a 7.7 22.0 14.3 15.4 10.4 12.9 30.0 15.3 11.3Providing adequate student aid for low- and middle-income students 36.2 66.4 39.5 38.8 28.0 48.3 26.3 39.6 42.9 45.2 32.62011 SURVEY OF COLLEGE AND UNIVERSITY ADMISSIONS DIRECTORS INSIDE HIGHER ED17