survey of admissions directors - Inside Higher Ed
survey of admissions directors - Inside Higher Ed
survey of admissions directors - Inside Higher Ed

Create successful ePaper yourself
Turn your PDF publications into a flip-book with our unique Google optimized e-Paper software.
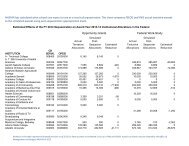
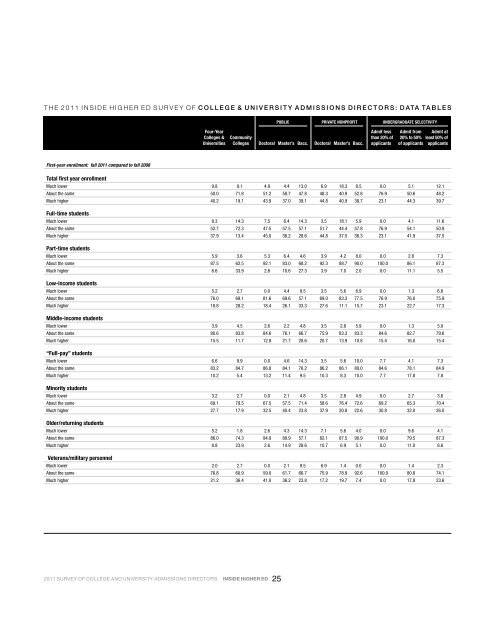
the 2011 inside higher ed <strong>survey</strong> <strong>of</strong> college & UNiversity <strong>admissions</strong> Directors: Data TablesALL INSTITUTIONS BY SECTOR PUBLIC PRIVATE nonpr<strong>of</strong>it Undergraduate SelectivityFour-Year Admit less Admit from Admit atColleges & Community than 20% <strong>of</strong> 20% to 50% least 50% <strong>of</strong>Universities Colleges Doctoral Master’s Bacc. Doctoral Master’s Bacc. applicants <strong>of</strong> applicants applicantsFirst-year enrollment: fall 2011 compared to fall 2008Total first year enrollmentMuch lower 9.8 9.1 4.9 4.4 13.0 6.9 18.3 8.5 0.0 5.1 12.1About the same 50.0 71.8 51.2 58.7 47.8 48.3 40.9 52.8 76.9 50.6 48.2Much higher 40.2 19.1 43.9 37.0 39.1 44.8 40.9 38.7 23.1 44.3 39.7Full-time studentsMuch lower 9.3 14.3 7.5 6.4 14.3 3.5 18.1 5.9 0.0 4.1 11.6About the same 52.7 72.3 47.5 57.5 57.1 51.7 44.4 57.8 76.9 54.1 50.9Much higher 37.9 13.4 45.0 36.2 28.6 44.8 37.5 36.3 23.1 41.9 37.5Part-time studentsMuch lower 5.9 3.6 5.3 6.4 4.6 3.9 4.2 8.0 0.0 2.8 7.3About the same 87.5 62.5 92.1 83.0 68.2 92.3 88.7 90.0 100.0 86.1 87.3Much higher 6.6 33.9 2.6 10.6 27.3 3.9 7.0 2.0 0.0 11.1 5.5Low-income studentsMuch lower 5.2 2.7 0.0 4.4 9.5 3.5 5.6 6.9 0.0 1.3 6.8About the same 76.0 69.1 81.6 69.6 57.1 69.0 83.3 77.5 76.9 76.0 75.9Much higher 18.8 28.2 18.4 26.1 33.3 27.6 11.1 15.7 23.1 22.7 17.3Middle-income studentsMuch lower 3.9 4.5 2.6 2.2 4.8 3.5 2.8 5.9 0.0 1.3 5.0About the same 80.6 83.8 84.6 76.1 66.7 75.9 83.3 83.3 84.6 82.7 79.6Much higher 15.5 11.7 12.8 21.7 28.6 20.7 13.9 10.8 15.4 16.0 15.4“Full-pay” studentsMuch lower 6.6 9.9 0.0 4.6 14.3 3.5 5.6 10.0 7.7 4.1 7.3About the same 83.2 84.7 86.8 84.1 76.2 86.2 86.1 80.0 84.6 78.1 84.9Much higher 10.2 5.4 13.2 11.4 9.5 10.3 8.3 10.0 7.7 17.8 7.8Minority studentsMuch lower 3.2 2.7 0.0 2.1 4.8 3.5 2.8 4.9 0.0 2.7 3.6About the same 69.1 79.5 67.5 57.5 71.4 58.6 76.4 72.6 69.2 65.3 70.4Much higher 27.7 17.9 32.5 40.4 23.8 37.9 20.8 22.6 30.8 32.0 26.0Older/returning studentsMuch lower 5.2 1.8 2.6 4.3 14.3 7.1 5.6 4.0 0.0 9.6 4.1About the same 86.0 74.3 94.9 80.9 57.1 82.1 87.5 90.9 100.0 79.5 87.3Much higher 8.8 23.9 2.6 14.9 28.6 10.7 6.9 5.1 0.0 11.0 8.6Veterans/military personnelMuch lower 2.0 2.7 0.0 2.1 9.5 6.9 1.4 0.0 0.0 1.4 2.3About the same 76.8 60.9 59.0 61.7 66.7 75.9 78.9 92.6 100.0 80.8 74.1Much higher 21.2 36.4 41.0 36.2 23.8 17.2 19.7 7.4 0.0 17.8 23.62011 SURVEY OF COLLEGE AND UNIVERSITY ADMISSIONS DIRECTORS INSIDE HIGHER ED25