survey of admissions directors - Inside Higher Ed
survey of admissions directors - Inside Higher Ed
survey of admissions directors - Inside Higher Ed

You also want an ePaper? Increase the reach of your titles
YUMPU automatically turns print PDFs into web optimized ePapers that Google loves.
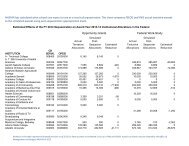
the 2011 inside higher ed <strong>survey</strong> <strong>of</strong> college & UNiversity <strong>admissions</strong> Directors: Data TablesPUBLIC PRIVATE nonpr<strong>of</strong>it Undergraduate SelectivityFour-Year Admit less Admit from Admit atColleges & Community than 20% <strong>of</strong> 20% to 50% least 50% <strong>of</strong>Universities Colleges Doctoral Master’s Bacc. Doctoral Master’s Bacc. applicants <strong>of</strong> applicants applicantsMen (for gender balance)Strongly disagree 1.2 n/a 0.0 0.0 0.0 0.0 0.0 3.7 0.0 0.0 1.7Disagree 8.1 n/a 0.0 7.7 14.3 28.6 5.0 7.4 0.0 16.7 5.1Agree 61.6 n/a 50.0 76.9 57.1 57.1 75.0 51.9 33.3 58.3 64.4Strongly agree 29.1 n/a 50.0 15.4 28.6 14.3 20.0 37.0 66.7 25.0 28.8Women (for gender balance)Strongly disagree 1.3 n/a 0.0 0.0 0.0 0.0 0.0 5.0 0.0 0.0 1.9Disagree 6.7 n/a 0.0 8.3 20.0 14.3 5.3 5.0 0.0 15.0 3.9Agree 62.7 n/a 50.0 66.7 40.0 85.7 73.7 55.0 33.3 70.0 61.5Strongly agree 29.3 n/a 50.0 25.0 40.0 0.0 21.1 35.0 66.7 15.0 32.7Full-pay studentsStrongly disagree 3.5 n/a 0.0 9.1 0.0 0.0 5.3 2.9 0.0 11.5 0.0Disagree 4.6 n/a 9.1 9.1 0.0 12.5 0.0 2.9 0.0 3.9 5.2Agree 62.1 n/a 54.6 54.6 50.0 87.5 68.4 58.8 33.3 73.1 58.6Strongly agree 29.9 n/a 36.4 27.3 50.0 0.0 26.3 35.3 66.7 11.5 36.2International studentsStrongly disagree 3.5 n/a 0.0 7.1 20.0 0.0 5.3 0.0 0.0 4.8 3.3Disagree 5.9 n/a 0.0 14.3 0.0 11.1 0.0 7.7 0.0 9.5 5.0Agree 64.7 n/a 50.0 57.1 60.0 88.9 73.7 61.5 50.0 71.4 63.3Strongly agree 25.9 n/a 50.0 21.4 20.0 0.0 21.1 30.8 50.0 14.3 28.3VeteransStrongly disagree 0.0 n/a 0.0 0.0 0.0 0.0 0.0 0.0 0.0 0.0 0.0Disagree 3.1 n/a 0.0 0.0 20.0 10.0 0.0 4.2 16.7 8.3 0.0Agree 68.8 n/a 53.3 75.0 60.0 90.0 72.7 62.5 50.0 66.7 71.2Strongly agree 28.1 n/a 46.7 25.0 20.0 0.0 27.3 33.3 33.3 25.0 28.8Do Asian-American applicants at your institution need significantly higher grades and test scores to gain admission than other applicants?Percent reporting yes 0.9 n/a 0.0 0.0 0.0 0.0 0.0 2.6 0.0 0.0 1.3Many campuses are reviewing the use <strong>of</strong> standardized tests in the <strong>admissions</strong> process. Is your institution giving thought to making standardized tests (ACT/SAT) optional inundergraduate <strong>admissions</strong>?No, we continue to require standardized tests from undergraduate applicants. 71.7 n/a 93.3 82.0 62.5 72.4 64.2 65.8 85.7 73.3 70.0We continue to require standardized tests but are also currently reviewing this policy. 16.6 6.7 16.0 12.5 17.2 27.2 14.0 7.1 18.6 16.7We no longer require standardized tests as part <strong>of</strong> the undergrad <strong>admissions</strong> application. 11.7 0.0 2.0 25.0 10.3 8.6 20.2 7.1 8.1 13.3Please indicate the degree to which you agree or disagree with the following statements:We have expanded the use <strong>of</strong> non-traditional <strong>admissions</strong> criteria as part <strong>of</strong> our review process in the past five years.Strongly disagree 15.5 n/a 15.6 14.0 20.0 10.3 16.1 15.9 21.4 11.8 16.6Disagree 44.6 42.2 36.0 52.0 48.3 45.7 46.0 42.9 49.4 43.2Agree 32.7 35.6 42.0 28.0 24.1 33.3 30.1 28.6 29.4 33.6Strongly agree 7.3 6.7 8.0 0.0 17.2 4.9 8.0 7.1 9.4 6.6We have reduced the role <strong>of</strong> standardized tests in undergraduate <strong>admissions</strong> reviews and decisions in the past five years.Strongly disagree 23.7 n/a 20.0 30.0 29.2 27.6 21.0 22.1 28.6 27.1 22.5Disagree 48.5 57.8 54.0 45.8 44.8 45.7 46.0 50.0 47.1 48.3Agree 18.7 20.0 10.0 16.7 6.9 25.9 20.4 14.3 14.1 20.8Strongly agree 9.1 2.2 6.0 8.3 20.7 7.4 11.5 7.1 11.8 8.32011 SURVEY OF COLLEGE AND UNIVERSITY ADMISSIONS DIRECTORS INSIDE HIGHER ED19