survey of admissions directors - Inside Higher Ed
survey of admissions directors - Inside Higher Ed
survey of admissions directors - Inside Higher Ed

You also want an ePaper? Increase the reach of your titles
YUMPU automatically turns print PDFs into web optimized ePapers that Google loves.
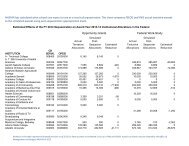
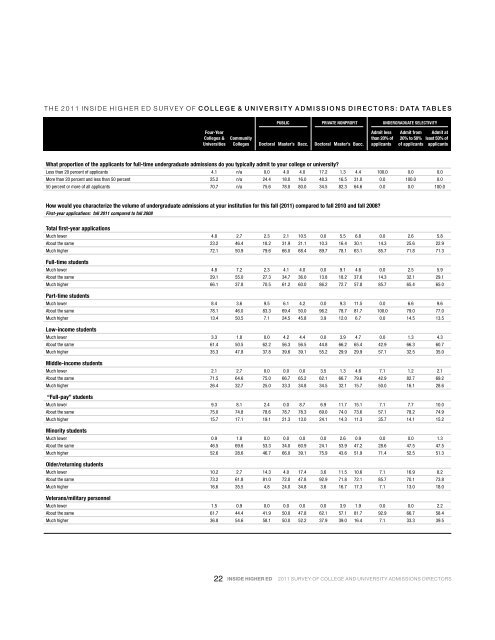
the 2011 inside higher ed <strong>survey</strong> <strong>of</strong> college & UNiversity <strong>admissions</strong> Directors: Data TablesALL INSTITUTIONS BY SECTOR PUBLIC PRIVATE nonpr<strong>of</strong>it Undergraduate SelectivityFour-Year Admit less Admit from Admit atColleges & Community than 20% <strong>of</strong> 20% to 50% least 50% <strong>of</strong>Universities Colleges Doctoral Master’s Bacc. Doctoral Master’s Bacc. applicants <strong>of</strong> applicants applicantsWhat proportion <strong>of</strong> the applicants for full-time undergraduate <strong>admissions</strong> do you typically admit to your college or university?Less than 20 percent <strong>of</strong> applicants 4.1 n/a 0.0 4.0 4.0 17.2 1.3 4.4 100.0 0.0 0.0More than 20 percent and less than 50 percent 25.2 n/a 24.4 18.0 16.0 48.3 16.5 31.0 0.0 100.0 0.050 percent or more <strong>of</strong> all applicants 70.7 n/a 75.6 78.0 80.0 34.5 82.3 64.6 0.0 0.0 100.0How would you characterize the volume <strong>of</strong> undergraduate <strong>admissions</strong> at your institution for this fall (2011) compared to fall 2010 and fall 2008?First-year applications: fall 2011 compared to fall 2008Total first-year applicationsMuch lower 4.8 2.7 2.3 2.1 10.5 0.0 5.5 6.8 0.0 2.6 5.8About the same 23.2 46.4 18.2 31.9 21.1 10.3 16.4 30.1 14.3 25.6 22.9Much higher 72.1 50.9 79.6 66.0 68.4 89.7 78.1 63.1 85.7 71.8 71.3Full-time studentsMuch lower 4.8 7.2 2.3 4.1 4.0 0.0 9.1 4.6 0.0 2.5 5.9About the same 29.1 55.0 27.3 34.7 36.0 13.8 18.2 37.6 14.3 32.1 29.1Much higher 66.1 37.8 70.5 61.2 60.0 86.2 72.7 57.8 85.7 65.4 65.0Part-time studentsMuch lower 8.4 3.6 9.5 6.1 4.2 0.0 9.3 11.5 0.0 6.6 9.6About the same 78.1 46.0 83.3 69.4 50.0 96.2 78.7 81.7 100.0 79.0 77.0Much higher 13.4 50.5 7.1 24.5 45.8 3.9 12.0 6.7 0.0 14.5 13.5Low-income studentsMuch lower 3.3 1.8 0.0 4.2 4.4 0.0 3.9 4.7 0.0 1.3 4.3About the same 61.4 50.5 62.2 56.3 56.5 44.8 66.2 65.4 42.9 66.3 60.7Much higher 35.3 47.8 37.8 39.6 39.1 55.2 29.9 29.9 57.1 32.5 35.0Middle-income studentsMuch lower 2.1 2.7 0.0 0.0 0.0 3.5 1.3 4.6 7.1 1.2 2.1About the same 71.5 64.6 75.0 66.7 65.2 62.1 66.7 79.6 42.9 82.7 69.2Much higher 26.4 32.7 25.0 33.3 34.8 34.5 32.1 15.7 50.0 16.1 28.6“Full-pay” studentsMuch lower 9.3 8.1 2.4 0.0 8.7 6.9 11.7 15.1 7.1 7.7 10.0About the same 75.0 74.8 78.6 78.7 78.3 69.0 74.0 73.6 57.1 78.2 74.9Much higher 15.7 17.1 19.1 21.3 13.0 24.1 14.3 11.3 35.7 14.1 15.2Minority studentsMuch lower 0.9 1.8 0.0 0.0 0.0 0.0 2.6 0.9 0.0 0.0 1.3About the same 46.5 69.6 53.3 34.0 60.9 24.1 53.9 47.2 28.6 47.5 47.5Much higher 52.6 28.6 46.7 66.0 39.1 75.9 43.6 51.9 71.4 52.5 51.3Older/returning studentsMuch lower 10.2 2.7 14.3 4.0 17.4 3.6 11.5 10.6 7.1 16.9 8.2About the same 73.2 61.8 81.0 72.0 47.8 92.9 71.8 72.1 85.7 70.1 73.8Much higher 16.6 35.5 4.8 24.0 34.8 3.6 16.7 17.3 7.1 13.0 18.0Veterans/military personnelMuch lower 1.5 0.9 0.0 0.0 0.0 0.0 3.9 1.9 0.0 0.0 2.2About the same 61.7 44.4 41.9 50.0 47.8 62.1 57.1 81.7 92.9 66.7 58.4Much higher 36.8 54.6 58.1 50.0 52.2 37.9 39.0 16.4 7.1 33.3 39.522 INSIDE HIGHER ED 2011 SURVEY OF COLLEGE AND UNIVERSITY ADMISSIONS DIRECTORS