No. 3 - Department of Treasury - The Western Australian Government
No. 3 - Department of Treasury - The Western Australian Government
No. 3 - Department of Treasury - The Western Australian Government

Create successful ePaper yourself
Turn your PDF publications into a flip-book with our unique Google optimized e-Paper software.
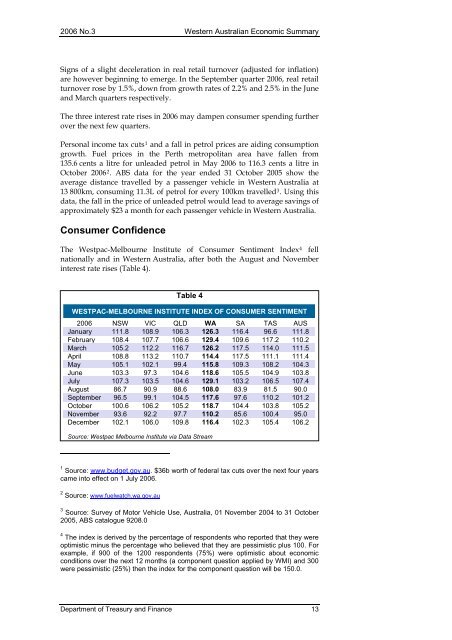
2006 <strong>No</strong>.3 <strong>Western</strong> <strong>Australian</strong> Economic SummarySigns <strong>of</strong> a slight deceleration in real retail turnover (adjusted for inflation)are however beginning to emerge. In the September quarter 2006, real retailturnover rose by 1.5%, down from growth rates <strong>of</strong> 2.2% and 2.5% in the Juneand March quarters respectively.<strong>The</strong> three interest rate rises in 2006 may dampen consumer spending furtherover the next few quarters.Personal income tax cuts 1 and a fall in petrol prices are aiding consumptiongrowth. Fuel prices in the Perth metropolitan area have fallen from135.6 cents a litre for unleaded petrol in May 2006 to 116.3 cents a litre inOctober 2006 2 . ABS data for the year ended 31 October 2005 show theaverage distance travelled by a passenger vehicle in <strong>Western</strong> Australia at13 800km, consuming 11.3L <strong>of</strong> petrol for every 100km travelled 3 . Using thisdata, the fall in the price <strong>of</strong> unleaded petrol would lead to average savings <strong>of</strong>approximately $23 a month for each passenger vehicle in <strong>Western</strong> Australia.Consumer Confidence<strong>The</strong> Westpac-Melbourne Institute <strong>of</strong> Consumer Sentiment Index 4 fellnationally and in <strong>Western</strong> Australia, after both the August and <strong>No</strong>vemberinterest rate rises (Table 4).Table 4WESTPAC-MELBOURNE INSTITUTE INDEX OF CONSUMER SENTIMENT2006 NSW VIC QLD WA SA TAS AUSJanuary 111.8 108.9 106.3 126.3 116.4 96.6 111.8February 108.4 107.7 106.6 129.4 109.6 117.2 110.2March 105.2 112.2 116.7 126.2 117.5 114.0 111.5April 108.8 113.2 110.7 114.4 117.5 111.1 111.4May 105.1 102.1 99.4 115.8 109.3 108.2 104.3June 103.3 97.3 104.6 118.6 105.5 104.9 103.8July 107.3 103.5 104.6 129.1 103.2 106.5 107.4August 86.7 90.9 88.6 108.0 83.9 81.5 90.0September 96.5 99.1 104.5 117.6 97.6 110.2 101.2October 100.6 106.2 105.2 118.7 104.4 103.8 105.2<strong>No</strong>vember 93.6 92.2 97.7 110.2 85.6 100.4 95.0December 102.1 106.0 109.8 116.4 102.3 105.4 106.2Source: Westpac Melbourne Institute via Data Stream1 Source: www.budget.gov.au. $36b worth <strong>of</strong> federal tax cuts over the next four yearscame into effect on 1 July 2006.2 Source: www.fuelwatch.wa.gov.au3 Source: Survey <strong>of</strong> Motor Vehicle Use, Australia, 01 <strong>No</strong>vember 2004 to 31 October2005, ABS catalogue 9208.04 <strong>The</strong> index is derived by the percentage <strong>of</strong> respondents who reported that they wereoptimistic minus the percentage who believed that they are pessimistic plus 100. Forexample, if 900 <strong>of</strong> the 1200 respondents (75%) were optimistic about economicconditions over the next 12 months (a component question applied by WMI) and 300were pessimistic (25%) then the index for the component question will be 150.0.<strong>Department</strong> <strong>of</strong> <strong>Treasury</strong> and Finance 13