No. 3 - Department of Treasury - The Western Australian Government
No. 3 - Department of Treasury - The Western Australian Government
No. 3 - Department of Treasury - The Western Australian Government

Create successful ePaper yourself
Turn your PDF publications into a flip-book with our unique Google optimized e-Paper software.
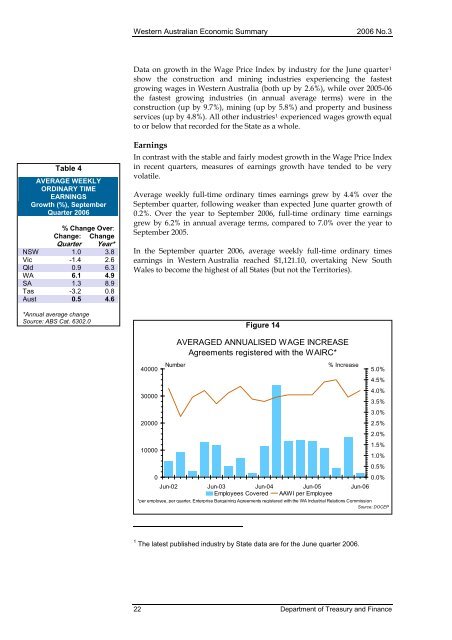
<strong>Western</strong> <strong>Australian</strong> Economic Summary2006 <strong>No</strong>.3Data on growth in the Wage Price Index by industry for the June quarter 1show the construction and mining industries experiencing the fastestgrowing wages in <strong>Western</strong> Australia (both up by 2.6%), while over 2005-06the fastest growing industries (in annual average terms) were in theconstruction (up by 9.7%), mining (up by 5.8%) and property and businessservices (up by 4.8%). All other industries 1 experienced wages growth equalto or below that recorded for the State as a whole.Table 4AVERAGE WEEKLYORDINARY TIMEEARNINGSGrowth (%), SeptemberQuarter 2006% Change Over:Change: ChangeQuarter Year*NSW 1.0 3.8Vic -1.4 2.6Qld 0.9 6.3WA 6.1 4.9SA 1.3 8.9Tas -3.2 0.8Aust 0.5 4.6*Annual average changeSource: ABS Cat. 6302.0EarningsIn contrast with the stable and fairly modest growth in the Wage Price Indexin recent quarters, measures <strong>of</strong> earnings growth have tended to be veryvolatile.Average weekly full-time ordinary times earnings grew by 4.4% over theSeptember quarter, following weaker than expected June quarter growth <strong>of</strong>0.2%. Over the year to September 2006, full-time ordinary time earningsgrew by 6.2% in annual average terms, compared to 7.0% over the year toSeptember 2005.In the September quarter 2006, average weekly full-time ordinary timesearnings in <strong>Western</strong> Australia reached $1,121.10, overtaking New SouthWales to become the highest <strong>of</strong> all States (but not the Territories).Figure 14400003000020000100000NumberAVERAGED ANNUALISED WAGE INCREASEAgreements registered with the WAIRC*% IncreaseJun-02 Jun-03 Jun-04 Jun-05 Jun-06Employees Covered AAWI per Employee*per employee, per quarter, Enterprise Bargaining Agreements registered with the WA Industrial Relations Commission5.0%4.5%4.0%3.5%3.0%2.5%2.0%1.5%1.0%0.5%0.0%Source: DOCEP1 <strong>The</strong> latest published industry by State data are for the June quarter 2006.22 <strong>Department</strong> <strong>of</strong> <strong>Treasury</strong> and Finance