No. 3 - Department of Treasury - The Western Australian Government
No. 3 - Department of Treasury - The Western Australian Government
No. 3 - Department of Treasury - The Western Australian Government

Create successful ePaper yourself
Turn your PDF publications into a flip-book with our unique Google optimized e-Paper software.
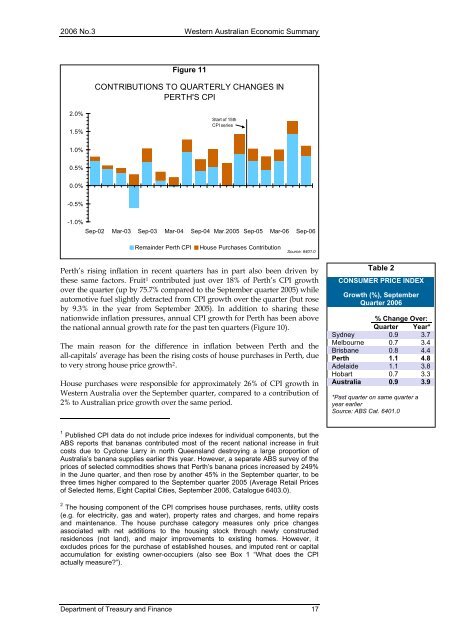
2006 <strong>No</strong>.3 <strong>Western</strong> <strong>Australian</strong> Economic SummaryFigure 11CONTRIBUTIONS TO QUARTERLY CHANGES INPERTH'S CPI2.0%1.5%Start <strong>of</strong> 15thCPI series1.0%0.5%0.0%-0.5%-1.0%Sep-02 Mar-03 Sep-03 Mar-04 Sep-04 Mar.2005 Sep-05 Mar-06 Sep-06Remainder Perth CPIHouse Purchases ContributionSource: 6401.0Perth’s rising inflation in recent quarters has in part also been driven bythese same factors. Fruit 1 contributed just over 18% <strong>of</strong> Perth’s CPI growthover the quarter (up by 75.7% compared to the September quarter 2005) whileautomotive fuel slightly detracted from CPI growth over the quarter (but roseby 9.3% in the year from September 2005). In addition to sharing thesenationwide inflation pressures, annual CPI growth for Perth has been abovethe national annual growth rate for the past ten quarters (Figure 10).<strong>The</strong> main reason for the difference in inflation between Perth and theall-capitals’ average has been the rising costs <strong>of</strong> house purchases in Perth, dueto very strong house price growth 2 .House purchases were responsible for approximately 26% <strong>of</strong> CPI growth in<strong>Western</strong> Australia over the September quarter, compared to a contribution <strong>of</strong>2% to <strong>Australian</strong> price growth over the same period.Table 2CONSUMER PRICE INDEXGrowth (%), SeptemberQuarter 2006% Change Over:Quarter Year*Sydney 0.9 3.7Melbourne 0.7 3.4Brisbane 0.8 4.4Perth 1.1 4.8Adelaide 1.1 3.8Hobart 0.7 3.3Australia 0.9 3.9*Past quarter on same quarter ayear earlierSource: ABS Cat. 6401.01 Published CPI data do not include price indexes for individual components, but theABS reports that bananas contributed most <strong>of</strong> the recent national increase in fruitcosts due to Cyclone Larry in north Queensland destroying a large proportion <strong>of</strong>Australia’s banana supplies earlier this year. However, a separate ABS survey <strong>of</strong> theprices <strong>of</strong> selected commodities shows that Perth’s banana prices increased by 249%in the June quarter, and then rose by another 45% in the September quarter, to bethree times higher compared to the September quarter 2005 (Average Retail Prices<strong>of</strong> Selected Items, Eight Capital Cities, September 2006, Catalogue 6403.0).2 <strong>The</strong> housing component <strong>of</strong> the CPI comprises house purchases, rents, utility costs(e.g. for electricity, gas and water), property rates and charges, and home repairsand maintenance. <strong>The</strong> house purchase category measures only price changesassociated with net additions to the housing stock through newly constructedresidences (not land), and major improvements to existing homes. However, itexcludes prices for the purchase <strong>of</strong> established houses, and imputed rent or capitalaccumulation for existing owner-occupiers (also see Box 1 “What does the CPIactually measure?”).<strong>Department</strong> <strong>of</strong> <strong>Treasury</strong> and Finance 17