No. 3 - Department of Treasury - The Western Australian Government
No. 3 - Department of Treasury - The Western Australian Government
No. 3 - Department of Treasury - The Western Australian Government

You also want an ePaper? Increase the reach of your titles
YUMPU automatically turns print PDFs into web optimized ePapers that Google loves.
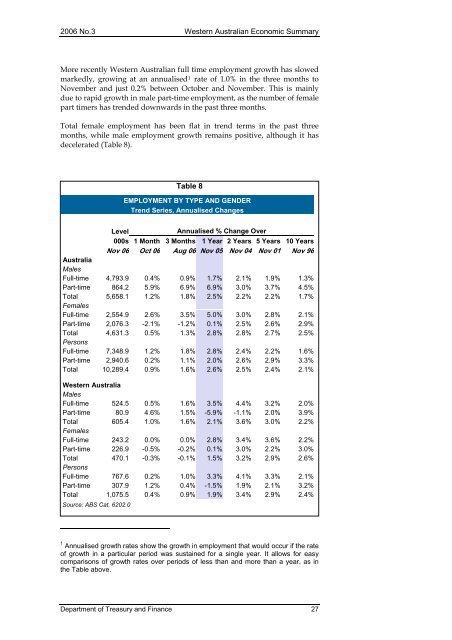
2006 <strong>No</strong>.3 <strong>Western</strong> <strong>Australian</strong> Economic SummaryMore recently <strong>Western</strong> <strong>Australian</strong> full time employment growth has slowedmarkedly, growing at an annualised 1 rate <strong>of</strong> 1.0% in the three months to<strong>No</strong>vember and just 0.2% between October and <strong>No</strong>vember. This is mainlydue to rapid growth in male part-time employment, as the number <strong>of</strong> femalepart timers has trended downwards in the past three months.Total female employment has been flat in trend terms in the past threemonths, while male employment growth remains positive, although it hasdecelerated (Table 8).Table 8EMPLOYMENT BY TYPE AND GENDERTrend Series, Annualised ChangesLevelAnnualised % Change Over000s 1 Month 3 Months 1 Year 2 Years 5 Years 10 Years<strong>No</strong>v 06 Oct 06 Aug 06 <strong>No</strong>v 05 <strong>No</strong>v 04 <strong>No</strong>v 01 <strong>No</strong>v 96AustraliaMalesFull-time 4,793.9 0.4% 0.9% 1.7% 2.1% 1.9% 1.3%Part-time 864.2 5.9% 6.9% 6.9% 3.0% 3.7% 4.5%Total 5,658.1 1.2% 1.8% 2.5% 2.2% 2.2% 1.7%FemalesFull-time 2,554.9 2.6% 3.5% 5.0% 3.0% 2.8% 2.1%Part-time 2,076.3 -2.1% -1.2% 0.1% 2.5% 2.6% 2.9%Total 4,631.3 0.5% 1.3% 2.8% 2.8% 2.7% 2.5%PersonsFull-time 7,348.9 1.2% 1.8% 2.8% 2.4% 2.2% 1.6%Part-time 2,940.6 0.2% 1.1% 2.0% 2.6% 2.9% 3.3%Total 10,289.4 0.9% 1.6% 2.6% 2.5% 2.4% 2.1%<strong>Western</strong> AustraliaMalesFull-time 524.5 0.5% 1.6% 3.5% 4.4% 3.2% 2.0%Part-time 80.9 4.6% 1.5% -5.9% -1.1% 2.0% 3.9%Total 605.4 1.0% 1.6% 2.1% 3.6% 3.0% 2.2%FemalesFull-time 243.2 0.0% 0.0% 2.8% 3.4% 3.6% 2.2%Part-time 226.9 -0.5% -0.2% 0.1% 3.0% 2.2% 3.0%Total 470.1 -0.3% -0.1% 1.5% 3.2% 2.9% 2.6%PersonsFull-time 767.6 0.2% 1.0% 3.3% 4.1% 3.3% 2.1%Part-time 307.9 1.2% 0.4% -1.5% 1.9% 2.1% 3.2%Total 1,075.5 0.4% 0.9% 1.9% 3.4% 2.9% 2.4%Source: ABS Cat. 6202.01 Annualised growth rates show the growth in employment that would occur if the rate<strong>of</strong> growth in a particular period was sustained for a single year. It allows for easycomparisons <strong>of</strong> growth rates over periods <strong>of</strong> less than and more than a year, as inthe Table above.<strong>Department</strong> <strong>of</strong> <strong>Treasury</strong> and Finance 27