2011 Report - Fortress Mutual Fund Ltd
2011 Report - Fortress Mutual Fund Ltd
2011 Report - Fortress Mutual Fund Ltd

Create successful ePaper yourself
Turn your PDF publications into a flip-book with our unique Google optimized e-Paper software.
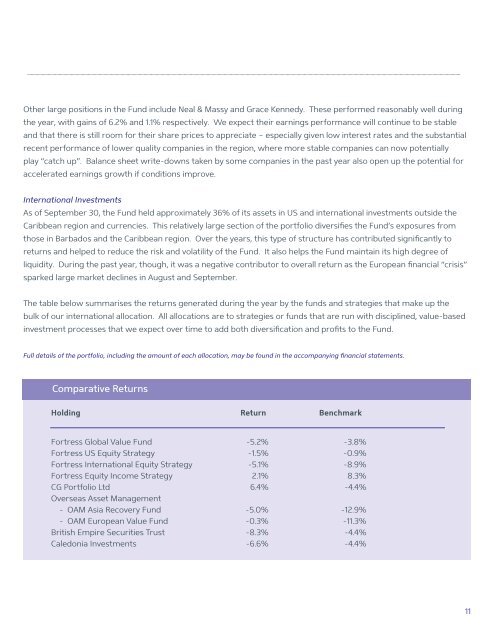
Other large positions in the <strong>Fund</strong> include Neal & Massy and Grace Kennedy. These performed reasonably well duringthe year, with gains of 6.2% and 1.1% respectively. We expect their earnings performance will continue to be stableand that there is still room for their share prices to appreciate – especially given low interest rates and the substantialrecent performance of lower quality companies in the region, where more stable companies can now potentiallyplay “catch up”. Balance sheet write-downs taken by some companies in the past year also open up the potential foraccelerated earnings growth if conditions improve.International InvestmentsAs of September 30, the <strong>Fund</strong> held approximately 36% of its assets in US and international investments outside theCaribbean region and currencies. This relatively large section of the portfolio diversifies the <strong>Fund</strong>’s exposures fromthose in Barbados and the Caribbean region. Over the years, this type of structure has contributed significantly toreturns and helped to reduce the risk and volatility of the <strong>Fund</strong>. It also helps the <strong>Fund</strong> maintain its high degree ofliquidity. During the past year, though, it was a negative contributor to overall return as the European financial “crisis”sparked large market declines in August and September.The table below summarises the returns generated during the year by the funds and strategies that make up thebulk of our international allocation. All allocations are to strategies or funds that are run with disciplined, value-basedinvestment processes that we expect over time to add both diversification and profits to the <strong>Fund</strong>.Full details of the portfolio, including the amount of each allocation, may be found in the accompanying financial statements.Comparative ReturnsHolding Return Benchmark<strong>Fortress</strong> Global Value <strong>Fund</strong> -5.2% -3.8%<strong>Fortress</strong> US Equity Strategy -1.5% -0.9%<strong>Fortress</strong> International Equity Strategy -5.1% -8.9%<strong>Fortress</strong> Equity Income Strategy 2.1% 8.3%CG Portfolio <strong>Ltd</strong> 6.4% -4.4%Overseas Asset Management- OAM Asia Recovery <strong>Fund</strong> -5.0% -12.9%- OAM European Value <strong>Fund</strong> -0.3% -11.3%British Empire Securities Trust -8.3% -4.4%Caledonia Investments -6.6% -4.4%11