GEM 3000/IL - Point of Care Testing - Duke University
GEM 3000/IL - Point of Care Testing - Duke University
GEM 3000/IL - Point of Care Testing - Duke University

Create successful ePaper yourself
Turn your PDF publications into a flip-book with our unique Google optimized e-Paper software.
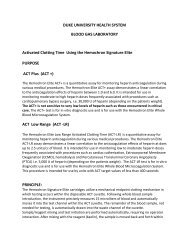
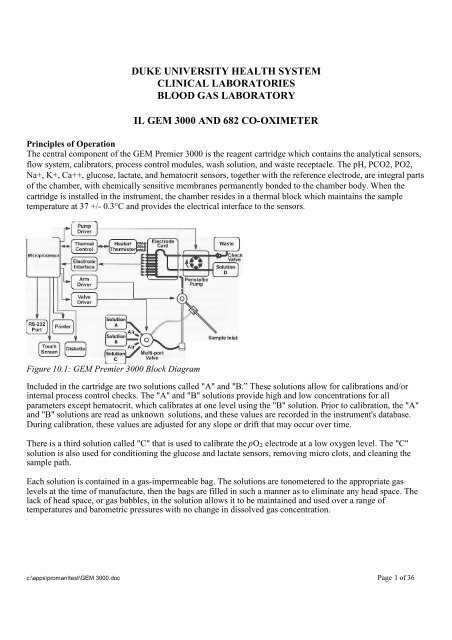
DUKE UNIVERSITY HEALTH SYSTEMCLINICAL LABORATORIESBLOOD GAS LABORATORY<strong>IL</strong> <strong>GEM</strong> <strong>3000</strong> AND 682 CO-OXIMETERPrinciples <strong>of</strong> OperationThe central component <strong>of</strong> the <strong>GEM</strong> Premier <strong>3000</strong> is the reagent cartridge which contains the analytical sensors,flow system, calibrators, process control modules, wash solution, and waste receptacle. The pH, PCO2, PO2,Na+, K+, Ca++, glucose, lactate, and hematocrit sensors, together with the reference electrode, are integral parts<strong>of</strong> the chamber, with chemically sensitive membranes permanently bonded to the chamber body. When thecartridge is installed in the instrument, the chamber resides in a thermal block which maintains the sampletemperature at 37 +/- 0.3°C and provides the electrical interface to the sensors.Figure 10.1: <strong>GEM</strong> Premier <strong>3000</strong> Block DiagramIncluded in the cartridge are two solutions called "A" and "B.” These solutions allow for calibrations and/orinternal process control checks. The "A" and "B" solutions provide high and low concentrations for allparameters except hematocrit, which calibrates at one level using the "B" solution. Prior to calibration, the "A"and "B" solutions are read as unknown solutions, and these values are recorded in the instrument's database.During calibration, these values are adjusted for any slope or drift that may occur over time.There is a third solution called "C" that is used to calibrate the pO 2 electrode at a low oxygen level. The "C"solution is also used for conditioning the glucose and lactate sensors, removing micro clots, and cleaning thesample path.Each solution is contained in a gas-impermeable bag. The solutions are tonometered to the appropriate gaslevels at the time <strong>of</strong> manufacture, then the bags are filled in such a manner as to eliminate any head space. Thelack <strong>of</strong> head space, or gas bubbles, in the solution allows it to be maintained and used over a range <strong>of</strong>temperatures and barometric pressures with no change in dissolved gas concentration.c:\apps\proman\test\<strong>GEM</strong> <strong>3000</strong>.doc Page 1 <strong>of</strong> 36
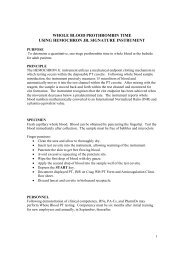
The cartridge also includes a reference solution,distribution valve, pump tubing, sampler, and waste bag.Blood samples that have been analyzed are prevented fromflowing back out <strong>of</strong> the waste bag due to the presence <strong>of</strong> aone-way check valve in the waste line.Electrochemical SensorsThe electrochemical sensors used in the <strong>GEM</strong> Premier<strong>3000</strong> PAK disposable cartridge are all formed on acommon plastic substrate. The reference electrode on thesensor card provides a highly stable reference potential forthe system.The individual sensors, with the exception <strong>of</strong> hematocritand reference, are formed from layers <strong>of</strong> polymer filmswhich are bonded to the substrate. A metallic contact undereach sensor is brought to the surface <strong>of</strong> the substrate t<strong>of</strong>orm the electrical interface with the instrument.pH and Electrolytes (Na+, K+, and Ca++)The pH and electrolyte sensors are all based on the principle <strong>of</strong> ion-selective electrodes; that is, an electricalpotential can be established across a membrane which is selectively binds to a specific ion. The potential can bedescribed by this simplified form <strong>of</strong> the Nernst equation:E = E' + (S x Log C)where E is the measured electrode potential, E' is the standard potential for that membrane, S is the sensitivity(slope), and C is the ion activity or concentration <strong>of</strong> the desired analyte. E' and S can be determined by thesensor response to the calibration solutions, and the concentration <strong>of</strong> the analyte (C) can be calculated for themeasured electrode potential (E). For pH, "log C" is replaced by "pH" and the equation solved accordingly.The pH and electrolyte sensors are polyvinyl chloride (PVC) based ion selective electrodes, consisting <strong>of</strong> aninternal Ag/AgCL reference electrode and an internal salt layer. Their potentials are measured against the cardreference electrode. The cutaway view in figure 10.4 shows the flow <strong>of</strong> the solution past an ion-selective sensor.If pH reports with an exception, then pCO 2 , HCO 3 , TCO 2 , BE, and SO 2 c will not be reported. If Na+ reportswith an exception, then Hct will not be reported.Ca++ correction to pH=7.4The following equation is used to calculate the ionized calcium value using a constant pH <strong>of</strong> 7.4 for each patientsample analysis.Ca++ (corrected) = (Ca++ (meas) x 10 (-0.178 x (7.4-pH)) )c:\apps\proman\test\<strong>GEM</strong> <strong>3000</strong>.doc Page 2 <strong>of</strong> 36
Figure 10.4: Cutaway View <strong>of</strong> an Ion-Selective SensorCarbon Dioxide (pCO2 mmHg)The pCO2 sensor is a pH sensor electrode covered by a CO 2 gas permeable outer membrane. The sensor has aninternal Ag/AgCl reference electrode and an internal bicarbonate buffer. The pCO2 in the internal solution willcome to equilibrium with the pCO2 <strong>of</strong> a liquid (e.g. blood) in contact with the outer surface <strong>of</strong> the membrane.The pH <strong>of</strong> the internal solution varies with the pCO2 in accordance with the Henderson-Hasselbalch equation:-where pKa is an equilibrium constant, HCO 3 is the bicarbonate ion concentration, and "a" is the solubilitycoefficient <strong>of</strong> CO2 in water. The generated potential versus the pH sensor is related to the logarithm <strong>of</strong> pCO2content in the sample. Cutaway views <strong>of</strong> the pCO2 and pH sensors are shown in figure 10.5.If pCO 2 reports with an exception, then HCO 3 - and TCO 2 will not be reported.The generated potential versus the pH sensor is related to the logarithm <strong>of</strong> pCO2 content in the sample.Figure 10.5: Cutaway View <strong>of</strong> pCO2 and pH SensorsOxygen (pO2 mmHg)The oxygen sensor is an amperometric electrode consisting <strong>of</strong> a small platinum electrode poised at a negativepotential with respect to the card reference electrode. An O2 gas permeable polypropylene membrane protectsthe platinum from protein contamination which improves specificity and prolongs sensor life. A cutaway view<strong>of</strong> the oxygen sensor is shown in figure 10.6.c:\apps\proman\test\<strong>GEM</strong> <strong>3000</strong>.doc Page 3 <strong>of</strong> 36
Card reference electrodeFigure 10.6: Cutaway View <strong>of</strong> Oxygen SensorThe current flow between the platinum and the counter electrode is proportional to the oxygen partial pressure.The current flow between the platinum surface and the ground electrode is proportional to the rate at whichoxygen molecules diffuse to the platinum and are reduced, which in turn is directly proportional to the pO2-This relationship is described by the equation:I = (S x pO2) + IZwhere I is the electrode current, S is the sensitivity, and IZ is the zero current. The values <strong>of</strong> S and IZ can becalculated from the calibration data for the sensor. The equation can then be solved for PCO2 where I becomesthe electrode current produced by the blood sample.If pO2 reports with an exception, then BE and SO2c will not be reported.Glucose and LactateThe glucose and lactate sensors are platinum amperometric electrodes poised at a positive potential with respectto the card reference electrode. Glucose or lactate are determined by enzymatic reaction with oxygen in thepresence <strong>of</strong> glucose oxidase or lactate oxidase to produce hydrogen peroxide, which reacts at the platinumelectrode. The current flow between the platinum electrode and the ground electrode is proportional to the rateat which hydrogen peroxide molecules diffuse to the platinum and are oxidized, which in turn is directlyproportional to the metabolite (glucose or lactate) concentration:I = (S x metabolite) + IZwhere I is the electrode current, S is the sensitivity, and IZ is the zero current. The value <strong>of</strong> S and IZ can becalculated from the calibration data for the sensor. The equation can then be solved for the metaboliteconcentration, where I becomes the electrode current produced by the blood sample.A diagram showing the configuration <strong>of</strong> the sensor is shown in figure 10.7. The sensor is constructed <strong>of</strong> a threelayercomposite membrane consisting <strong>of</strong> an inner layer for screening out the interferences, the enzyme foroxidation reaction, and the outer layer for controlling the metabolite diffusion in the enzyme layer.c:\apps\proman\test\<strong>GEM</strong> <strong>3000</strong>.doc Page 4 <strong>of</strong> 36
ICard reference electrodeFigure 10.7: Cutaway View <strong>of</strong> an Analyte Sensor (Glucose or Lactate)The current flow between the platinum and the counter electrode is proportional to the analyte concentration.HematocritHematocrit is calculated from the Total Hemoglobin value.Hematocrit = Total Hemoglobin x 3.Card ReferenceThe card reference consists <strong>of</strong> a Ag/ AgNO3 electrode with an open liquid junction between the silver electrodeand the sensor chamber. Every time a sample is pumped into the sensor chamber, fresh reference solutioncontaining silver nitrate flows into the reference chamber and comes in contact with the sample. This processprovides a stable and reliable potential independent <strong>of</strong> the sample composition.P50The partial pressure (mmHg) <strong>of</strong> 0 2 in a hemoglobin solution having an oxygen saturation <strong>of</strong> 50%, P50, iscalculated only for venous samples. The following equation will be used:P50 = 10 -(Q/2.7)Q = log (R / (100 – R))- 2.7 * log (pv02(T))R = O2Hb or S02, as selected in configurationWhere:pvO2(T) pO2 (mmHg) for the current venous sample, corrected for patient temperature.Use non- temperature corrected value if pO2(T) is not available.O2Hb Received from external CO-Ox for current venous sample, %. If 02Hb is not inthe range 30 - 75%, P50 becomes incalculable.S02 O2 saturation as received from the external <strong>IL</strong> CO-Oximeter for current venoussample, %. If S02 is not in the range 30 - 75%, P50 becomes incalculable.Intelligent Quality Management(IQM)IQM is an active quality process control system designed to help ensure that the <strong>GEM</strong> Premier <strong>3000</strong> providesreliable results. IQM continuously monitors operation <strong>of</strong> the testing process, including calibrators, sensors,fluidics, and electronics, and automatically performs and documents corrective actions upon detecting an error.IQM is designed to provide immediate error detection and correction, replacing the use <strong>of</strong> conventional externalquality controls. IQM is a combination <strong>of</strong> s<strong>of</strong>tware, Process Control Solutions, and Calibration ValidationProduct. During the 3-week use-life <strong>of</strong> the <strong>GEM</strong> PAK iQM cartridge, iQM: validates the integrity <strong>of</strong> the cartridge, continuously monitors the performance <strong>of</strong> the system,c:\apps\proman\test\<strong>GEM</strong> <strong>3000</strong>.doc Page 5 <strong>of</strong> 36
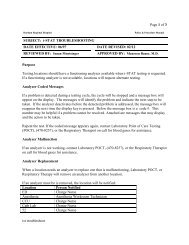
monitors the electrode responses <strong>of</strong> each sample to detect microclots, etc that may effect analyticalresults. identifies the source <strong>of</strong> the change, and initiates remedial action, and documents it.<strong>IL</strong> 682 CO-OXWhole blood samples are chemically hemolyzed by a non-ionic surfactant. The hemolyzed blood is thenanalyzed spectrophotometrically in a flow-through, thermostatted cuvette.An anticoagulated whole blood sample is aspirated into the instrument, mixed with diluent, hemolyzed, andbrought to a constant temperature in the cuvette. Monochromatic light at six specific wavelengths passesthrough the cuvette to a photo-detector, whose output is used to generate absorbances. These absorbancemeasurements are used to calculate Total Hemoglobin (tHb), percent Oxyhemoglobin (%O2Hb), percentCarboxyhemoglobin (%COHb), percent Methemoglobin (%MetHb), and percent DeoxyhemoglobinHemoglobin (%HHb). Percent measured Oxygen Saturation (%SO2M), Oxygen Content (O2Ct), and OxygenCapacity (O2Cap) are also calculated.500 520 540 560 580 600 620 640 660 680 700WavelengthFigure A5-1 Hemoglobin SpectraA thallium/neon hollow cathode lamp (HCL) emits light at several exact wavelengths. Six specific wavelengths(in the 530 through 670 nm range) are isolated using interference filters mounted on a motor-driven filter wheel.The light beam emerging from the reflective isolator is beam split; one beam is imaged onto the referencedetector and the other beam is imaged onto the sample detector.Computation <strong>of</strong> Absorbances1. The Blank Measurement.At the end <strong>of</strong> each sample cycle, or on demand, six blank absorbances (one for each wavelength) are obtainedwith zeroing solution in the cuvette.2. Sample Measurement.When diluted and hemolyzed sample (blood, Control, or Calibrator) is present in the cuvette, six sampleabsorbances (one for each wavelength) are obtained.3. Calculation <strong>of</strong> Absorbances.The six Blank absorbances are subtracted from the six sample absorbances to obtain six net absorbances.c:\apps\proman\test\<strong>GEM</strong> <strong>3000</strong>.doc Page 6 <strong>of</strong> 36
A(Net) = A(Sample) - A (Blank)where A equals the absorbance at each wavelength.Calculation <strong>of</strong> concentrationsThe measured absorbances are used with a matrix <strong>of</strong> hemoglobin extinction coeffiecients (molar absorptivities,see Figure 5-1) to calculate the fractional concentrations <strong>of</strong> the various hemoglobin species present in thesample. At defined wavelengths, each species <strong>of</strong> hemoglobin in the sample has an absorbance which is theproduct <strong>of</strong> the cuvette pathlength, the concentration, and the extinction coefficient for that substance.A x = K[E 1 C 1 + E 2 C 2 + E 3 C 3 ………E n C n ]where:C = Concentration <strong>of</strong> each Hb species.K = a scalar constant set by the tHb calibration process.E = Each Extinction coefficient in the matrix.A = The absorbance value <strong>of</strong> the blood at each wavelength.Concentrations are used to determine tHb and relative percent Hb species.The ctHb value (g/dL) is the sum <strong>of</strong> the four concentrations:ctHb = C(O2Hb)+ C(HHb) + C(COHb) + C(MetHb)Derivation <strong>of</strong> Measured and Calculated ParametersThis section details the derivations <strong>of</strong> the five parameters measured by the <strong>IL</strong> 682 CO-Oximeter system, as wellas those parameters that are calculated. Consult related texts listed in the bibliography for further information.Measured ParametersTotal Hemoglobin Concentration (tHb)Total hemoglobin concentration is the sum <strong>of</strong> the concentrations <strong>of</strong> the hemoglobin species 02Hb, COHb, HHb,and MetHb. This measured parameter is important to the diagnosis and treatment <strong>of</strong> oxygen transport disorders,anemias, and other clinical problems. Reference range for normal adults is from 12.0 to 18.0 g/dL. Totalhemoglobin may be displayed on the <strong>IL</strong> 682 in mmol/L, g/dL or g/L. The choice is operator selectable.Total hemoglobin on the <strong>IL</strong> 682 is determined as follows:tHb =(O2Hb + COHb + MetHb +HHb)xK(a scaling factor)Oxyhemoglobin Percentage (%O2Hb)Hemoglobin, with oxygen reversibly bound, to it provides the major source <strong>of</strong> oxygen for cells. Oxygen is takenup in the lungs and released to the tissues. Each functional hemoglobin molecule binds one oxygen molecule ateach iron atom for a total <strong>of</strong> four molecules <strong>of</strong> oxygen per hemoglobin molecule. For arterial blood, the normalrange is 94.0 to 97.0%.Oxyhemoglobin on the <strong>IL</strong> 682 is determined as follows:Carboxyhemoglobin Percentage (%COHb)Hemoglobin, with carbon monoxide reversibly bound, represents one <strong>of</strong> the dysfunctional forms which areunavailable to carry oxygen to the tissues. Hemoglobin affinity for carbon monoxide is 210 times that <strong>of</strong>oxygen, so COHb is effectively unavailable for oxygen transport. Small amounts <strong>of</strong> carbon monoxide arepresent as a metabolic end product in all human blood. Environmental exposure, however, can raise this levelappreciably (see Bibliography).c:\apps\proman\test\<strong>GEM</strong> <strong>3000</strong>.doc Page 7 <strong>of</strong> 36
%COHb is represented by the equation:Methemoglobin Percentage (%MetHb)Methemoglobin is a derivative <strong>of</strong> hemoglobin in which the ferrous iron is oxidized to the ferric state.Methemoglobin is a dysfunctional hemoglobin, in that it is unable to combine reversibly with oxygen or carbonmonoxide. In addition, it causes a shift <strong>of</strong> the oxygen dissociation curve (P50) and hinders the transfer <strong>of</strong>oxygen from the blood to the tissues (see Bibliography).The ability to measure methemoglobin levels in the blood is an important feature <strong>of</strong> the <strong>IL</strong> 682 CO-Oximetersystem. At 1evels greater than 10%, however, the level <strong>of</strong> accuracy for measurement <strong>of</strong> other hemoglobinspecies may be affected.%MetHb is represented by the equation:[MetHb ]% MetHb =[HBb] +[OzBb] + [COBb] + [MetBb]x100Deoxyhemoglobin Percentage (%HHb)Deoxyhemoglobin (formerly referred to as reduced hemoglobin) is a form <strong>of</strong> hemoglobin which is capable <strong>of</strong>reversibly binding oxygen, but is not presently combined with oxygen or other substances.%HHb is represented by the equation:%HHb =[HHb] x 100(HHb] +[O2Hb] + [COBb] + [MetHb]Calculated ParametersOxygen Content (O2ct)The oxygen content <strong>of</strong> a blood sample is directly displayed by the <strong>IL</strong> 682 system. It is a calculated value, basedon the tHb and %OzHb. It has been determined that one gram <strong>of</strong> hemoglobin can be combined with 1.39 mL <strong>of</strong>oxygen, at STP (the <strong>IL</strong>682 allows input <strong>of</strong> value between 1.00 and 1.99 for oxygen multiplier). The calculationmay be represented by the following equation:02 Content = 1.39 x tHb x %O2Hb100This expression <strong>of</strong> oxygen content does not include physically dissolved oxygen and does not, therefore, expresstotal oxygen content, but more correctly the oxygen content <strong>of</strong> hemoglobin. Data is expressed in terms <strong>of</strong>milliliters <strong>of</strong> oxygen at STP per one hundred milliliters <strong>of</strong> blood, or simply as Vol%O2. It may also beexpressed as mmol/L.Oxygen Capacity (O2Cap)Oxygen capacity <strong>of</strong> a blood sample is related to oxygen content. Multiplying the tHb by 1.39 (see "OxygenContent" above for derivation <strong>of</strong> 1.39) provides the volume <strong>of</strong> oxygen capable <strong>of</strong> being reversibly bound andtransported at the available hemoglobin concentration <strong>of</strong> the sample. The equation for oxygen capacity mustallow for carboxyhemoglobin and methemoglobin concentration, to express the capacity based on availablehemoglobin. The equation for oxygen capacity is:(%COHb + % MetHb )c:\apps\proman\test\<strong>GEM</strong> <strong>3000</strong>.doc Page 8 <strong>of</strong> 36
02 Capacity = 139 x THb x 1 - 100Like oxygen content, results are expressed in milliliters <strong>of</strong> oxygen at STP per one hundred milliliters <strong>of</strong> blood(Vol%O2) and does not include physically dissolved oxygen. 02Cap can also be expressed in terms <strong>of</strong> mmol/L.Measured Oxygen Saturation Percentage (%s0 2 )The amount <strong>of</strong> oxyhemoglobin in blood expressed as a fraction <strong>of</strong> the amount <strong>of</strong> hemoglobin able to bindoxygen (oxyhemoglobin plus deoxyhemoglobin), is termed hemoglobin oxygen saturation. Oxygen saturationbased on available hemoglobin is mathematically different from oxyhemoglobin percentage (%02Hb) based ontotal hemoglobin. Since both carboxyhemoglobin and methemoglobin are present at varying levels in the blood,but are not available for binding oxygen, the denominator <strong>of</strong> the %S02 and %02Hb equations for a given samplecan be substantially different. The greater the concentration <strong>of</strong> these alternate hemoglobin forms, the moredivergent the two expressions. (see "Oxyhemoglobin Percentage" above for the %OzHb equation). Select theappropriate base for expressing the oxygen-hemoglobin relationship. Each satisfies a different requirement and adifferent property <strong>of</strong> the oxygen-hemoglobin relationship.The measured oxygen saturation percentage equation is:%sO2 = %O2Hb x100100 - (%COHb + %MetHb)Detected/Corrected Interferences Fetal Hemoglobin Correction (HbF)The presence <strong>of</strong> fetal hemoglobin (HbF) causes changes in the absorbance spectra as the fetalhemoglobin species differ from that <strong>of</strong> the adult. Corrections are made for both % carboxyhemoglobin and %oxyhemoglobin, by means <strong>of</strong> the following equations:COBb (corrected) = %COBb (measured) - %COHb (fictitious)%O2Hb (corrected) = %O2Hb (measured) + %COHb (fictitious)where:%COHb (fictitious) = m x %O2Hb (measured) + 0.24%m = 0.065 (%HbF) + 0.005100The %HbF is entered by the operator through the keyboard.Sulfhemoglobin detectionSulfhemoglobin (SHb) is a form in which the hemoglobin iron molecules are combined with sulfur. SHb canreversibly combine with oxygen, but the affinity is only 1 % that <strong>of</strong> SHb. Because <strong>of</strong> spectral characteristics atthe wavelengths used by <strong>IL</strong> 682, SHb can interfere with other hemoglobin measurements. Typically, thepresence <strong>of</strong> SHb causes an apparent increase in MetHb and negative results for COHb. <strong>IL</strong> 682 detects thepresence <strong>of</strong> SHb by measuring the ratio <strong>of</strong> absorbances. This procedure differentiates between actual highMetHb and the suspected presence <strong>of</strong> SHb. If this procedure detects SHb above a prescribed level, the operatoris warned and the data are flagged. Samples with low SHb, but which have abnormal absorbance spectra, canfalsely trigger the SHb indicator.Turbidity CorrectionLight scattering in analytical samples is caused mainly by the presence <strong>of</strong> lipids. This scattering can interferewith absorbance measurements and affect CO-Oximetry results. Background "absorbance" changes resultingfrom sample turbidity have been found to exhibit a predictable relationship to wavelength and concentration <strong>of</strong>turbid material. <strong>IL</strong> 682 uses a dedicated wavelength to measure and correct for possible interference by theaddition <strong>of</strong> turbidity.c:\apps\proman\test\<strong>GEM</strong> <strong>3000</strong>.doc Page 9 <strong>of</strong> 36
Below levels <strong>of</strong> turbidity corresponding to 3.0% Intralipid, the <strong>IL</strong> 682 corrects the results without indication. Atlevels <strong>of</strong> turbidity corresponding to the addition <strong>of</strong> 3.0% or greater Intralipid, the <strong>IL</strong>682 corrects the results anddisplays a warning to the operator that high turbidity may be present. 3.0% added Intralipid corresponds toapproximately 1500 mg/dL triglycerides.Equipment<strong>GEM</strong> Premier <strong>3000</strong> Instrument (P/N 570001000)<strong>IL</strong> 682 Co-oximeterCerner VT320 terminal and keyboardInstallation Dates: OR and Peds Cath Lab – Septmember 21, 20043264 Main Lab - November 2, 2004Supplies<strong>GEM</strong> Premier <strong>3000</strong> PAK ® CartridgeCartridge TypesiQM: CVP (Calibration Verification Material) material is run immediately after cartridge warm-up toverify cartridge calibration. The instrument then handles quality control automatically, and externalcontrols are not required.Part NumberiQMCartridgenon-iQMCartridge Analytes24315089 24315009 pH, pO 2 , pCO 2 , Hct, Na + , K + ,Ca ++ , Glu, Lac24330089 243<strong>3000</strong>9 pH, pO 2 , pCO 2 , Hct, Na + , K + ,Ca ++ , Glu, Lac24345089 24345009 pH, pO 2 , pCO 2 , Hct, Na + , K + ,Ca ++ , Glu, Lac24360089 24360009 pH, pO 2 , pCO 2 , Hct, Na + , K + ,Ca ++ , Glu, LacMaximumTests150 21300 21450 21600 14Use-Life(Days)Cartridge StorageRoom temperature: 15 to 25°C (59 to 77°F).Cartridge ExpirationShelf-Life Expiration: The cartridge may be used up to and including the expiration dateshown on the packaging.On-board Expiration: The <strong>GEM</strong> Premier <strong>3000</strong> PAK cartridge must be replaced when themaximum number <strong>of</strong> tests are run, or when cartridge use-life is reached, whichever comes first.Calibration Validation Product (CVP) and Controls for iQM Cartridges<strong>GEM</strong> CVPPart NumberDescriptionc:\apps\proman\test\<strong>GEM</strong> <strong>3000</strong>.doc Page 10 <strong>of</strong> 36
Part Number Description24001587 Multipak, 20 ampules, 5 x 4 levels x 2.5mL<strong>GEM</strong> CVP solutions are used for the verification <strong>of</strong> the iQM cartridges prior to to reporting patient results.<strong>GEM</strong> CVP 1 and 2 ampules: Aqueous buffered bicarbonate solution containing inorganic saltsand organic metabolites, equilibrated with precise concentrations <strong>of</strong> carbon dioxide and oxygen.<strong>GEM</strong> CVP 3 and 4 ampules: Aqueous buffered bicarbonate solution containing inorganic salts and equilibratedwith carbon dioxide and oxygen.One set <strong>of</strong> <strong>GEM</strong> CVP consists <strong>of</strong> 4 ampules with the following configurations.<strong>GEM</strong> CVP 1: low pH, pO 2 , Na + , K + , glucose, lactate; high pCO 2 and Ca ++ values<strong>GEM</strong> CVP 2: high pH, pO 2 , Na + , K + , glucose, lactate; low pCO 2 and Ca ++ values<strong>GEM</strong> CVP 3: low hematocrit values<strong>GEM</strong> CVP 4: normal hematocrit valuesQuality Control for iQM CartridgesOnce the iQM cartridge is validated with CVP, the quality control process becomes an automatic part <strong>of</strong> theiQM cartridge operation. Process Control solutions A, B and C incorporated within the iQM cartidge, alongwith other iQM process checks, continuously monitor operation <strong>of</strong> the entire testing process including sensors,fluidics, and electronics, thus eliminating the need to run external quality controls.External Quality Control for the <strong>GEM</strong> <strong>3000</strong>The first twelve months external controls will be run on the <strong>GEM</strong> <strong>3000</strong> to validate IQM and the internalcontrols. The QC schedule for the first year is as follows:First six months (November 2, 2004 – May 22, 2005)OR instruments: Level 1,2,3 <strong>of</strong> Contril per instrument per week.3264 Main Lab: Level 1,2,3 <strong>of</strong> Contril per instrument per day.After May 30, 2005OR instruments: Contril level 1,2,3 per instrument per week.3264 Main Lab: Contril level 1,2,3 per instrument per week.Within Laboratory QC Pr<strong>of</strong>iciency.Performed daily.A pooled patient sample is run on all OMNI’s along with a spun hematocrit for comparison <strong>of</strong> bloodgases, sodium, potassium, ionized calcium, CO-OX parameters, glucose, and hematocrit values.Bi-weekly Between Laboratory QC.For comparison <strong>of</strong> all blood gas parameters included above<strong>IL</strong> Quality Control (Contr<strong>IL</strong> ® 9)Part Number Description24001418 Multipak, 30 ampules, 10 x 3 levels x 2mL24001419 Level 1, 30 ampules x 2mL24001420 Level 2, 30 ampules x 2mL24001421 Level 3, 30 ampules x 2mLc:\apps\proman\test\<strong>GEM</strong> <strong>3000</strong>.doc Page 11 <strong>of</strong> 36
Contr<strong>IL</strong>9 includes three different ampules <strong>of</strong> aqueous, tonometered buffers. Each ampule contains knownquantities <strong>of</strong> analytes at low, normal, and high physiological levels. For QC <strong>of</strong> pH, pCO 2 , pO 2 , Na + , K + , Ca ++ ,glucose, and lactate.Performance Verification ProductPart Number Description24001525 PVP set, multipak, 4 x 5 levels24001526 PVP Crit set, multipak, 4 x 4 levels<strong>GEM</strong> PVP for periodic use, as designated by some regulatory agencies, and can be used with any cartridge type.StorageContr<strong>IL</strong> 7 and <strong>GEM</strong> critCheck QC material should be stored at room temperature and is stable for use until thevial is opened or until the expiration date. Contr<strong>IL</strong>9 and Calibration Validation Product (CVP) are storedrefrigerated at 2 to 8ºC and are stable until the expiration date on the box. Alternatively, Contr<strong>IL</strong> 9 and CVPmay be stored for up to 12 months at room temperature (up to 28ºC), as long as the expiration date on the box isnot exceeded.<strong>IL</strong> 682 CO-OX ControlsRun two levels, rotating levels 1,2,3, <strong>of</strong> <strong>IL</strong> CO-OX controls once per day on the OR instruments and every eighthours in the main lab.<strong>IL</strong> Multi-4TM CO-Oximeter controls level 1, 2 and 3 are purified suspensions <strong>of</strong> human hemoglobin in aphysiologically buffered matrix. The following parameters can be monitored with this control: tHb, %O2Hb,%COHb, and %MetHb. A fourth level is available which is a stabilized preparation <strong>of</strong> lysed bovine erythrocytesfully saturated with carbon monoxide. For more details on these products refer to the package insert. Store <strong>IL</strong>Multi-4 controls at 2-8 o CCartridge Insertion and Warm-upCartridge Insertion1. Unlatch the cartridge door on the instrument’s right side by sliding the lock handle to the front andopening the door.2. Check the label on the foil bag containing the <strong>GEM</strong> Premier <strong>3000</strong> PAK cartridge to be sure that thecartridge is not past its expiration date.CAUTION: Do not use an expired cartridge. The <strong>GEM</strong> Premier <strong>3000</strong> will not except an expiredcartridge unless that date is set incorrectly. Please refer to the Operator’s Manual, page 2.7 forinstructions on setting the date/time.3. Open the foil bag, and remove the cartridge.4. Check the inside <strong>of</strong> the foil bag to be sure that it is dry.CAUTION: If there is any moisture inside the foil bag, DO NOT USE the cartridge. Open a fresh<strong>GEM</strong> Premier <strong>3000</strong> PAK cartridge and call Technical Support at Instrumentation Laboratory.5. Grasp the tab end <strong>of</strong> the plastic protective cover. Pull firmly to remove the cover.c:\apps\proman\test\<strong>GEM</strong> <strong>3000</strong>.doc Page 12 <strong>of</strong> 36
NOTE: The cartridge must be inserted into the instrument within one minute <strong>of</strong> removing theprotective cover.6. Align the cartridge according to the labels. Using a rapid, smooth, continuous motion, insert thecartridge into the instrument’s cartridge compartment.NOTE: The cartridge will not insert all the way into the compartment. A small lip <strong>of</strong> the cartridgewill rest on the door.7. When the instrument has successfully read and validated the barcode and the date/time has beenaccepted, it will prompt you to close the cartridge door. If the instrument displays a message thatthe barcode reader did not read the label, follow the directions on the screen to complete theinsertion process. The instrument will make three attempts to read the barcode before prompting theoperator to use the barcode wand. If the barcode cannot be read, contact <strong>IL</strong> Technical Support.8. The instrument will prompt: Is the date/time correct? If correct, select YES to proceed with warmup.Otherwise, select NO to correct the date/time. The instrument will prompt: Remove cartridge.Remove the cartridge (see “5.5 Cartridge Removal”) to begin the process again, changing the dateand time when prompted.9. Close the door, and slide the lock handle toward the back <strong>of</strong> the unit.The cartridge door will lock. The <strong>GEM</strong> Premier <strong>3000</strong> will display the Cartridge Warm-up screen.Cartridge Warm-upCartridge warm-up requires approximately 30 minutes. Samples cannot be analyzed during cartridgewarm-up, but the instrument does allow access to many <strong>of</strong> the menu commands.During cartridge warm-up, the instrument brings the measuring chamber to the proper temperature andperforms several rinses and calibrations. If an error occurs during warm-up, the instrument will promptfor removal <strong>of</strong> the cartridge (see “5.5 Cartridge Removal” for instructions).The <strong>GEM</strong> Premier <strong>3000</strong> will also determine the type <strong>of</strong> cartridge during cartridge warm-up. If a noniQMcartridge is inserted, the instrument will continue with warm-up. If an iQM cartridge is inserted,the instrument’s response will depend upon how iQM Mode has been configured: If iQM Mode is ON, it will be left ON. If iQM Mode is OFF, the instrument will display the message: Would you like to enable iQM? Ifyou enable iQM, CVP material should be ready for analysis. YES/NO. If YES is selected, iQMMode will be turned ON. If NO is selected, iQM Mode will remain OFF, and the iQM cartridgewill be treated as a non-iQM cartridge.After iQM Mode has been configured (ON or OFF), the mode cannot be changed for the duration <strong>of</strong> theinserted iQM cartridge. After the cartridge is removed, iQM Mode will remain at its current setting butwill be available for changing, if desired.When cartridge warm-up is complete, the instrument will display the Ready screen.If an iQM cartridge is inserted and iQM Mode is ON, the instrument will display a reminder to run alllevels <strong>of</strong> CVP material, and the status <strong>of</strong> all analytes will be set to “Pending CVP.” All levels <strong>of</strong> CVPmaterial must be run and within range before patient samples can be reported (see “5.3.1 QualityControl for iQM Cartridges”).c:\apps\proman\test\<strong>GEM</strong> <strong>3000</strong>.doc Page 13 <strong>of</strong> 36
Quality Control for iQM CartridgesWhen you are using an iQM cartridge, CVP material must be run immediately after cartridge warm-upprior to being able to report patient results. The instrument then handles quality control automatically,and you are not required to run external controls.CVP SamplingNOTE: CVP material must be predefined by the Key Operator prior to running CVP samples.1. Touch CVP on the Ready screen.2. Enter an operator ID by entering the appropriate characters on the keypad or with thebarcode wand. Touch ENTER.3. Identify the CVP material:a) Lift the door to the ampule spinner, and insert and release the ampule. Thereader will spin the ampule and read the barcode.b) If the lot number is not found, the instrument will prompt for a different ampuleor for selection <strong>of</strong> material from a list <strong>of</strong> defined material.c) If the lot number matches the lot number <strong>of</strong> a defined material, the instrumentwill prompt for sample aspiration. If the selected material only contains analytesthat have failed calibration, the instrument will abort the sampling process.4. Prepare the CVP material:a) Mix the solution by vigorously shaking the ampule.b) Tap the solution from the tip <strong>of</strong> the ampule to restore solution to the bottom part<strong>of</strong> the ampule. Allow bubbles to dissipate for at least 10 seconds.c) Use the instrument’s ampule breaker to snap <strong>of</strong>f the ampule neck.CAUTION: Analyze CVP solution within one minute <strong>of</strong> opening the ampule.5. Position the ampule on the sampler when the screen instructs you to do so. Make surethe sampler is near, but not touching, the bottom <strong>of</strong> the ampule. Touch OK.6. Remove ampule AFTER the instrument beeps four times and displays the messageRemove the sample. The instrument will wait two seconds for removal <strong>of</strong> the samplebefore withdrawing the sampler.7. Dispose <strong>of</strong> ampule in an appropriate waste container.8. The instrument will take 85 seconds to process the sample and display results. Duringthis time, a progress indicator will be displayed. The Sample Information screen willalso be displayed to prompt for entry <strong>of</strong> sample information.CVP Sample Information9. Enter Operator ID as necessary: If Operator Security is ON and an operator password was previously entered, theoperator ID associated with the password will be displayed. This ID cannot bechanged. If Operator Security is OFF, no operator ID will appear, and the ID can be entered(up to 16 alphanumeric characters) or left blank as desired.c:\apps\proman\test\<strong>GEM</strong> <strong>3000</strong>.doc Page 14 <strong>of</strong> 36
10. Enter an optional sample comment to record a short description with the sample. Thiscomment, up to two lines <strong>of</strong> 24 characters each, will be saved, printed, and transmittedwith the sample.CVP Sample ResultsMeasured results will be displayed along with the expected results. If the measured valuesfall within the expected range, “Pass” will be displayed. If a measured value falls outsidethe expected range, the screen and print-out indicate a failure with the message “Fail” and a“F” on the hard copy print-out next to the analyte which has failed. CVP data isautomatically downloaded into an on-board computer memory for future analysis andtransferred to disk for record keeping.NOTE: The instrument stores all data generated while a cartridge is in service and for atleast 20 cartridges.CVP Sample DispositionIf one or more <strong>of</strong> the CVP analytes failed and you select the ACCEPT or DISCARD button,the instrument will prompt with the message: CVP failure. Perform 2-point calibrationbefore repeating the failed CVP sample. Touch OK, then initiate a 2-point calibration fromthe DIAGNOSTICS menu prior to repeating the CVP sample.NOTE: The sensor status on the Ready screen will not change to Green/OK until all CVPmaterials associated with that analyte are run and passed. Sensor status will remain as eitheryellow/Pending CVP, or red/Failed CVP. CVP failures will be cleared when the failed CVPmaterial is run and passed or when the cartridge is replaced. Touch the ACCEPT button after the sample has been reviewed and deemed satisfactoryand after any user-entered information has been edited. No further editing <strong>of</strong> the samplewill be allowed.When you accept a CVP sample, the instrument will:– Set the sample’s disposition to ACCEPTED, and save the sample to the database.– Print a sample report.– Send the results to the LIS/DMS (if configured).– Satisfy the CVP requirement.– Return to the Ready screen. Touch the DISCARD button after the sample has been reviewed and deemed not validfor some reason. No further editing <strong>of</strong> the sample will be allowed, and the sample’sdisposition cannot be changed from DISCARDED. The instrument will prompt toconfirm the disposition. If NO is selected, the discard request will be aborted. If YES isselected, the instrument will:– Set the sample’s disposition to DISCARDED, and save the sample to the database.CVP Failure– Return to the Ready screen.If a measured value falls outside the expected CVP range for an analyte, the screen displaysCVP FA<strong>IL</strong> and highlights any analyte that failed. To correct the failure:11. Use 2-PT CAL on the DIAGNOSTICS menu to run a 2-pt calibration before trying torepeat the failed CVP run.c:\apps\proman\test\<strong>GEM</strong> <strong>3000</strong>.doc Page 15 <strong>of</strong> 36
12. Repeat the CVP with freshly opened CVP material from the same CVP lot.13. If the failure is corrected, ACCEPT the CVP results.• If the original failure is corrected but a new analyte fails, repeat the CVP withfreshly opened CVP material from the same CVP lot one more time.• If the failure is corrected, ACCEPT the CVP results.• If the failure is not corrected, remove the cartridge and notify Technical Support.NOTE: If a CVP failure persists, the analyte(s) will not be available.IMPORTANT: Ensure that enough CVP material is on hand toward the end <strong>of</strong> a lot toclear any existing failure conditions. Only CVP material from the same lot can clear an errorcondition for that lot.If a patient sample is run while an analyte is in the Pending CVP or Failed CVP state, theresult will not be reported. On the screen, the result will be flagged with “V” and blankedout. The printed report will display “PENDING CVP” or “FA<strong>IL</strong>ED CVP” as appropriate.CalibrationCancellations from CalibrationsIf an interruptible calibration is in progress, the instrument will interrupt the calibration and start thesampling process. The following calibrations cannot be interrupted: Two-point calibrations during the first four hours <strong>of</strong> cartridge life Two-point calibrations after the first four hours <strong>of</strong> cartridge life if the three previous two-pointcalibrations were interrupted for sample analysis Low O 2 calibrations The first one-point calibration after sample analysisFor more information about calibrations, see “5.4 Calibration.”Note: Do not interrupt a calibration unless it is absolutely necessary to analyze an urgent sample. If acalibration is interrupted, always allow the sample analysis to complete.<strong>GEM</strong> Premier <strong>3000</strong> calibrations are automatic. During calibrations, the instrumentinternally checks each sensor's performance to verify correct operation. Calibrationdata is automatically downloaded into an on-board computer memory for futureanalysis and transferred to disk for record keeping.The <strong>GEM</strong> Premier <strong>3000</strong> incorporates a two-point calibration for all parameters except hematocrit.Calibration values are read into the <strong>GEM</strong> Premier <strong>3000</strong> via the cartridge bar code. When you insert acartridge, the instrument pumps Reference Solution B into the electrode chamber and hydrates thesensors for 15 minutes. One- and two-point calibrations are performed according to the schedulesbelow.Two-point calibrations last approximately 2.5 minutes (4.5 min within the first 6 hrs). During this time,the instrument will remain at the Ready screen (during a two-point calibration). The calibrationprogress indicator will appear at the bottom <strong>of</strong> the Ready screen. After calibration, a print-out isgenerated. If all sensors are operating correctly, the print-out includes a “No Errors” message. (Note:c:\apps\proman\test\<strong>GEM</strong> <strong>3000</strong>.doc Page 16 <strong>of</strong> 36
the content <strong>of</strong> the Calibration Report is determined by the option chosen during instrumentconfiguration.) If a slope or drift error is detected, the analyte which has failed will be flagged with a“slope error” or a “drift error” message. The instrument will then withhold results for that analyte untilsensor performance returns to normal.One-point calibrations occur every 30 minutes, at a minimum, and after every patient sample.Calibration SchedulesOne-<strong>Point</strong> Calibration ScheduleCartridge Life after Warm-upCalibration Frequency0.5 to less than 3 hours every 2 minutes3 hours to less than 6 hours every 4 minutes6 hours to less than 10 hours every 6 minutes10 hours to less than 20 hours every 10 minutes20 hours to less than 40 hours every 15 minutes40 hours to less than 80 hours every 20 minutes80 hours or greater every 30 minutesBetween one-point calibrations, all sensor outputs are monitored every 30 seconds, and anautomatic one-point calibration will be initiated if the instrument detects excessive drift inany channel.Two-<strong>Point</strong> Calibration ScheduleCartridge Life after Warm-upCalibration Frequency30 min. to less than 50 min. every 20 minutes50 min. to less than 80 min. every 30 minutes80 min. to less than 2 hours every 40 minutes2 hours to less than 8 hours every hour8 hours to less than 20 hours every 2 hours20 hours to less than 40 hours every 3 hours*40 hours or greater every 4 hours** Or 20 samples, whichever comes first.During the recovery following instrument restart, the instrument will perform a one-point ortwo-point calibration as needed before the Ready screen is displayed, then the calibrationfrequency will resume according to the previous schedule.Low O 2 Calibration ScheduleLow O 2 calibrations occur once every 24 hours throughout cartridge life, after warm-up.Following the low O 2 calibration, the instrument will perform one-point calibrations everythree minutes for 15 minutes, then return to the previous schedule. The exact time <strong>of</strong> the dayfor performing the low O 2 calibration is determined by the Key Operator during instrumentsetup.Calibration NotesCalibration FailureIf an automatic one-or two-point calibration fails, the <strong>GEM</strong> Premier <strong>3000</strong> will automaticallyinitiate up to two additional one-or two-point calibration sequences in an effort to recoverc:\apps\proman\test\<strong>GEM</strong> <strong>3000</strong>.doc Page 17 <strong>of</strong> 36
from a failure. If the sensor does not respond to the automatic two-point calibrations, thenthe appropriate error message will be printed on the calibration report, and the statusindication on screen turns red.There are three actions you may choose to take if these automatic calibrations fail to clearthe error: Continue to use the cartridge and report only the results from the working sensors. initiate a manual two-point calibration.NOTE: Because the instrument will automatically perform up to two one- or two-pointcalibrations after a calibration error has occurred, if you initiate a manual calibration, youmay significantly delay sensor recovery.• Contact Technical Support and replace the cartridge.Calibration InterruptionCalibrations can be interrupted to analyze samples in certain circumstances. If a sample isrun when the instrument is performing a calibration that cannot be interrupted, it willdisplay the message Calibration in progress for non-iQM cartridges or Process Control inprogress for iQM cartridges.The following calibrations cannot be interrupted to analyze a patient sample:• Two-point calibrations during the first four hours <strong>of</strong> cartridge life• Two-point calibrations after the first four hours <strong>of</strong> cartridge life if the three previoustwo-point calibrations were interrupted for sample analysis• Any low O 2 calibration• The first one-point calibration after sample analysisThe following calibrations cannot be interrupted to analyze a QC or CVP sample:• Any low O 2 calibration• Any two-point calibration• The first one-point calibration after sample analysisNOTE: Do not interrupt calibrations in progress unless it is absolutely necessary to analyze an urgent sample. Ifa calibration is interrupted, always allow the sample analysis to complete.Cartridge RemovalThe cartridge must be replaced when its use-life or sample capacity has been reached (see “3.2.4Cartridge Expiration”). A cartridge must also be replaced if the power has been <strong>of</strong>f for more than onehour or <strong>of</strong>f more than 20 minutes if blood has rested on the sensors or an “A” or low O 2 calibration is inprogress. The instrument displays Remove and discard the cartridge, as well as a reason for theremoval request.The instrument saves the data from 20 to 40 cartridges. After 40 cartridges have been inserted, theinstrument will prompt you to perform database maintenance. See “5.5.1 Copy Cartridge Data” forinformation about saving cartridge data.1. Slide the handle on the right side <strong>of</strong> the instrument toward the front <strong>of</strong> the instrument and open thedoor.2. Grasp the cartridge in the compartment, and pull it straight out.c:\apps\proman\test\<strong>GEM</strong> <strong>3000</strong>.doc Page 18 <strong>of</strong> 36
3. Dispose <strong>of</strong> cartridge in an appropriate biohazard container.4. Install a new cartridge when the instrument displays the Insert Cartridge screen. See “5.1 CartridgeInsertion and Warm-up.”Copy Cartridge DataYou can copy the data that the instrument has generated while a cartridge is in use whenever theinstrument is at the Ready screen, or between instrument acknowledgment <strong>of</strong> cartridge removal andinsertion <strong>of</strong> a new cartridge.One data diskette must be used per cartridge, even if the cartridge has processed only part <strong>of</strong> its fullcapacity.NOTE: If the disk already contains cartridge data, the instrument will give you the opportunity toreplace the disk or overwrite the data.5. Touch COPY CART. DATA on the DIAGNOSTICS menu.6. Select the cartridge to be copied by touching its entry in the listing.7. Touch COPY.8. Insert a blank, PC-formatted, high-density 3.5” diskette, with its label facing the front <strong>of</strong> theinstrument.9. Touch OK. When copying is complete, the instrument will display a message stating so.10. Remove the disk, and touch EXIT.11. Write-protect the disk by sliding the square tab on the back <strong>of</strong> the disk toward the edge to exposethe small hole.12. Label and store the disk in a safe place.Copy iQM DataYou can copy the iQM performance data stored by the instrument to a diskette with COPY iQM DATAon the DIAGNOSTICS menu. Copying iQM data does not remove it from the instrument. iQM datawill be removed from the instrument only when the data is older than 1 year. At that point, the datafrom the oldest month will be automatically deleted.1. Select COPY iQM DATA from the DIAGNOSTICS menu.2. Insert a blank, PC-formatted, high-density, 3.5" , with its label facing the front <strong>of</strong> the instrument.3. Touch OK. When copying is complete, the instrument will display a message stating so.4. Remove the disk, and touch EXIT.5. Write-protect the disk by sliding the square tab on the back <strong>of</strong> the disk toward the edge to exposethe small hole.6. Label and store the disk in a safe place.SPECIMEN1. Samples can be analyzed either from a heparinized (Li or balanced) syringe, capillary tube (220 uL), orampoule adapter.2. Arterial, venous or capillary blood anticoagulated with either Li heparin or modified heparins such ascalcium-balanced, zinc-balanced, or low amounts <strong>of</strong> dispersed heparin are the anticoagulants <strong>of</strong> choice.c:\apps\proman\test\<strong>GEM</strong> <strong>3000</strong>.doc Page 19 <strong>of</strong> 36
Ammonium heparin, EDTA, citrate or oxalate is not recommended for electrolyte or hematocritanalysis. Green top vacutainer tubes are acceptable for Na/K, Ionized Calcium, Glucose, %COHb, andbody fluid pH only. Grey top tubes are acceptable for lactate only.3. For hematocrit, whole blood is the only acceptable specimen.4. While storage <strong>of</strong> blood in plastic syringes on ice may produce an artificially high PO2 (see Ref 6),whole blood samples must be stored on ice if they cannot be delivered to the laboratory within 10-15mins. Once within the laboratory, ice storage is not necessary unless a delay is expected. When sendingsamples for blood gas analysis on the pneumatic tube system, storage <strong>of</strong> samples on ice is notrecommended.5. For ionized calcium specimens, the preferred specimen is at least 400 uL <strong>of</strong> whole bloodcollected anaerobically in a syringe that has no air bubbles, is at least 1/2 full and contains either aminimal amount <strong>of</strong> dry heparin or an electrolyte balanced heparin. If the sample cannot be analyzedwithin 1 hour, the syringe may be stored on ice for up to 4 hours.If the preferred anaerobic heparinized whole blood cannot be collected in a syringe, whole blood maybe collected in a red top or green top container, providing the vacutainer is filled with blood leavingminimal air space. A minimum volume <strong>of</strong> 1 mL is required. For green top tubes the heparinizedwholeblood may be aspirated directly.If a red top tube is received, process as follows:a. If not coagulated allow the blood to clot in the original closed container at room temperature for forup to 15 – 20 mins.b. Centrifuge the blood in the stoppered container.c. Remove serum with a plastic 1 ml tuberculin syringe and cap using a luer tip cap. Expel any airbubbles. Analyze the sample as soon as possible.d. Anaerobic plasma or serum is stable in stoppered containers at refrigerated (4 o C) for up to 72 hours.When to report the pH-corrected ionized calciumNormally, the pH-corrected ionized calcium result should not be reported, as it will likely causeconfusion in interpreting the ionized calcium result. However, pH-corrected ionized calcium issometimes useful and may be required in some situations.Use <strong>of</strong> the pH-corrected ionized calcium concentration is required when:1. The sample (serum or whole blood) has obviously been exposed to air for more than 15-30minutes. This is especially so for samples collected in standard vacutainer-type tubes. If the caphas been removed from a syringe containing whole blood collected with no air introduced intothe syringe, the ionized calcium will probably not be affected for a longer period, perhaps aslong as 60 min.2. A relatively small volume <strong>of</strong> sample has been collected in a tube or syringe with a large airspace also in the container.3. Whenever the sample has been frozen.The pH-corrected ionized calcium result may be useful when a properly-collected whole blood samplehas sat at room temperature for over an hour. Many times, the ionized calcium will change very littleunder this circumstance. However, a pH below 7.30 would indicate changes have occurred that mightsignificantly affect the ionized calcium result.c:\apps\proman\test\<strong>GEM</strong> <strong>3000</strong>.doc Page 20 <strong>of</strong> 36
Ionized calcium corrected to pH 7.4 should be reported as a footnote as follows:Ionized Calcium (7.4) = x.xx mmol/L reported due to specimen instability.6. For pH body fluids such as Blood, Pleural fluid, CSF, Thoracentesis fluid, Chestdrainage, etc:a. If the specimen appears to be free <strong>of</strong> clots and debris, no processing is necessarybefore analysis. If the specimen appears to have clots and debris, sample should becentrifuged using the Statspin centrifuge before analysis.PROCEDURESample VolumeThe syringe or capillary that is used must be filled nearly to capacity to prevent excessive heparinconcentration in the sample.Minimum sample requirements for the cartridge in use are as follows:<strong>GEM</strong> <strong>3000</strong> Sample Volume150uL145uL (capillary mode)135uL135uL<strong>IL</strong> 682 CO-OX Sample Volume65uLCartridge AnalytesBG/Hct/Lytes/Glu/LacBG/Hct/Lytes/Glu/LacBG/Hct/LytesBG/HctCO-OXCAUTION: All patient specimens should be treated as infectious. You should use personal protectiveequipment and techniques to avoid creating aerosols or contaminating yourself.1. Obtain a properly collected sample (Syringe or Vacutainer Sampling (240 ul))2. Expel any air bubbles. Mix the sample for 30 seconds by rolling the syringe in the palm <strong>of</strong> thehands for 15 seconds, then reverse the syringe and mix an additional 15 seconds using the sametechnique. Check for clots.3. Check for the presence <strong>of</strong> clots: remove the cap, and expel a drop or two <strong>of</strong> the sample onto a gauzepad. If clots are suspected, obtain another sample.4. Select analytes or panels to be tested by touching the panel or analyte on the ready screen. A checkmark will appear in the analyte box on the Ready screen. To deselect analytes, touch the analytebox again to remove the check mark.5. Specify the sample type by touching ARTERIAL, VENOUS, CAP<strong>IL</strong>LARY, or OTHER at theReady screen.6. Touch OK after you have entered all patient information and user-entered analytes.7. Analyze the sampe immediately. position the sample so that the sampler is near, but not touching,the bottom <strong>of</strong> the syringe plunger. For a capillary sample, attach the capillary tube or capillary andadapter to the sampler. Then touch OK.c:\apps\proman\test\<strong>GEM</strong> <strong>3000</strong>.doc Page 21 <strong>of</strong> 36
8. Remove the syringe, capillary tube, or capillary and adapter from the sampler when the instrumentbeeps four times and prompts you to do so.9. CAUTION: <strong>Care</strong> should be taken to remove the sample quickly so as not to bend the sampler.10. If the sample analysis includes CO-Ox analytes, the instrument will prompt for introduction <strong>of</strong> theCO-Ox sample. Touch OK, and introduce the sample to the CO-Oximeter and press sample.11. Dispose <strong>of</strong> sample in a biohazard waste container.12. The instrument will take 85 seconds to process the sample and display results. During this time, aprogress indicator will be displayed. The Patient Information screen will also be displayed toprompt for entry <strong>of</strong> sample information.13. Enter or scan in the Pathnet accession number in the Patient ID and Accession number fields fromthe Pathnet label.14. After results have printed, the data is transmitted to Impact and Pathnet.15. At the Cerner terminal type C to log on and type username and password.NOTE: EACH EMPLOYEE MUST USE THEIR OWN USERNAME AND PASSWORD.FA<strong>IL</strong>URE TO DO SO W<strong>IL</strong>L RESULT IN DISCIPLINARY ACTION.16. Enter TSA at the select prompt and press RETURN.17. Enter 350 for the Workcenter (WC) and <strong>Testing</strong> Site number (TS) and press RETURN.18. At ACC # prompt, press RETURN to enter the Julian date <strong>of</strong> the accession number. Enter thelast four digits <strong>of</strong> the accession number and press RETURN.19. All patient results performed by the analyzer and successfully transmitted across the interfacewill be displayed. If the cursor stops at a line, then PathNet requests an answer to this field.Enter the results <strong>of</strong> each requested field.QNS (Quantity Not Sufficient) AND TD(Technical difficulty) SAMPLES:Press the Convert to Alpha Key (F12) and type in QNS or TD in the appropriate field. On thekeybroad list expedite key codes that may be used to enter the listed codes as comments.ENTERING FIO2 VALUES: FIO2 values are entered in Pathnet as a percentage. FIO2%values expressed in liters/min can be converted to FIO% by using the table below. If no valuesor given for either FIO2 or liters then enter an asterisk in the FIO2 field. To do this you mustpress the F12 (convert to alpha) key, then check for any footnotes already present. In manycases the FIO2 listed in liters will be displayed as an order level footnote.Conversion <strong>of</strong> Liters <strong>of</strong> Oxygen to FIO 2 %Liters/min FIO 2 %1.0 241.5 262.0 282.5 303.0 32c:\apps\proman\test\<strong>GEM</strong> <strong>3000</strong>.doc Page 22 <strong>of</strong> 36
3.5 344.0 364.5 385.0 405.5 426.0 4420. Footnotes can be entered at this time if necessary.Note: Footnotes should be entered only on parameters which cross to DHIS.Parameters that do not cross to DHIS are pH ins and analyzer #. All alertresults should be footnoted with time, date, and initials <strong>of</strong> person towhom results were given.ENTERING FOOTNOTESTo enter footnote return to the line with the alert parameter. Press the F11(Footnote Key).If there are any existing comments on the patient, Pathnet will <strong>of</strong>fer to display them.Comments should be checked for important patient information. After viewing footnotes,press the (F8) "Home" key to restore the screen. Press the F11 key until you see the display"enter footnote after entering result". Enter correct result and press "Return". A windowwill open up. All footnotes to be placed on the patient's chart are to be entered above theline. Footnotes for lab use only should be entered below the line. Press the "Home" key toclose the window and save the footnoteNOTE: When results are outside <strong>of</strong> the reportable limits, footnote using theappropriate expedite key.21. “Results correct (Y/N/R/D)" is displayed. Press Y if results are correct, N ifresults are not correct and you wish to change them, R if result was changed thatis a component <strong>of</strong> a calculation, or D to enter dilution factor.22. When Y is pressed, the system prompts for the lines to be verified. After theselines are entered, "Ver/Perf info correct?" is displayed. Pressing Y verifies theresults and sends them to DHIS. "Results posting-please wait" is displayed bythe system. Pressing N allows changes to be made in the lines verified orperformed.ENTERING RESULTS ON THE SAME SAMPLE WITH DIFFERENTACCESSION NUMBERS:23. Run sample and transmit data across interface <strong>of</strong> one accession number. Manually input datafor the other accession numbers, Or change ID # to other acc # on the analyzer andretransmit. Then follow steps k-p if necessary.24. Exit TSA by pressing PF3.25. Exit PathNet by typing Q.Interference/Micro Clot CheckingFlagging <strong>of</strong> Patient Results Off (Default Setting)If the <strong>GEM</strong> Premier <strong>3000</strong> has not been configured to flag patient results when interferenceor micro clots are detected, then the instrument will begin the interference/micro clot checkafter the Patient Sample Results screen is displayed. Affected analytes will not be flagged inthe displayed or printed patient results.c:\apps\proman\test\<strong>GEM</strong> <strong>3000</strong>.doc Page 23 <strong>of</strong> 36
Reporting <strong>of</strong> Results If a micro clot is detected, the instrument will beep three times, display a message,and initiate a clot removal cycle. cartridges, the instrument will automatically check for micro clots again. If a clot isfound, then the sensor will be disabled and given “iQM error” status. for non-iQM cartridges, the instrument will display a message recommending thatan external QC be run to verify cartridge performance. If an interference is detected, the instrument will beep three times, display amessage, and rinse the sensors. This happens for both iQM and non-iQM cartridges.The message will remain displayed until acknowledged by the operator.For more information about setting the interference/micro clot option, see “Flag PatientResults for Interference and Micro Clots” on page 3.33.The Patient Sample Results screen is displayed after: patient results are ready, and you have touched EXIT at the Patient Information screen (if that screen was presented), and interference/micro clot determination, if enabled, has been completed.The Patient Sample Results screen will be displayed for 90 seconds. After 90 seconds, If Patient Sample Auto-Accept is ON, the sample will be given a disposition <strong>of</strong> ACCEPTED. If Patient Sample Auto-Accept is OFF, the sample will keep whatever disposition you haveassigned it. If no disposition has been set, it will be given a disposition <strong>of</strong> PENDING.The instrument returns to the Ready screen. Patient results are automatically downloaded into on-boardcomputer memory for future review and documentation.Correction Factor for Ionized CalciumTo improve agreement between the <strong>IL</strong> <strong>GEM</strong>S and Radiometer blood gas analyzers in CPED Lab, we added acorrection factor <strong>of</strong> 0.03 mg/dL for Ionized Calcium to all instruments on September 15, 2009.Temperature Corrections1. Temperature corrections can be performed in the IMPACT Data Management System.2. Bring up IMPACT CRITICAL CARE on the desk top if it is not already up.3. Type in your ID and PASSWORD. Click on X at the QC Message Reminder4. Click on the Black Arrow back button located in the right hand corner <strong>of</strong> the Patient Sample Resultscreen.5. Click on Sample in the upper left hand corner and scroll down to select Edit.6. Use the Patient HISTORY NUMBER to search for PT. ID. Then click on SEARCH.7. Choose the sample that needs to be corrected by double clicking on it.8. On the Patient Sample Result Screen, type in the correct temperature.9. Click on the SAVE icon (disc on the right side <strong>of</strong> the screen).10. Changes are not saved. Do you want to save now? Answer save.11. No order associated with this sample. Would you like to send it? Answer yes. If results have not beenverified, only the pH will be transmitted to Pathnet. The pCO2 and pO2 results must be entered usingECR. If the results have been verified, all results must be entered using ECR.c:\apps\proman\test\<strong>GEM</strong> <strong>3000</strong>.doc Page 24 <strong>of</strong> 36
12. Click on the Black Arrow back button located in the right hand corner <strong>of</strong> the screen.13. Minimize the screen to log on to Pathnet. Use ECR to enter necessary results.Instrument Interface SettingSee configuration/interface set-up on the <strong>GEM</strong> <strong>3000</strong>. Settings are also listed on a spread sheetposted on the cabinet above the Senior’s desk.Analyte Reportable RangesMeasured Analytes Reportable RangespH 6.80 to 7.80pCO 2pO 2Na +K +Ca ++5 to 150 mmHg0 to 760 mmHg100 to 200 mmol/L1.0 to 20.0 mmol/L0.10 to 4.00 mmol/LGlucose20 to 500 mg/dLLactate0.3 to 15 mmol/LHct 15 to 65%CALCULATIONSCAUTION: A DASH (-) on the display or print-out appears when there is an error in the calculation <strong>of</strong>the derived parameter.Derived Analytes-HCO 3HCO - 3 stdTCO 2BE(ecf)BE(B)Reportable RangesSO 2 c 0 to 100%3.0 to 60.0 mmol/L3.0 to 60.0 mmol/L3.0 to 60.0 mmol/L-30.0 to +30.0 mmol/L-30.0 to +30.0 mmol/LAll calculations are done automatically on the <strong>GEM</strong> <strong>3000</strong>Limitations and InterferencesLimitationsLimitationDescriptionContamination with Room Air Especially samples having a very low or high pO 2content. Similarly, pCO 2 may be affected andsubsequently pH and Ca ++ results as well.Metabolic ChangesErrors can occur due to metabolic changes if there isa delay in the measurement <strong>of</strong> the samples.c:\apps\proman\test\<strong>GEM</strong> <strong>3000</strong>.doc Page 25 <strong>of</strong> 36
LimitationElevated White Blood Cells orReticulocyte CountsImproper MixingChanges to Manufacturer’sInstructions or Method VerificationProtocolsImproper InstallationUnder-Heparinized SampleDescriptionSamples will deteriorate more rapidly, even whenkept in ice water.Errors will be introduced if the sample is notproperly mixed prior to measurement.Data obtained data may be compromised.The instrument must be installed per themanufacturer’s instructions. Prior to initiating anymethod evaluation protocol, acceptable cartridgeperformance must be demonstrated by acceptablecalibration (no slope or drift errors) and all levels <strong>of</strong>QC solutions within acceptable ranges for non-iQMcartridges; all levels <strong>of</strong> CVP must be run and withinacceptable ranges for iQM cartridges.Blood clot can form in the sensor chamber causingvarious sensor failures if sample is not properlyheparinized.InterferencesThe following substances can potentially interfere with sample analysis: Severely abnormal plasma osmolarities or abnormal levels <strong>of</strong> proteins or lipids. Hematocrit values produced by the <strong>GEM</strong> Premier <strong>3000</strong> may differ significantly from the valuesproduced by a cell counter. In general, abnormally high protein or lipid values may cause higherhematocrit values, and vice-versa. Benzalkonium Chloride (see Note 1, next section): Arterial lines and sampling devices coatedwith Benzalkonium Chloride cause falsely elevated sodium and ionized calcium readings. Benzalkonium Heparin (see Note 1, next section): Arterial lines and sampling devices coatedwith Benzalkonium Heparin cause falsely elevated sodium and ionized calcium readings. Thiopental sodium (see Note 2, next section): May interfere with the sodium, potassium, pCO 2and ionized calcium readings (see Note 3, next section). The anesthetic halothane may produce unreliable pO 2 results due to interferences with pO 2sensor. Ethylene glycol and its metabolite glycolic acid can show a severe interference to lactatemeasurement. The following compounds did not show noticeable interference with glucose and lactatedeterminations at the tested level:Compound Test Level High “Normal” Level 1Ascorbic acid (vitamin C) 3 mg/dL 2 mg/dLc:\apps\proman\test\<strong>GEM</strong> <strong>3000</strong>.doc Page 26 <strong>of</strong> 36
Interference NotesCompound Test Level High “Normal” Level 1Uric acid 20 mg/dL 7 mg/dLDopamine 2 mg/dL 0.03 mg/dLDobutamine 2 mg/dL 0.03 mg/dLThe following tested drugs may interfere with glucose or lactate determination,causing falsely low readings:Drug Interference Observed High “Normal” Level 2Flaxedil 2 mg/dL 1.4 mg/dLEthanol 350 mg/dL 100 mg/dL (toxic)• The following tested drugs may interfere with glucose and lactate determinations, causingfalsely elevated readings:DrugInterference Maximum TherapeuticObservedLevel 2Acetaminophen (Tylenol) 15 mg/dL 2 mg/dLIsoniazide (Nydrazid) 2 mg/dL 0.7 mg/dL (toxic)Thiocyanate 10 mg/dL 2.9 mg/dLHydroxyurea 0.5 mg/dL 2 mg/dL• The following tested anticoagulants may interfere with glucose and lactate determinations,causing falsely low readings:Anticoagulant Positive Interference 2Sodium fluoride1 g/dLPotassium oxalate1 g/dLBoth iQM and non-iQM cartridges employ Failure Pattern Recognition (FPR) checks. One<strong>of</strong> the FPR checks that the <strong>GEM</strong> Premier <strong>3000</strong> recognizes is for the positively chargedlipophilic compound Benzalkonium. Following sample analysis, and analysis <strong>of</strong> ProcessControl Solution B, if Benzalkonium Chloride or Benzalkonium Heparin patterns aredetected, the following message will be displayed on the analyzer:Sensor Interference Detected for Na and iCa on last sample likely due toBenzalkoniumThe <strong>GEM</strong> Premier <strong>3000</strong> <strong>of</strong>fers the operator the ability to enable flagging <strong>of</strong> patientresults if an interference pattern is detected. In addition, this option, when enabled,delays the reporting <strong>of</strong> results until Process Control Solution B is evaluated forinterference patterns, following sample analysis. If flagging <strong>of</strong> patient results for aninterference is enabled (see page 3.33), the following message (plus progress bar) willbe presented while the post analysis Process Control Solution B check is underway:Checking for presence <strong>of</strong> interference and micro clotsThis message will remain displayed until the Process Control Solution B, analysis iscomplete. If an interfering substance pattern is detected, the affected blood result(s)c:\apps\proman\test\<strong>GEM</strong> <strong>3000</strong>.doc Page 27 <strong>of</strong> 36
will be flagged. In addition, the analyzer will beep three times to alert the operator.The following message disappears only after operator acknowledgment:Sensor Interference Detected for Na and iCa on last sample likely due toBenzalkonium14. Another FPR check that the <strong>GEM</strong> Premier <strong>3000</strong> recognizes is for negatively chargedlipophilic compounds, such as Thiopental Sodium. Thiopental Sodium is also knownby other names, including: thiomebumal sodium, penthiobarbital sodium, thiopentonesodium, thionembutatal, pentothal sodium, nesdonal sodium, intraval sodium,traoanal, and thiothal sodium.Following sample analysis and analysis <strong>of</strong> Process Control Solution B, if theassociated pattern is detected in Process Control Solution B, the following messagewill be displayed on the analyzer:Sensor Interference Detected for xxxxx on last sample (where xxxx is the analyte oranalytes affected)The <strong>GEM</strong> Premier <strong>3000</strong> <strong>of</strong>fers the operator the ability to enable flagging <strong>of</strong> patientresults if an interference pattern is detected. In addition, this option, when enabled,delays the reporting <strong>of</strong> results until Process Control Solution B is evaluated forinterference patterns. If flagging <strong>of</strong> patient results for an interference is enabled (seepage 3.33), the following message (plus progress bar) will be presented while the postanalysis Process Control Solution B check is underway:Checking for presence <strong>of</strong> interference and micro clotsThis message will remain displayed until the Process Control Solution B analysis iscomplete. If the associated pattern is detected, the affected blood result(s) will beflagged. In addition, the analyzer will beep three times to alert the operator. Thefollowing message disappears only after operator acknowledgment:Sensor Interference Detected for xxxxx on last sample (where xxxx is the analyte oranalytes affected)NOTES AND PRECAUTIONS1. Samples must be free <strong>of</strong> air bubbles.2. Samples must be mixed for 30 seconds.3. Samples must be free <strong>of</strong> clots.4. Sample must be analyzed within 20 minutes after it is drawn.5. An elevated potassium should be checked for hemolysis.6. Samples containing air bubbles that are sent by pneumatic transport can have an altered PO 2 . Seereference 9. Footnote results if air bubbles were present in the sample when received.7. PH may be measured on body fluids by the <strong>GEM</strong> <strong>3000</strong> analyzers and reported. The Blood GasLaboratory subscribes to the CAP Body Fluid Survey that includes pH.PRECISIONData from whole blood sample.PH PCO2 PO2 NA K CA GLU LAC HCTMean 7.161 66.3 80.9 144.6 4.24 1.109 85.3 7.68 31.7c:\apps\proman\test\<strong>GEM</strong> <strong>3000</strong>.doc Page 28 <strong>of</strong> 36
SD .007 1.033 1.356 1.404 0.063 .022 2.289 .086 0.458CV .104 1.559 1.677 0.971 1.492 1.954 2.682 1.122 1.442N 15 15 15 15 15 15 15 15 15REFERENCE INTERVALSArterial Venous CapillarypH 7.35 - 7.45 units 7.32 - 7.42 unitsPCO2 35 - 45 mm Hg 39 - 55 mm HgPO2 75 - 100 mm Hg 30 - 55 mm Hg 60-76 mmHgNa 135 - 145 mmol/LK3.2 - 4.8 mmol/LHCT 0.39 - 0.49 Male0.35 - 0.45 FemaleHCO3 20 - 28 mmol/LTCO2 21 - 30 mmol/LBEb -3.0 - 3.0 mmol/LGluc 70 – 140 mg/dLLac 0.5 – 1.6 mmol/L 0.5 – 2.2 mmol/LICa 1.15 – 1.32 mmol/LALERT VALUESArterialVenousBelow Above Below AbovePH 7.25 7.60 7.33 7.58PCO2 25 mmHg 65 mmHg 28 mmHg 65 mmHgPO2 50 mm Hg - - -Na 120 mmol/L 155 mmol/L - -K 2.8 mmol/L 6.0 mmol/L - -HCT 0.15 - - -THb 5.0 g/dL - - -Gluc 50 mmol/L 350 mmol/L - -Lactate - 5.0 mmol/L - 5.0 mmol/L%O2Hb 85 % - - -TCO2 6.0 mmol/L - - -CA 0.87 mmol/L 1.41 mmol/L - -CLINICAL SIGNIFICANCEBlood GasespHArterial pH indicates whether the acid-base status is acidemic, alkalemic, or normal.pCO2c:\apps\proman\test\<strong>GEM</strong> <strong>3000</strong>.doc Page 29 <strong>of</strong> 36
pCO2 represents the balance between cellular production <strong>of</strong> CO2 and ventilatory removal <strong>of</strong> CO2. It is sensitiveindicator <strong>of</strong> hyperventilation or ventilatory failure.pO2Arterial pO2 indicates the oxygenation status, which is usually related to the ability <strong>of</strong> the lungs to oxygenateblood. pO2 measurements are used as a guide for initiating and/or monitoring oxygen therapy and/or ventilatoryassistance.SODIUM/POTASSIUMSodium is the major cation <strong>of</strong> extracellular fluid and is a major factor in regulating both the osmolality andvolume <strong>of</strong> blood. Hormones such as aldosterone and ADH, and intake <strong>of</strong> water and salt have important effectsin determining the sodium concentration <strong>of</strong> blood.Causes <strong>of</strong> Hyponatremia:1. Inappropriate ADH secretion2. CHF or cirrhosis3. Decreased secretion <strong>of</strong> aldosterone (as in Addison's disease) causing decreasedreabsorption.4. Diarrhea or vomiting with hypotonic fluid replacement.5. Renal diseases: Nephrotic Syndrome, acute or chronic renal failure.6. PolydipsiaCauses <strong>of</strong> Hypernatremia:1. Defect in ADH production, secretion, or response.2. Dehydration from inadequate fluid replacement.3. Brain injury causing loss <strong>of</strong> thirst.4. Diabetic coma after therapy with insulin5. Excess treatment with sodium saltsPotassium is the major intracellular cation. It is important in neuromuscular excitability, cardiac rhythm, andacid-base balance.Causes <strong>of</strong> Hypokalemia:1. Thiazide diuretics, furosemide: increased urine flow2. Hyperaldosteronism (causes decreased reabsorption in the proximal tubules)3. Alkalosis - K+ movement into cell is matched by movement <strong>of</strong> H+ from the cell4. HypomagnesemiaCauses <strong>of</strong> Hyperkalemia:1 Excess Dietary intake in patients with renal disease.2. Insulin deficiency3. Renal Failure4. Aldosterone deficiency5. Oliguria, anuria, or uninary obstruction.6. Artifacts <strong>of</strong> improper collection: hemolysis, ice storage.IONIZED CALCIUMIonized calcium is the form <strong>of</strong> calcium that is physiologically active. Approximately 50% <strong>of</strong> the total circulatingcalcium is ionized. Low calcium causes increased neuromuscular irritability, which can lead to tetany andc:\apps\proman\test\<strong>GEM</strong> <strong>3000</strong>.doc Page 30 <strong>of</strong> 36
convulsions. High calciums may cause nausea, vomiting, abdominal pain, and polyuria, stone formation in thebladder and urethra, and abnormal calcification <strong>of</strong> other tissues.Causes <strong>of</strong> Hypocalcemia:1. Hypomagnesemia2. Vitamin D deficiency3. Hypoparathyroidism4. Pancreatitis5. Pregnancy and lactation6. Renal Diseases7. OsteomalaciaCauses <strong>of</strong> Hypercalcemia:1. Hyperparathyroidism2. Neoplasms, especially <strong>of</strong> bone3. Hypervitaminosis D4. Milk-alkali syndrome5. Sarcoidosis6. ThyrotoxicosisHEMATOCRITThe hematocrit <strong>of</strong> a sample <strong>of</strong> blood is the ratio <strong>of</strong> the volume <strong>of</strong> erythrocytes to that <strong>of</strong> whole blood. A majoruse <strong>of</strong> hematocrit measurements is during and after major surgery, especially with cardiac bypass. Thehematocrit must be sufficiently high (usually > 20 %) to remove a patient from bypass. Anemias and hemolyticdiseases result in a decreased hematocrit. An increase is seen in a relative polycythemia and sometimes absolutepolycythemia.CO-OXIMETRYWhen hemoglobin is less than normal, the patient is anemic; when it is higher than normal, the patient may havepolycythemia or erythrocytosis, a higher than normal concentration <strong>of</strong> erythrocytes in the blood.Because a decrease in arterial oxygen saturation is physiologically abnormal and a saturation below 85% may belife threatening, such results should be reported immediately. This usually indicates severe pulmonary orcardiovascular disease. Chronic pulmonary disease is most common and can develop over a period <strong>of</strong> time.Cardiovascular disease is <strong>of</strong> a more urgent nature as this indicates severe heart failure or perfusion failure.Cyanosis and apparent bluish discoloration <strong>of</strong> the skin, lips, eyelids, and nail beds will be apparent to most whenthere are more than 5 g/ dL <strong>of</strong> reduced (deoxyhemoglobin) hemoglobin. Anemic patients will not usually showcyanosis. A patient with a high hemoglobin such as in erythrocytosis will more likely show cyanosis. A cyanoticpatient should be investigated immediately for possible pulmonary and cardiovascular causes.Carbon monoxide is present in smoke and automotive exhaust. City dwellers that are nonsmokers typicallyhave carboxyhemoglobin values <strong>of</strong> less than three percent <strong>of</strong> the blood hemoglobin combined with carbonmonoxide.Methemoglobin (ferri-hemoglobin) is a derivative <strong>of</strong> hemoglobin in which the ferrousion is oxidized to the ferric state. It is an "inactive" hemoglobin, it does not combine reversibly with oxygen orcarbon monoxide. In addition, it shifts the oxygen dissociation curve and hinders the transfer <strong>of</strong> oxygen from theblood to the tissues.c:\apps\proman\test\<strong>GEM</strong> <strong>3000</strong>.doc Page 31 <strong>of</strong> 36
GLUCOSEIn the fasting state the level <strong>of</strong> blood glucose is maintained by drawing upon the glycogen stores <strong>of</strong> the liver. Asglucose levels usually increase following absorption <strong>of</strong> carbohydrates from the diet, glycogenolysis (glycogen toglucose) is replaced by glycogenesis (glucose to glycogen). A number <strong>of</strong> different hormones are important inregulating the levels <strong>of</strong> blood glucose and for this reason glucose levels are altered in different diseases. Tightregulation <strong>of</strong> blood glucose levels has taken on a far greater importance over the last few years.Hypoglycemia is seen in:1. Hyperinsulinisma. Islet cell tumorb. Non-pancreatic insulin secreting tumors2. Early stage <strong>of</strong> Diabetes Mellitus3. Hepatic diseasesa. Reyes syndromeb. Hepatitis4. Malnutrition5. Pediatric anomaliesa. Prematurityb. Infant <strong>of</strong> diabetic mother6. Addisons diseaseHyperglycemia is seen in:1. Diabetes Mellitus2. Hemochromatosis3. Cushing's syndrome4. Pheochromocytoma5. Stress (emotional, burns, shock)6. Acute pancreatitis7. ACTH (adrenocorticotropic hormone) administration8. Acromegaly (a condition caused by hypersecretion <strong>of</strong> the pituitary growth hormone after maturity.LactateLactate is an intermediary product <strong>of</strong> carbohydrate metabolism, normally produced in the L-formIn healthy, resting individuals, approximately 1400 mmols <strong>of</strong> lactate are produced daily from pyruvate whichresults in a blood lactate level <strong>of</strong>
lood loss, (2) cardiogenic shock due to decreased cardiac output from a variety <strong>of</strong> causes, (3) septic shockcharacterized by both “shunting” <strong>of</strong> blood from the arterial to the venous circulation. It is important to detectany <strong>of</strong> these shocks states early, so that therapy may be most effective. Appropriate therapy includes any <strong>of</strong> thefollowing: fluid replacement, cardiotropic agents, vasoactive agents, and appropriate antibiotics in the casesepsis.The less common Type B causes are those where there is no overt evidence <strong>of</strong> hypoxia. In these cases themechanism may be impaired tissue oxygen utilization. Caused by drugs and toxins such as ethanol, methanoland phenformin; predisposing diseases such as respiratory alkalosis and diabetes mellitus, liver failure andsepsis; inborn or congenital errors in carbohydrate metabolism.Dextro or D-lactic acidosis can occur when there is overgrowth <strong>of</strong> certain bacteria in a gut which has beenshortened through surgery. The bacteria produce excessive quantities <strong>of</strong> D-lactate.P50P50 may be used as an indicator <strong>of</strong> shifts in the oxyhemoglobin dissociation curve. It may be an importantparameter for providing valuable information relative to the oxygen carrying or more important, oxygendelivering capacity <strong>of</strong> the blood.Increase values for P50 indicate displacement <strong>of</strong> the oxygen dissociation curve to the right (i.e. a decreasedaffinity <strong>of</strong> the hemoglobin for oxygen). Chief causes are hyperthermia, acidemia, hypercapnia, highconcentrations <strong>of</strong> DPG, or the presence <strong>of</strong> an abnormal hemoglobin with decreased oxygen affinity. Low valuesfor P50 signify displacement <strong>of</strong> the oxygen dissociation curve to the left ( i.e. increased affinity <strong>of</strong> hemoglobin).The main causes are hypothermia, acute alkalemia, hypocapnia, low concentration <strong>of</strong> DPG, or an abnormalhemoglobin.Effects <strong>of</strong>:1. Temperature - an increase <strong>of</strong> 10 o C increases the P50 by a factor <strong>of</strong> 1.7, thusindicating a decrease in affinity <strong>of</strong> hemoglobin for O2 as temperature increases.2. pH - Hydrogen ion activity affects the dissociation curve because hemoglobin isa buffer and HbO2 is a stronger acid than Hb. Increased pH tends to force O2<strong>of</strong>f the hemoglobin. A decrease in pH shifts the curve to the right and increasesthe P50. An increase in pH shifts the curve to the left.3. CO2 - minor effect.4. Hemoglobin - minor effect.5. 2,3-DPG (2,3-diphosphoglycerate) is a small organic phosphate molecule. Itis produced as a late intermediate in glycolysis, a by product <strong>of</strong> anaerobicmetabolism. It is a highly charged anion that binds reversibly, mole for moleto deoxygenated hemoglobin but not to oxygenated hemoglobin. An increasein 2,3-DPG causes a shift to the right <strong>of</strong> the O2 dissociation curve and adecrease in 2,3-DPG causes a shift to the left.6. Carbon Monoxide - CO combines reversibly with hemoglobin but about 210times stronger than oxygen. As a result, carbon monoxide is not readilydisplaced from hemoglobin (except at high oxygen tensions). Initially, thecurve shifts to the left until all the hemoglobin that does not hold carbonmonoxide holds oxygen. At that point, a drastic shift to the right occurs,because <strong>of</strong> a decreased oxygen affinity <strong>of</strong> that hemoglobin bound to carbonmonoxide.7. Salts - In general, an increase in ionic strength increases P50. An increase inc:\apps\proman\test\<strong>GEM</strong> <strong>3000</strong>.doc Page 33 <strong>of</strong> 36
salts causes a shift to the right and a decrease causes a shift to the left.8. Methemoglobin - Normally it is not a significant factor. It must beremembered that its presence will cause a shift to the left and a decreased P50.Percutaneous Radial Artery CannulationSeveral peripheral arteries are available for percutaneous cannulation, but radial artery pressure monitoring ismost common in anesthesia and critical care. It is technically easy to perform and rarely associated withcomplications, owing to good collateral circulation <strong>of</strong> the hand. [81] Slog<strong>of</strong>f et al [82] described 1,700cardiovascular surgical patients who underwent radial artery cannulation without ischemic complications,despite evidence <strong>of</strong> radial artery occlusion after decannulation in more than 25 percent <strong>of</strong> patients. Seriouscomplications after radial artery cannulation are extremely rare in the absence <strong>of</strong> contributing factors, such aspreexisting vasospastic arterial disease, previous arterial injury, protracted shock, high-dose vasopressoradministration, prolonged cannulation, or infection. [83] [84] Like any procedural skill, percutaneous arterialcannulation is best learned by observing and emulating the methods <strong>of</strong> more experienced pr<strong>of</strong>essionals. Fromthe various elements <strong>of</strong> this collected array <strong>of</strong> techniques, the clinician should settle on a method that producesgreatest overall personal success.Before attempting radial artery cannulation, many clinicians assess the adequacy <strong>of</strong> collateral flow to the handby performing a modified Allen test. This bedside examination, originally described by E.V. Allen in 1929, [85]provided a technique to assess arterial stenosis in the hands <strong>of</strong> patients with thromboangiitis obliterans. Toperform the Allen test, the examiner compresses the radial and ulnar arteries and asks the patient to make a tightfist to exsanguinate the palm. As the ulnar occlusion is released, the color <strong>of</strong> the open palm is observed.Normally the palm will have a striking flush in several seconds; severely reduced ulnar collateral flow is presentwhen the palm remains pale for more than 10 seconds.Although the Allen test is meant to identify patients at high risk for ischemic complications from radial arterycatheterization, the predictive value <strong>of</strong> this test has been questioned. Many reports reviewing permanentischemic sequelae noted normal Allen tests prior to catheterization. [83] [86] [87] [88] In contrast, numerous radial[82] [89] [90]cannulations performed despite abnormal Allen test results have not produced ischemic complications.Allen tests <strong>of</strong> radial artery patency bore no relationship to distal blood flow assessment by fluorescein dyeinjection [91] or photoplethysmography. [92] Although it is obviously <strong>of</strong> great importance that the clinicianminimize the chances <strong>of</strong> significant distal ischemia from arterial pressure monitoring, it appears that the Allentest cannot be relied on to predict this adverse outcome.c:\apps\proman\test\<strong>GEM</strong> <strong>3000</strong>.doc Page 34 <strong>of</strong> 36
Figure 70-1 Allen test for patency <strong>of</strong> radial and ulnar arteries. A, Patient elevates hand and makesfist while examiner occludes both radial and ulnar arteries. B, Patient extendsfingers, and blanching<strong>of</strong> hand is seen. C, Radial artery alone is released, and color <strong>of</strong> hand returns to normal. D, Inthrombosis <strong>of</strong> ulnar artery, test is positive (hand remains blanched) when this artery alone isreleased.c:\apps\proman\test\<strong>GEM</strong> <strong>3000</strong>.doc Page 35 <strong>of</strong> 36
REFERENCES1. Textbook <strong>of</strong> Clinical Chemistry, Tietz, 1986. pages 1191-12532. T<strong>of</strong>faletti J, Understanding the Clinical uses <strong>of</strong> Blood Gases and Electrolytes, AACC Press, 1993.3. <strong>IL</strong> <strong>GEM</strong> Premier <strong>3000</strong> Operators Manual Rev 5, October 2003.<strong>IL</strong> 682 Co-Oximeter System Operators Manual Rev 5, November 2003.4. T<strong>of</strong>faletti J. Special Topics in Diagnostic <strong>Testing</strong>: Blood Gases and Electrolytes, 2 nd ed. AACC Press,2009.5. Mixed Acid Base Disorders, Clin Chem 1985; 31: 321-325.6. Changes in O2 measurements when whole blood is stored in iced plastic on glasssyringes. Clin Chem 1991; 37: 1244-1248.7. Rose BD, Clinical Physiology <strong>of</strong> Acid-Base and Electrolyte Disorders, 3 rd Edition. McGraw Hill, 1989.8. Shapiro BA, etal. Clinical Application <strong>of</strong> Blood Gases, 4th Ed. Mosby-Yearbook,1989.9. Astles JR, lubarsky D, Loun B, Sedor F, T<strong>of</strong>faletti J. Pneumatic transport exacerbatesinterference, <strong>of</strong> room air contamination in blood gas samples. Arch Pathol Lab Med1996; 120: 642 – 647.10. T<strong>of</strong>faletti J. Elevation in blood lactate: overview <strong>of</strong> use in critical care. Second J. Clin LabInvest 1996; 56, suppl 224: 107-110.11. T<strong>of</strong>faletti J, Hansell D, Interpretation <strong>of</strong> blood lactate measurements in pediatric open-heartsurgery and in extracorporeal membrane oxygenation. Scand J Clin Lab Invest 1995; 55: 301-7c:\apps\proman\test\<strong>GEM</strong> <strong>3000</strong>.doc Page 36 <strong>of</strong> 36