BSL PRO 3.7.7 BSL PRO TUTORIAL - Biopac
BSL PRO 3.7.7 BSL PRO TUTORIAL - Biopac
BSL PRO 3.7.7 BSL PRO TUTORIAL - Biopac

Create successful ePaper yourself
Turn your PDF publications into a flip-book with our unique Google optimized e-Paper software.
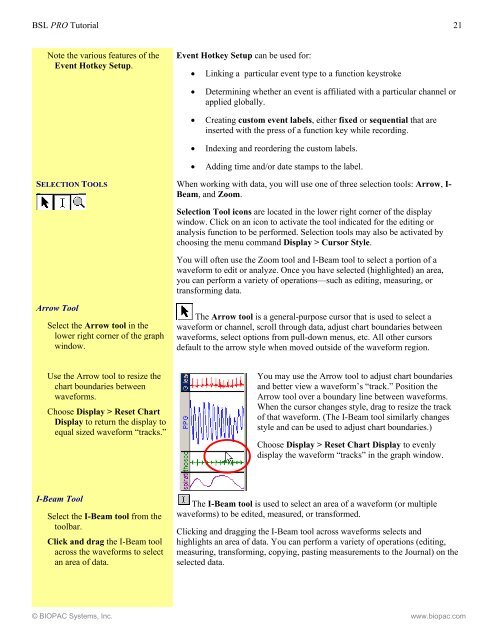
<strong>BSL</strong> <strong>PRO</strong> Tutorial 21Note the various features of theEvent Hotkey Setup.Event Hotkey Setup can be used for:Linking a particular event type to a function keystrokeDetermining whether an event is affiliated with a particular channel orapplied globally.Creating custom event labels, either fixed or sequential that areinserted with the press of a function key while recording.Indexing and reordering the custom labels.Adding time and/or date stamps to the label.SELECTION TOOLS When working with data, you will use one of three selection tools: Arrow, I-Beam, and Zoom.Selection Tool icons are located in the lower right corner of the displaywindow. Click on an icon to activate the tool indicated for the editing oranalysis function to be performed. Selection tools may also be activated bychoosing the menu command Display > Cursor Style.You will often use the Zoom tool and I-Beam tool to select a portion of awaveform to edit or analyze. Once you have selected (highlighted) an area,you can perform a variety of operations—such as editing, measuring, ortransforming data.Arrow ToolSelect the Arrow tool in thelower right corner of the graphwindow.The Arrow tool is a general-purpose cursor that is used to select awaveform or channel, scroll through data, adjust chart boundaries betweenwaveforms, select options from pull-down menus, etc. All other cursorsdefault to the arrow style when moved outside of the waveform region.Use the Arrow tool to resize thechart boundaries betweenwaveforms.Choose Display > Reset ChartDisplay to return the display toequal sized waveform “tracks.”You may use the Arrow tool to adjust chart boundariesand better view a waveform’s “track.” Position theArrow tool over a boundary line between waveforms.When the cursor changes style, drag to resize the trackof that waveform. (The I-Beam tool similarly changesstyle and can be used to adjust chart boundaries.)Choose Display > Reset Chart Display to evenlydisplay the waveform “tracks” in the graph window.I-Beam ToolSelect the I-Beam tool from thetoolbar.Click and drag the I-Beam toolacross the waveforms to selectan area of data.The I-Beam tool is used to select an area of a waveform (or multiplewaveforms) to be edited, measured, or transformed.Clicking and dragging the I-Beam tool across waveforms selects andhighlights an area of data. You can perform a variety of operations (editing,measuring, transforming, copying, pasting measurements to the Journal) on theselected data.© BIOPAC Systems, Inc. www.biopac.com