Part-time Students And part-time Study In Higher ... - Universities UK
Part-time Students And part-time Study In Higher ... - Universities UK
Part-time Students And part-time Study In Higher ... - Universities UK

You also want an ePaper? Increase the reach of your titles
YUMPU automatically turns print PDFs into web optimized ePapers that Google loves.
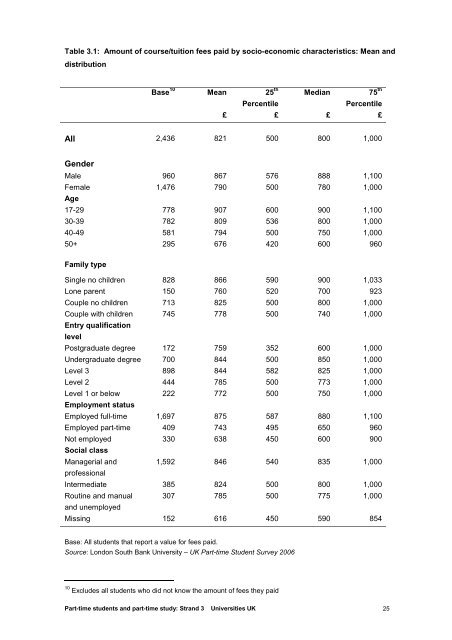
Table 3.1: Amount of course/tuition fees paid by socio-economic characteristics: Mean anddistributionBase 10Mean25 thMedian75 thPercentilePercentile££££All 2,436 821 500 800 1,000GenderMale 960 867 576 888 1,100Female 1,476 790 500 780 1,000Age17-29 778 907 600 900 1,10030-39 782 809 536 800 1,00040-49 581 794 500 750 1,00050+ 295 676 420 600 960Family typeSingle no children 828 866 590 900 1,033Lone parent 150 760 520 700 923Couple no children 713 825 500 800 1,000Couple with children 745 778 500 740 1,000Entry qualificationlevelPostgraduate degree 172 759 352 600 1,000Undergraduate degree 700 844 500 850 1,000Level 3 898 844 582 825 1,000Level 2 444 785 500 773 1,000Level 1 or below 222 772 500 750 1,000Employment statusEmployed full-<strong>time</strong> 1,697 875 587 880 1,100Employed <strong>part</strong>-<strong>time</strong> 409 743 495 650 960Not employed 330 638 450 600 900Social classManagerial and1,592 846 540 835 1,000professional<strong>In</strong>termediate 385 824 500 800 1,000Routine and manual 307 785 500 775 1,000and unemployedMissing 152 616 450 590 854Base: All students that report a value for fees paid.Source: London South Bank University – <strong>UK</strong> <strong>Part</strong>-<strong>time</strong> Student Survey 200610 Excludes all students who did not know the amount of fees they paid<strong>Part</strong>-<strong>time</strong> students and <strong>part</strong>-<strong>time</strong> study: Strand 3 <strong>Universities</strong> <strong>UK</strong> 25