MANUAL ON STREAM GAUGING - E-Library - WMO
MANUAL ON STREAM GAUGING - E-Library - WMO
MANUAL ON STREAM GAUGING - E-Library - WMO
- No tags were found...

Create successful ePaper yourself
Turn your PDF publications into a flip-book with our unique Google optimized e-Paper software.
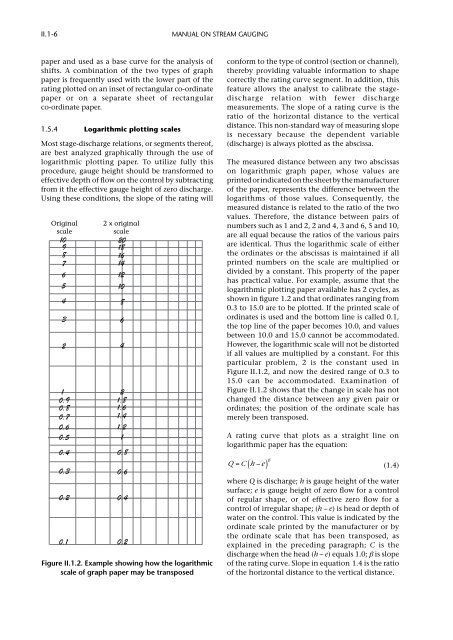
II.1-6manual on stream gaugingpaper and used as a base curve for the analysis ofshifts. A combination of the two types of graphpaper is frequently used with the lower part of therating plotted on an inset of rectangular co-ordinatepaper or on a separate sheet of rectangularco-ordinate paper.1.5.4 Logarithmic plotting scalesMost stage-discharge relations, or segments thereof,are best analyzed graphically through the use oflogarithmic plotting paper. To utilize fully thisprocedure, gauge height should be transformed toeffective depth of flow on the control by subtractingfrom it the effective gauge height of zero discharge.Using these conditions, the slope of the rating willOriginalscale109876543210.90.80.70.60.50.40.30.20.12 x originalscale20181614121086421.81.61.41.210.80.60.40.2Figure II.1.2. Example showing how the logarithmicscale of graph paper may be transposedconform to the type of control (section or channel),thereby providing valuable information to shapecorrectly the rating curve segment. In addition, thisfeature allows the analyst to calibrate the stagedischargerelation with fewer dischargemeasurements. The slope of a rating curve is theratio of the horizontal distance to the verticaldistance. This non-standard way of measuring slopeis necessary because the dependent variable(discharge) is always plotted as the abscissa.The measured distance between any two abscissason logarithmic graph paper, whose values areprinted or indicated on the sheet by the manufacturerof the paper, represents the difference between thelogarithms of those values. Consequently, themeasured distance is related to the ratio of the twovalues. Therefore, the distance between pairs ofnumbers such as 1 and 2, 2 and 4, 3 and 6, 5 and 10,are all equal because the ratios of the various pairsare identical. Thus the logarithmic scale of eitherthe ordinates or the abscissas is maintained if allprinted numbers on the scale are multiplied ordivided by a constant. This property of the paperhas practical value. For example, assume that thelogarithmic plotting paper available has 2 cycles, asshown in figure 1.2 and that ordinates ranging from0.3 to 15.0 are to be plotted. If the printed scale ofordinates is used and the bottom line is called 0.1,the top line of the paper becomes 10.0, and valuesbetween 10.0 and 15.0 cannot be accommodated.However, the logarithmic scale will not be distortedif all values are multiplied by a constant. For thisparticular problem, 2 is the constant used inFigure II.1.2, and now the desired range of 0.3 to15.0 can be accommodated. Examination ofFigure II.1.2 shows that the change in scale has notchanged the distance between any given pair orordinates; the position of the ordinate scale hasmerely been transposed.A rating curve that plots as a straight line onlogarithmic paper has the equation:Q = C ( h − e ) β (1.4)where Q is discharge; h is gauge height of the watersurface; e is gauge height of zero flow for a controlof regular shape, or of effective zero flow for acontrol of irregular shape; (h – e) is head or depth ofwater on the control. This value is indicated by theordinate scale printed by the manufacturer or bythe ordinate scale that has been transposed, asexplained in the preceding paragraph; C is thedischarge when the head (h – e) equals 1.0; β is slopeof the rating curve. Slope in equation 1.4 is the ratioof the horizontal distance to the vertical distance.