
Create successful ePaper yourself
Turn your PDF publications into a flip-book with our unique Google optimized e-Paper software.
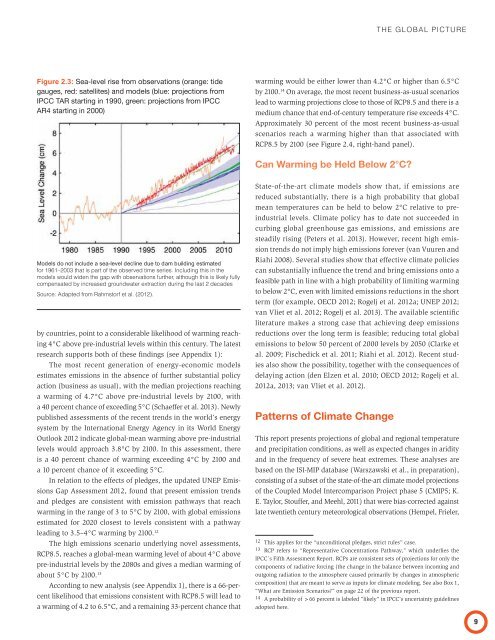
Figure 2.3:warming would be either lower than 4.2°C or higher than 6.5°Cby 2100. 14 On average, the most recent business-as-usual scenarioslead to warming projections close to those of RCP8.5 and there is amedium chance that end-of-century temperature rise exceeds 4°C.Approximately 30 percent of the most recent business-as-usualscenarios reach a warming higher than that associated withRCP8.5 by 2100 (see Figure 2.4, right-hand panel).Can Warming be Held Below 2°C?Models do not include a sea-level decline due to dam building estimatedby countries, point to a considerable likelihood of warming reaching4°C above pre-industrial levels within this century. The latestresearch supports both of these findings (see Appendix 1):The most recent generation of energy-economic modelsestimates emissions in the absence of further substantial policyaction (business as usual), with the median projections reachinga warming of 4.7°C above pre-industrial levels by 2100, witha 40 percent chance of exceeding 5°C (Schaeffer et al. 2013). Newlypublished assessments of the recent trends in the world’s energysystem by the International Energy Agency in its World EnergyOutlook 2012 indicate global-mean warming above pre-industriallevels would approach 3.8°C by 2100. In this assessment, thereis a 40 percent chance of warming exceeding 4°C by 2100 anda 10 percent chance of it exceeding 5°C.In relation to the effects of pledges, the updated UNEP EmissionsGap Assessment 2012, found that present emission trendsand pledges are consistent with emission pathways that reachwarming in the range of 3 to 5°C by 2100, with global emissionsestimated for 2020 closest to levels consistent with a pathwayleading to 3.5–4°C warming by 2100. 12The high emissions scenario underlying novel assessments,RCP8.5, reaches a global-mean warming level of about 4°C abovepre-industrial levels by the 2080s and gives a median warming ofabout 5°C by 2100. 13According to new analysis (see Appendix 1), there is a 66-percentlikelihood that emissions consistent with RCP8.5 will lead toa warming of 4.2 to 6.5°C, and a remaining 33-percent chance thatState-of-the-art climate models show that, if emissions arereduced substantially, there is a high probability that globalmean temperatures can be held to below 2°C relative to preindustriallevels. Climate policy has to date not succeeded incurbing global greenhouse gas emissions, and emissions aresteadily rising (Peters et al. 2013). However, recent high emissiontrends do not imply high emissions forever (van Vuuren andRiahi 2008). Several studies show that effective climate policiescan substantially influence the trend and bring emissions onto afeasible path in line with a high probability of limiting warmingto below 2°C, even with limited emissions reductions in the shortterm (for example, OECD 2012; Rogelj et al. 2012a; UNEP 2012;van Vliet et al. 2012; Rogelj et al. 2013). The available scientificliterature makes a strong case that achieving deep emissionsreductions over the long term is feasible; reducing total globalemissions to below 50 percent of 2000 levels by 2050 (Clarke etal. 2009; Fischedick et al. 2011; Riahi et al. 2012). Recent studiesalso show the possibility, together with the consequences ofdelaying action (den Elzen et al. 2010; OECD 2012; Rogelj et al.2012a, 2013; van Vliet et al. 2012).Patterns of Climate ChangeThis report presents projections of global and regional temperatureand precipitation conditions, as well as expected changes in aridityand in the frequency of severe heat extremes. These analyses arebased on the ISI-MIP database (Warszawski et al., in preparation),consisting of a subset of the state-of-the-art climate model projectionsof the Coupled Model Intercomparison Project phase 5 (CMIP5; K.E. Taylor, Stouffer, and Meehl, 2011) that were bias-corrected againstlate twentieth century meteorological observations (Hempel, Frieler,12 This applies for the “unconditional pledges, strict rules” case.13 RCP refers to “Representative Concentrations Pathway,” which underlies theIPCC´s Fifth Assessment <strong>Report</strong>. RCPs are consistent sets of projections for only thecomponents of radiative forcing (the change in the balance between incoming andoutgoing radiation to the atmosphere caused primarily by changes in atmosphericcomposition) that are meant to serve as inputs for climate modeling. See also Box 1,“What are Emission Scenarios?” on page 22 of the previous report.14 A probability of >66 percent is labeled “likely” in IPCC’s uncertainty guidelinesadopted here.