- Page 1 and 2: Public Disclosure AuthorizedPublic
- Page 3 and 4: © 2013 International Bank for Reco
- Page 8 and 9: CONTENTS Tables
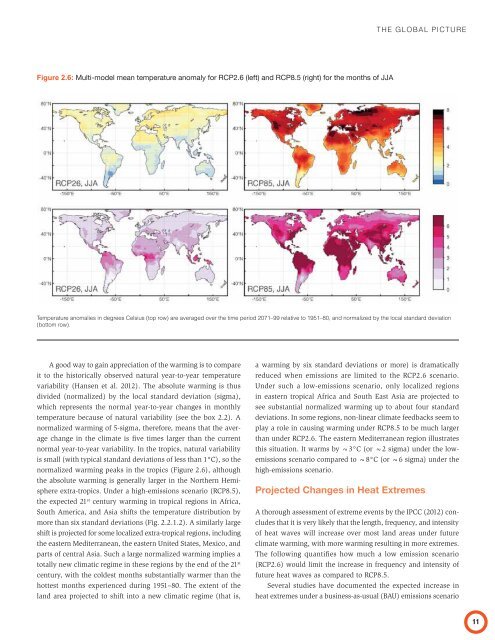
- Page 10 and 11: The report Turn Down the Heat: Clim
- Page 12 and 13: The work of the World Bank Group is
- Page 16 and 17: This report focuses on the risks of
- Page 18 and 19: EXECUTIVE SUMMARYKey Findings Acros
- Page 20 and 21: EXECUTIVE SUMMARYFigure 2 practiced
- Page 22 and 23: EXECUTIVE SUMMARYFigure 3 - Agricul
- Page 24 and 25: EXECUTIVE SUMMARYCO 2fertilization
- Page 26 and 27: EXECUTIVE SUMMARYthe East African h
- Page 28 and 29: EXECUTIVE SUMMARYTable 2:Heat extre
- Page 30: EXECUTIVE SUMMARYEndnotes1 Years in
- Page 34 and 35: Aridity Index The Aridity Index (AI
- Page 36: like “unusual” or “unpreceden
- Page 39 and 40: TURN DOWN THE HEAT: CLIMATE EXTREME
- Page 41: TURN DOWN THE HEAT: CLIMATE EXTREME
- Page 45 and 46: TURN DOWN THE HEAT: CLIMATE EXTREME
- Page 47: TURN DOWN THE HEAT: CLIMATE EXTREME
- Page 51 and 52: TURN DOWN THE HEAT: CLIMATE EXTREME
- Page 53: TURN DOWN THE HEAT: CLIMATE EXTREME
- Page 57 and 58: TURN DOWN THE HEAT: CLIMATE EXTREME
- Page 59 and 60: TURN DOWN THE HEAT: CLIMATE EXTREME
- Page 61 and 62: TURN DOWN THE HEAT: CLIMATE EXTREME
- Page 63 and 64: TURN DOWN THE HEAT: CLIMATE EXTREME
- Page 65 and 66: TURN DOWN THE HEAT: CLIMATE EXTREME
- Page 67 and 68: TURN DOWN THE HEAT: CLIMATE EXTREME
- Page 69 and 70: TURN DOWN THE HEAT: CLIMATE EXTREME
- Page 71 and 72: TURN DOWN THE HEAT: CLIMATE EXTREME
- Page 73 and 74: TURN DOWN THE HEAT: CLIMATE EXTREME
- Page 75 and 76: TURN DOWN THE HEAT: CLIMATE EXTREME
- Page 77 and 78: TURN DOWN THE HEAT: CLIMATE EXTREME
- Page 79 and 80: TURN DOWN THE HEAT: CLIMATE EXTREME
- Page 81 and 82: TURN DOWN THE HEAT: CLIMATE EXTREME
- Page 83 and 84: TURN DOWN THE HEAT: CLIMATE EXTREME
- Page 85 and 86: TURN DOWN THE HEAT: CLIMATE EXTREME
- Page 87 and 88: TURN DOWN THE HEAT: CLIMATE EXTREME
- Page 89 and 90: TURN DOWN THE HEAT: CLIMATE EXTREME
- Page 91 and 92: TURN DOWN THE HEAT: CLIMATE EXTREME
- Page 93 and 94: TURN DOWN THE HEAT: CLIMATE EXTREME
- Page 95 and 96: TURN DOWN THE HEAT: CLIMATE EXTREME
- Page 97 and 98: TURN DOWN THE HEAT: CLIMATE EXTREME
- Page 99 and 100:
TURN DOWN THE HEAT: CLIMATE EXTREME
- Page 102 and 103:
In this report, South East Asia ref
- Page 104 and 105:
Figure 4.1:°°region. Projections
- Page 106 and 107:
Integrated Synthesis of Climate Cha
- Page 108 and 109:
would be limited to around 1.5°C (
- Page 110 and 111:
Figure 4.5:would become nearly year
- Page 112 and 113:
According to the Saffir-Simpson hur
- Page 114 and 115:
(a common time period in the impact
- Page 116 and 117:
is reached in which responses to sm
- Page 118 and 119:
declines from 6-12 percent in the M
- Page 120 and 121:
terms of population size; however,
- Page 122 and 123:
on the physical (i.e., sea level, s
- Page 124 and 125:
Tengah, Sulawesi Tenggara, Sumatra
- Page 126 and 127:
above 3 between 30°N and 30°S. It
- Page 128 and 129:
Box 4.4: Fundamental EcosystemChang
- Page 130 and 131:
It is projected that increased weat
- Page 132 and 133:
droughts, floods, and increased sto
- Page 134 and 135:
Table 4.9:Regional Warming South Ch
- Page 136 and 137:
Table 4.9:Sea-level RiseImpactsCoas
- Page 138 and 139:
Table 4.9:Aquaculture Marine Fisher
- Page 142 and 143:
In this report, South Asia refers t
- Page 144 and 145:
Table 5.1: Regional warmingHeatextr
- Page 146 and 147:
Sector-based and Thematic ImpactsWa
- Page 148 and 149:
Box 5.1: Observed VulnerabilitiesOb
- Page 150 and 151:
warming more, especially in the sou
- Page 152 and 153:
Figure 5.6:precipitation (i.e., dur
- Page 154 and 155:
climate change, which amounts to ab
- Page 156 and 157:
Immerzeel, Sperna Weiland, and Bier
- Page 158 and 159:
Figure 5.9: a. GWBWCCc. GWBWCCPb. S
- Page 160 and 161:
350,000. 104 The storm-surge areas
- Page 162 and 163:
to the projections presented in Cha
- Page 164 and 165:
Jagadish, Sumfleth, et al. 2009). B
- Page 166 and 167:
equirements of plants for evapotran
- Page 168 and 169:
Figure 5.13:Figure 5.14: 2whether t
- Page 170 and 171:
population growth. Under climate ch
- Page 172 and 173:
malnutrition, affecting long-term g
- Page 174 and 175:
Climate change is expected to affec
- Page 176 and 177:
hydrological regime is agriculture,
- Page 178 and 179:
Table 5.5:Sea-level Rise(above pres
- Page 180 and 181:
Table 5.5: River Runoff Indus cent
- Page 182 and 183:
Table 5.5:Yields All crops Changes
- Page 186 and 187:
This chapter identifies hotspots of
- Page 188 and 189:
J. Vorosmarty 2000). Thus, when ass
- Page 190 and 191:
Figure 6.4:Figure 6.5:in avoided im
- Page 192 and 193:
Figure 6.6:% of ecoregions100%90%80
- Page 194 and 195:
Figure 6.7:The bright-colored bars
- Page 196 and 197:
levels. It is also clear that some
- Page 198 and 199:
Hallegatte and Przyluski (2010) fin
- Page 200:
isks. One cluster of impacts that n
- Page 205 and 206:
TURN DOWN THE HEAT: CLIMATE EXTREME
- Page 207 and 208:
TURN DOWN THE HEAT: CLIMATE EXTREME
- Page 210 and 211:
Bias Correction for Subset ofCMIP5
- Page 212 and 213:
Box A2.1 model.09 - BalanceHyd
- Page 214 and 215:
Box A2.1 Simulator with managedl
- Page 218 and 219:
-All indicators have annual tempora
- Page 222 and 223:
of the effects of CO 2
- Page 224 and 225:
Table A4.1 Sorghum- 2 2 1 -Ground
- Page 228 and 229:
Ackerley, D., Booth, B. B. B., Knig
- Page 230 and 231:
the National Academy of Sciences of
- Page 232 and 233:
Clark, R. T., Brown, S. J., & Murph
- Page 234 and 235:
FAO. (2013). Production Quantity of
- Page 236 and 237:
He, F., & MacGregor, G. (2007). Sal
- Page 238 and 239:
study. Climate Dynamics, 37(3-4), 7
- Page 240 and 241:
1950-2011. Journal of Geophysical R
- Page 242 and 243:
Mumby, P. J., Iglesias-Prieto, R.,
- Page 244 and 245:
Riahi, K., F. Dentener, D. Gielen,
- Page 246 and 247:
Sugi, M., Murakami, H., & Yoshimura
- Page 248 and 249:
Villanoy, C., David, L., Cabrera, O
- Page 250:
Yumul, G. P., Cruz, N. A., & Servan