
Create successful ePaper yourself
Turn your PDF publications into a flip-book with our unique Google optimized e-Paper software.
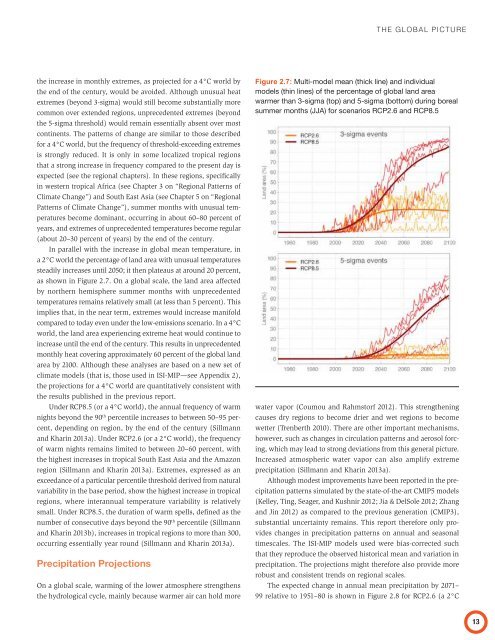
the increase in monthly extremes, as projected for a 4°C world bythe end of the century, would be avoided. Although unusual heatextremes (beyond 3-sigma) would still become substantially morecommon over extended regions, unprecedented extremes (beyondthe 5-sigma threshold) would remain essentially absent over mostcontinents. The patterns of change are similar to those describedfor a 4°C world, but the frequency of threshold-exceeding extremesis strongly reduced. It is only in some localized tropical regionsthat a strong increase in frequency compared to the present day isexpected (see the regional chapters). In these regions, specificallyin western tropical Africa (see Chapter 3 on “Regional Patterns ofClimate Change”) and South East Asia (see Chapter 5 on “RegionalPatterns of Climate Change”), summer months with unusual temperaturesbecome dominant, occurring in about 60–80 percent ofyears, and extremes of unprecedented temperatures become regular(about 20–30 percent of years) by the end of the century.In parallel with the increase in global mean temperature, ina 2°C world the percentage of land area with unusual temperaturessteadily increases until 2050; it then plateaus at around 20 percent,as shown in Figure 2.7. On a global scale, the land area affectedby northern hemisphere summer months with unprecedentedtemperatures remains relatively small (at less than 5 percent). Thisimplies that, in the near term, extremes would increase manifoldcompared to today even under the low-emissions scenario. In a 4°Cworld, the land area experiencing extreme heat would continue toincrease until the end of the century. This results in unprecedentedmonthly heat covering approximately 60 percent of the global landarea by 2100. Although these analyses are based on a new set ofclimate models (that is, those used in ISI-MIP—see Appendix 2),the projections for a 4°C world are quantitatively consistent withthe results published in the previous report.Under RCP8.5 (or a 4°C world), the annual frequency of warmnights beyond the 90 th percentile increases to between 50–95 percent,depending on region, by the end of the century (Sillmannand Kharin 2013a). Under RCP2.6 (or a 2°C world), the frequencyof warm nights remains limited to between 20–60 percent, withthe highest increases in tropical South East Asia and the Amazonregion (Sillmann and Kharin 2013a). Extremes, expressed as anexceedance of a particular percentile threshold derived from naturalvariability in the base period, show the highest increase in tropicalregions, where interannual temperature variability is relativelysmall. Under RCP8.5, the duration of warm spells, defined as thenumber of consecutive days beyond the 90 th percentile (Sillmannand Kharin 2013b), increases in tropical regions to more than 300,occurring essentially year round (Sillmann and Kharin 2013a).Precipitation ProjectionsOn a global scale, warming of the lower atmosphere strengthensthe hydrological cycle, mainly because warmer air can hold moreFigure 2.7:water vapor (Coumou and Rahmstorf 2012). This strengtheningcauses dry regions to become drier and wet regions to becomewetter (Trenberth 2010). There are other important mechanisms,however, such as changes in circulation patterns and aerosol forcing,which may lead to strong deviations from this general picture.Increased atmospheric water vapor can also amplify extremeprecipitation (Sillmann and Kharin 2013a).Although modest improvements have been reported in the precipitationpatterns simulated by the state-of-the-art CMIP5 models(Kelley, Ting, Seager, and Kushnir 2012; Jia & DelSole 2012; Zhangand Jin 2012) as compared to the previous generation (CMIP3),substantial uncertainty remains. This report therefore only provideschanges in precipitation patterns on annual and seasonaltimescales. The ISI-MIP models used were bias-corrected suchthat they reproduce the observed historical mean and variation inprecipitation. The projections might therefore also provide morerobust and consistent trends on regional scales.The expected change in annual mean precipitation by 2071–99 relative to 1951–80 is shown in Figure 2.8 for RCP2.6 (a 2°C