- Page 1 and 2:
….where the Mathematicscomes swee
- Page 3 and 4:
THANK YOU TO OUR REVIEWERSKeith Ado
- Page 5 and 6:
Table of ContentsPreservice Teacher
- Page 7 and 8:
Support for Students Learning Mathe
- Page 9 and 10:
own problem solving, which is criti
- Page 11 and 12:
to get started and persistence. Tea
- Page 13 and 14:
Posamentier, A. S., Smith, B. S., &
- Page 15 and 16:
conceptual understanding, applicati
- Page 17 and 18:
Table 1Identified Mathematical Prac
- Page 19 and 20:
justify their statements, included
- Page 21 and 22:
Finally, engagement in MP.6 was ass
- Page 23 and 24:
PRESERVICE TEACHERS’ EMOTIONAL EN
- Page 25 and 26:
“experiences that are charged wit
- Page 27 and 28:
Number of journals containingEmotio
- Page 29 and 30:
ConclusionsStruggle and frustration
- Page 31 and 32:
Mathematics Teacher Candidates’ U
- Page 33 and 34:
function and applied the vertical l
- Page 35 and 36:
semester, about half of the course
- Page 37 and 38:
They further state that “the impo
- Page 39 and 40:
C. Laborde (Eds.) International Han
- Page 41 and 42:
(SCK), or knowledge of mathematics
- Page 43 and 44:
level of difficulty for each partic
- Page 45 and 46:
MKT Measures ScoresMathematics in G
- Page 47 and 48:
deep rooted belief in a single way
- Page 49 and 50:
THE INTERVIEW PROJECTAngel Rowe Abn
- Page 51 and 52:
involving addition and subtraction:
- Page 53 and 54:
6+7 4+9=6+(6+1) Substitution =4+(10
- Page 55 and 56:
We strongly believe that this inter
- Page 57 and 58:
AN INNOVATIVE APPROACH FOR SUPPORTI
- Page 59 and 60:
Practice throughout the investigati
- Page 61 and 62:
are expected to pursue. Teacher not
- Page 63 and 64:
students to organize their reports
- Page 65 and 66:
Slovin, H., Venenciano, L., Ishihar
- Page 67 and 68:
The research presented in this pape
- Page 69 and 70:
students’ confidence. Because bel
- Page 71 and 72:
triangulation necessitated examinat
- Page 73 and 74:
their ability to teach the mathemat
- Page 75 and 76:
SPATIAL REASONING IN UNDERGRADUATE
- Page 77 and 78:
journal prompt would be given as a
- Page 79 and 80:
given to the 33 students on the MPI
- Page 81 and 82:
to advance our way of life, then sp
- Page 83 and 84:
STUDENT CONCEPTIONS OF “BEST” S
- Page 85 and 86:
students are likely to interact wit
- Page 87 and 88:
opinion of the student body. This q
- Page 89 and 90:
At the highest level of reasoning a
- Page 91 and 92:
APPENDIXTo use two decks of cards t
- Page 93 and 94:
isolated and often occur in tandem
- Page 95 and 96:
with the CCSSM. Teachers read and d
- Page 97 and 98:
teachers’ role-play of SFMP #4. A
- Page 99 and 100:
Durkin, D. (1978-1979). What classr
- Page 101 and 102:
as well as the alignment between th
- Page 103 and 104:
Table 2Number of teachers per grade
- Page 105 and 106:
Table 4Classification Categories fo
- Page 107 and 108:
field so that research on the initi
- Page 109 and 110:
dynamic approach to learning conten
- Page 111 and 112:
Kindergarten Lesson FormatHow May W
- Page 113 and 114: team’s goals? As much as possible
- Page 115 and 116: 6. While preparing the lesson, teac
- Page 117 and 118: active learning and collective part
- Page 119 and 120: classroom. “I would like to know
- Page 121 and 122: I had never been brave enough to tr
- Page 123 and 124: THE PATH OF REFORM IN SECONDARY MAT
- Page 125 and 126: Our collaboration model was formed
- Page 127 and 128: internal evaluator) were analyzed.
- Page 129 and 130: DiscussionOn part I of the survey t
- Page 131 and 132: whole department of secondary mathe
- Page 133 and 134: discussion. Many texts include wild
- Page 135 and 136: Data collection consisted of tests,
- Page 137 and 138: I've not used children's literature
- Page 139 and 140: could extend this inquiry to high s
- Page 141 and 142: course titled Calculus with Busines
- Page 143 and 144: no mathematical sense and should no
- Page 145 and 146: Adopts the “111” (a term coined
- Page 147 and 148: Specifically, clicking the “Click
- Page 149 and 150: algebraic expression is carried out
- Page 151 and 152: Retrieved from http://secc.sedl.org
- Page 153 and 154: furthermore, each model may result
- Page 155 and 156: After instruction in the course, th
- Page 157 and 158: Table 4The group’s categories and
- Page 159 and 160: you choose three place values, æ 4
- Page 161 and 162: APPENDIXTable 5Description of Combi
- Page 163: of the presented number. Later, the
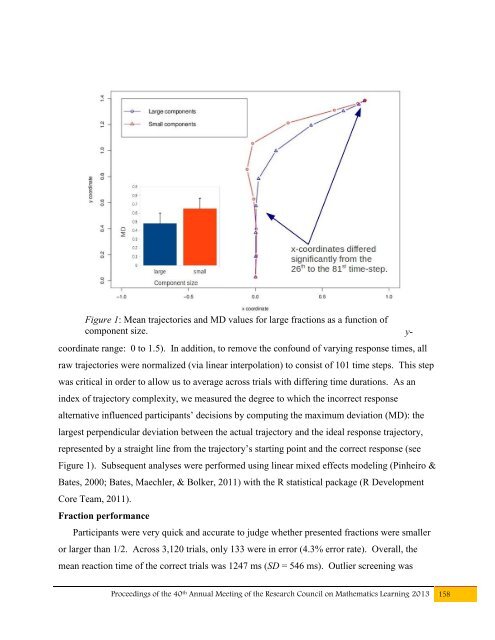
- Page 167 and 168: Figure 2: Mean trajectories and MD
- Page 169 and 170: Performance, 33, 1410-1419.Cohen Ka
- Page 171 and 172: Moyer, 2007). At his or her own pac
- Page 173 and 174: logged by the system and then retri
- Page 175 and 176: curriculum. The nature of the onlin
- Page 177 and 178: Cox, G., Carr, T., & Hall, M. (2004
- Page 179 and 180: curriculum locally, within individu
- Page 181 and 182: Popularity tallied whether or not a
- Page 183 and 184: Amazingly, despite there being a fe
- Page 185 and 186: ReferencesBlack, M. (1962). Models
- Page 187 and 188: connections are connections or rela
- Page 189 and 190: Table 1Instructional TasksSquareTab
- Page 191 and 192: t-charts made it easier for student
- Page 193 and 194: Figure 2. A Display of Student Stra
- Page 195 and 196: ReferencesAnderson, J. R., Greeno,
- Page 197 and 198: their parents in phenotype (observa
- Page 199 and 200: student learning calls for differen
- Page 201 and 202: Figure 2. (A) P3. (B). Extension of
- Page 203 and 204: the usual phenotypic assessments an
- Page 205 and 206: teachers is the discrepancy between
- Page 207 and 208: expected to learn and the inquiry a
- Page 209 and 210: his partner about his observations,
- Page 211 and 212: hard for some children? The nature
- Page 213 and 214: Lakoff and Nunez: specifically, tha
- Page 215 and 216:
Figure 5: Average hand trajectories
- Page 217 and 218:
Figure 6: Distributions of maximum
- Page 219 and 220:
ReferencesAnderson, J. R. (2005). H
- Page 221 and 222:
Social system perspectives view the
- Page 223 and 224:
urged students to think of some way
- Page 225 and 226:
Figure 1: The Discourse Patterns Du
- Page 227 and 228:
Figure 3 blow illustrates the devel