China and India and Ethiopia final report - FES Ethiopia
China and India and Ethiopia final report - FES Ethiopia
China and India and Ethiopia final report - FES Ethiopia

You also want an ePaper? Increase the reach of your titles
YUMPU automatically turns print PDFs into web optimized ePapers that Google loves.
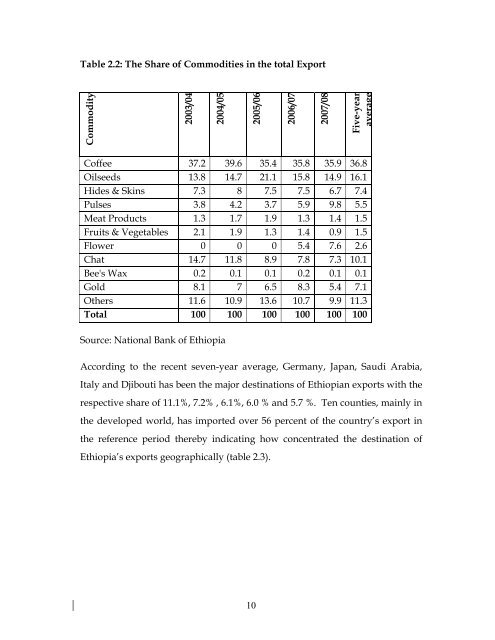
Table 2.2: The Share of Commodities in the total ExportCommodity2003/042004/052005/062006/072007/08Five-yearaverageCoffee 37.2 39.6 35.4 35.8 35.9 36.8Oilseeds 13.8 14.7 21.1 15.8 14.9 16.1Hides & Skins 7.3 8 7.5 7.5 6.7 7.4Pulses 3.8 4.2 3.7 5.9 9.8 5.5Meat Products 1.3 1.7 1.9 1.3 1.4 1.5Fruits & Vegetables 2.1 1.9 1.3 1.4 0.9 1.5Flower 0 0 0 5.4 7.6 2.6Chat 14.7 11.8 8.9 7.8 7.3 10.1Bee's Wax 0.2 0.1 0.1 0.2 0.1 0.1Gold 8.1 7 6.5 8.3 5.4 7.1Others 11.6 10.9 13.6 10.7 9.9 11.3Total 100 100 100 100 100 100Source: National Bank of <strong>Ethiopia</strong>According to the recent seven-year average, Germany, Japan, Saudi Arabia,Italy <strong>and</strong> Djibouti has been the major destinations of <strong>Ethiopia</strong>n exports with therespective share of 11.1%, 7.2% , 6.1%, 6.0 % <strong>and</strong> 5.7 %. Ten counties, mainly inthe developed world, has imported over 56 percent of the country’s export inthe reference period thereby indicating how concentrated the destination of<strong>Ethiopia</strong>’s exports geographically (table 2.3).10