China and India and Ethiopia final report - FES Ethiopia
China and India and Ethiopia final report - FES Ethiopia
China and India and Ethiopia final report - FES Ethiopia

Create successful ePaper yourself
Turn your PDF publications into a flip-book with our unique Google optimized e-Paper software.
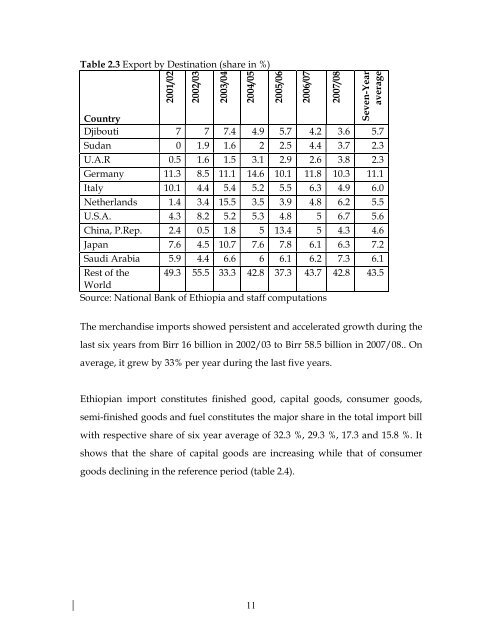
Table 2.3 Export by Destination (share in %)2001/022002/032003/04CountryDjibouti 7 7 7.4 4.9 5.7 4.2 3.6 5.72004/052005/062006/072007/08Seven-YearaverageSudan 0 1.9 1.6 2 2.5 4.4 3.7 2.3U.A.R 0.5 1.6 1.5 3.1 2.9 2.6 3.8 2.3Germany 11.3 8.5 11.1 14.6 10.1 11.8 10.3 11.1Italy 10.1 4.4 5.4 5.2 5.5 6.3 4.9 6.0Netherl<strong>and</strong>s 1.4 3.4 15.5 3.5 3.9 4.8 6.2 5.5U.S.A. 4.3 8.2 5.2 5.3 4.8 5 6.7 5.6<strong>China</strong>, P.Rep. 2.4 0.5 1.8 5 13.4 5 4.3 4.6Japan 7.6 4.5 10.7 7.6 7.8 6.1 6.3 7.2Saudi Arabia 5.9 4.4 6.6 6 6.1 6.2 7.3 6.1Rest of the 49.3 55.5 33.3 42.8 37.3 43.7 42.8 43.5WorldSource: National Bank of <strong>Ethiopia</strong> <strong>and</strong> staff computationsThe merch<strong>and</strong>ise imports showed persistent <strong>and</strong> accelerated growth during thelast six years from Birr 16 billion in 2002/03 to Birr 58.5 billion in 2007/08.. Onaverage, it grew by 33% per year during the last five years.<strong>Ethiopia</strong>n import constitutes finished good, capital goods, consumer goods,semi-finished goods <strong>and</strong> fuel constitutes the major share in the total import billwith respective share of six year average of 32.3 %, 29.3 %, 17.3 <strong>and</strong> 15.8 %. Itshows that the share of capital goods are increasing while that of consumergoods declining in the reference period (table 2.4).11