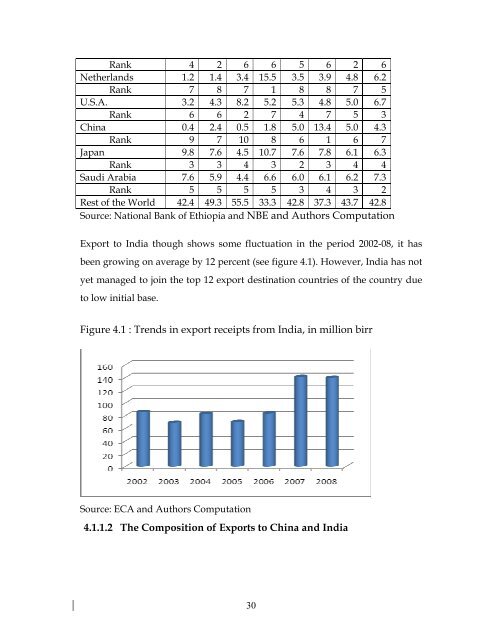
Rank 4 2 6 6 5 6 2 6Netherl<strong>and</strong>s 1.2 1.4 3.4 15.5 3.5 3.9 4.8 6.2Rank 7 8 7 1 8 8 7 5U.S.A. 3.2 4.3 8.2 5.2 5.3 4.8 5.0 6.7Rank 6 6 2 7 4 7 5 3<strong>China</strong> 0.4 2.4 0.5 1.8 5.0 13.4 5.0 4.3Rank 9 7 10 8 6 1 6 7Japan 9.8 7.6 4.5 10.7 7.6 7.8 6.1 6.3Rank 3 3 4 3 2 3 4 4Saudi Arabia 7.6 5.9 4.4 6.6 6.0 6.1 6.2 7.3Rank 5 5 5 5 3 4 3 2Rest of the World 42.4 49.3 55.5 33.3 42.8 37.3 43.7 42.8Source: National Bank of <strong>Ethiopia</strong> <strong>and</strong> NBE <strong>and</strong> Authors ComputationExport to <strong>India</strong> though shows some fluctuation in the period 2002-08, it hasbeen growing on average by 12 percent (see figure 4.1). However, <strong>India</strong> has notyet managed to join the top 12 export destination countries of the country dueto low initial base.Figure 4.1 : Trends in export receipts from <strong>India</strong>, in million birrSource: ECA <strong>and</strong> Authors Computation4.1.1.2 The Composition of Exports to <strong>China</strong> <strong>and</strong> <strong>India</strong>30
Attempt is made here to examine the composition of exports to <strong>China</strong> <strong>and</strong><strong>India</strong>. According to analysis of raw data from Customs Authority, vegetablesproducts, raw hides <strong>and</strong> skins <strong>and</strong> leather products, <strong>and</strong> mineral products arethe top three export commodity categories finding their way into <strong>China</strong>, onaverage, accounting for about 98 percent of the total exports to <strong>China</strong>, in theperiod 2002-2008(figure 4.2). Within the vegetable products export category,the lion’s share (over 90 percent) is due to sesame export. Of the hides <strong>and</strong> skin,on average about 55 percent is tanned/crust skins of goats <strong>and</strong> sheep (wetblue)over the last three years (2006-2008). Of the mineral products export, onaverage about 92 percent has been Titanium ores <strong>and</strong> concentrates over sameperiod.With regards to <strong>India</strong>, among export commodity categories, vegetablesproducts, hides <strong>and</strong> skins <strong>and</strong> leather products, textile <strong>and</strong> textile articles <strong>and</strong>metal <strong>and</strong> articles of base metals are the major four export categories over theperiod 2002-08. These categories altogether account, on average, for over 99percent of the total exports to <strong>India</strong> (figure 4.3). Within the vegetable productsexport, the lion’s share (over 90 percent) is due to sesame export. Of the hides<strong>and</strong> skins <strong>and</strong> leather products, about 57 percent was due to exports of pickledskins of sheep or lambs without wool, not tanned. With respect to textile, onaverage, about 90 percent was due to exports of cotton, carded or combed.With regards to metals <strong>and</strong> articles of base metals , on average, 59 percent wasdue to exports of copper, aluminum <strong>and</strong> zinc wastes <strong>and</strong> scraps over 2006-7, in2008 however, significant share (44 percent ) was due to exports of semifinishedproducts, of alloy steel (excl. stainless).Figure: 4.2 Exports to <strong>China</strong>, Share of major Exports31