China and India and Ethiopia final report - FES Ethiopia
China and India and Ethiopia final report - FES Ethiopia
China and India and Ethiopia final report - FES Ethiopia

You also want an ePaper? Increase the reach of your titles
YUMPU automatically turns print PDFs into web optimized ePapers that Google loves.
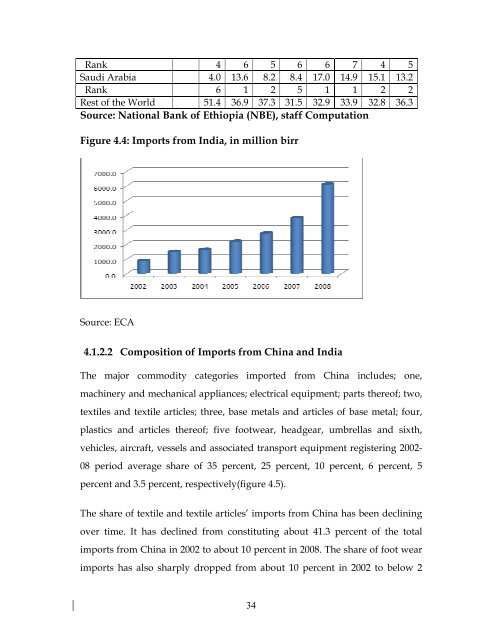
Rank 4 6 5 6 6 7 4 5Saudi Arabia 4.0 13.6 8.2 8.4 17.0 14.9 15.1 13.2Rank 6 1 2 5 1 1 2 2Rest of the World 51.4 36.9 37.3 31.5 32.9 33.9 32.8 36.3Source: National Bank of <strong>Ethiopia</strong> (NBE), staff ComputationFigure 4.4: Imports from <strong>India</strong>, in million birrSource: ECA4.1.2.2 Composition of Imports from <strong>China</strong> <strong>and</strong> <strong>India</strong>The major commodity categories imported from <strong>China</strong> includes; one,machinery <strong>and</strong> mechanical appliances; electrical equipment; parts thereof; two,textiles <strong>and</strong> textile articles; three, base metals <strong>and</strong> articles of base metal; four,plastics <strong>and</strong> articles thereof; five footwear, headgear, umbrellas <strong>and</strong> sixth,vehicles, aircraft, vessels <strong>and</strong> associated transport equipment registering 2002-08 period average share of 35 percent, 25 percent, 10 percent, 6 percent, 5percent <strong>and</strong> 3.5 percent, respectively(figure 4.5).The share of textile <strong>and</strong> textile articles’ imports from <strong>China</strong> has been decliningover time. It has declined from constituting about 41.3 percent of the totalimports from <strong>China</strong> in 2002 to about 10 percent in 2008. The share of foot wearimports has also sharply dropped from about 10 percent in 2002 to below 234