China and India and Ethiopia final report - FES Ethiopia
China and India and Ethiopia final report - FES Ethiopia
China and India and Ethiopia final report - FES Ethiopia

Create successful ePaper yourself
Turn your PDF publications into a flip-book with our unique Google optimized e-Paper software.
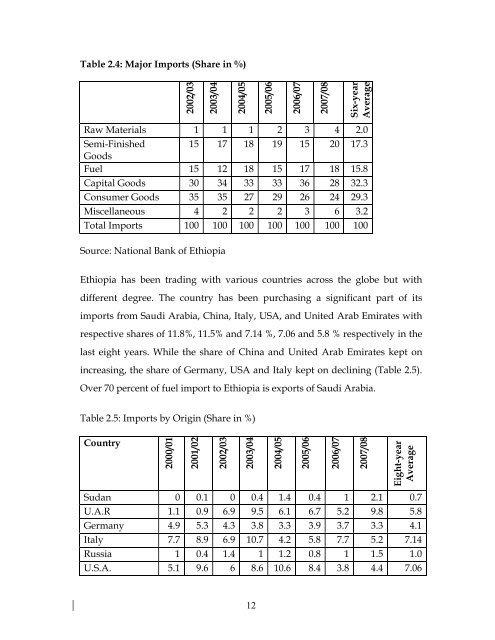
Table 2.4: Major Imports (Share in %)2002/032003/042004/052005/062006/072007/08Six-yearAverageRaw Materials 1 1 1 2 3 4 2.0Semi-Finished 15 17 18 19 15 20 17.3GoodsFuel 15 12 18 15 17 18 15.8Capital Goods 30 34 33 33 36 28 32.3Consumer Goods 35 35 27 29 26 24 29.3Miscellaneous 4 2 2 2 3 6 3.2Total Imports 100 100 100 100 100 100 100Source: National Bank of <strong>Ethiopia</strong><strong>Ethiopia</strong> has been trading with various countries across the globe but withdifferent degree. The country has been purchasing a significant part of itsimports from Saudi Arabia, <strong>China</strong>, Italy, USA, <strong>and</strong> United Arab Emirates withrespective shares of 11.8%, 11.5% <strong>and</strong> 7.14 %, 7.06 <strong>and</strong> 5.8 % respectively in thelast eight years. While the share of <strong>China</strong> <strong>and</strong> United Arab Emirates kept onincreasing, the share of Germany, USA <strong>and</strong> Italy kept on declining (Table 2.5).Over 70 percent of fuel import to <strong>Ethiopia</strong> is exports of Saudi Arabia.Table 2.5: Imports by Origin (Share in %)Country2000/012001/022002/032003/042004/052005/062006/072007/08Eight-yearAverageSudan 0 0.1 0 0.4 1.4 0.4 1 2.1 0.7U.A.R 1.1 0.9 6.9 9.5 6.1 6.7 5.2 9.8 5.8Germany 4.9 5.3 4.3 3.8 3.3 3.9 3.7 3.3 4.1Italy 7.7 8.9 6.9 10.7 4.2 5.8 7.7 5.2 7.14Russia 1 0.4 1.4 1 1.2 0.8 1 1.5 1.0U.S.A. 5.1 9.6 6 8.6 10.6 8.4 3.8 4.4 7.0612