Science Essentials - McGraw-Hill Books
Science Essentials - McGraw-Hill Books
Science Essentials - McGraw-Hill Books

You also want an ePaper? Increase the reach of your titles
YUMPU automatically turns print PDFs into web optimized ePapers that Google loves.
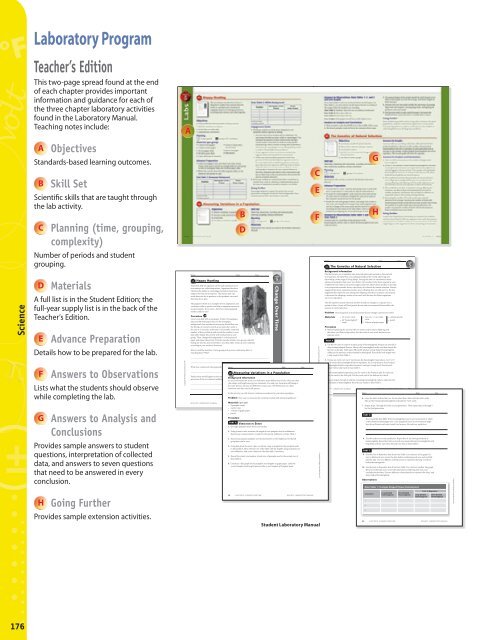
Laboratory ProgramTeacher’s EditionThis two-page spread found at the endof each chapter provides importantinformation and guidance for each ofthe three chapter laboratory activitiesfound in the Laboratory Manual.Teaching notes include:AA ObjectivesStandards-based learning outcomes.B Skill SetScientific skills that are taught throughthe lab activity.C Planning (time, grouping,complexity)Number of periods and studentgrouping.BDCEFName Date Time5CGHThe Genetics of Natural SelectionChapter5<strong>Science</strong>D MaterialsA full list is in the Student Edition; thefull-year supply list is in the back of theTeacher’s Edition.E Advance PreparationDetails how to be prepared for the lab.F Answers to ObservationsLists what the students should observewhile completing the lab.G Answers to Analysis andConclusionsProvides sample answers to studentquestions, interpretation of collecteddata, and answers to seven questionsthat need to be answered in everyconclusion.H Going FurtherCopyright © Wright Group/<strong>McGraw</strong>-<strong>Hill</strong>Name Date Time5A Happy HuntingTraits that help an organism survive and reproduce in itsenvironment are called adaptations. Organisms that haveinherited the ability to camouflage themselves have beenadapted for their environments. That means prey canavoid detection by its predator, or the predator can avoiddetection by its prey.The peppered moth is an example of how adaptations andvariations within a species can help an organism survive inits environment. If you were a bird, how many pepperedmoths could you see?ProcedureCover your desk with a newspaper. Scatter 50 newspaperdiscs and 50 white paper discs on the newspaperbackground. One member of your group should then usethe forceps or tweezers to pick up as many discs as he orshe can in 15 seconds. At the end of 15 seconds, count thenumber of discs picked up and record the number in yourdata table. Repeat this activity with each person in yourgroup. Then, change the background to a white piece ofpaper and repeat the activity. Total the number of discs your group collectedduring the activity, and record this in your data table. Clean up your materialsaccording to your teacher’s directions.Did you and the members of your group pick up more contrasting discs ormatching discs? Why?Chapter5Change Over TimeWhat two variations in the peppered moth species Name did the discs represent?Date Time5B Measuring Variations in a PopulationPredict what would happen to the number of moths with each passingBackground Informationgeneration if the environment suddenly changed. Explain your answer.As you look around the room, you will notice many differences in hair color, eye color,chin shape, and height among your classmates. You and your classmates all belong tothe same species, but you are different in many ways. The differences are calledvariations, and they exist in all species.In this activity, you will observe variations in seeds and in your class population.Problem How can you measure the variations in plant and animal populations?BIOLOGY LABORATORY MANUAL Materials (per CHAPTER pair) 5: CHANGE OVER TIME25 ProcedurePART A VARIATION IN SEEDS1. Get eight pumpkin seeds from your teacher.2. Using a metric ruler, measure the length of each pumpkin seed in millimeters.Record your measurements, rounded to the nearest millimeter, in Data Table 1.3. Record your group’s pumpkin seed measurements on the chalkboard so that allgroup data can be seen.4. Using data from the entire class, record the range in lengths for the pumpkin seedsone millimeter. Add more columns to the data table, if necessary.5. Record the class’s total number of each size of pumpkin seed in the second row of6. Construct a line graph for the pumpkin seed lengths on graph paper. Label thex-axis Pumpkin Seed Length (mm) and the y-axis Number of Pumpkin Seeds.26 CHAPTER 5: CHANGE OVER TIMEBIOLOGY LABORATORY MANUALCopyright © Wright Group/<strong>McGraw</strong>-<strong>Hill</strong>Copyright © Wright Group/<strong>McGraw</strong>-<strong>Hill</strong>Background InformationCharles Darwin was a naturalist who observed plants and animals in their naturalenvironments. He spent five years sailing throughout the world, observing anddiscovering a wide range of living things. During this time, he encountered manyplants and animals he had never seen before. He wondered why these organisms wereso different from those in his native England. Darwin’s observations led him to developa very important scientific theory: the theory of evolution by natural selection. Darwinsuggested that most organisms produce more offspring than are able survive. He alsosuggested that variations exist among the offspring, that these variations can increaseor decrease the offspring’s chance of survival, and that only the fittest organismssurvive to reproduce.This lab explores natural selection and how it leads to changes in a species over aperiod of time. As you will find, genetic factors and environmental factors affect theprocess of natural selection.Problem How do genetic and environmental factors change a species over time?Materials cards cards Procedure1. Before beginning the activity, title one index card Produces Offspring andthe other card Fails to Reproduce. Set the cards at your work station in twoseparate areas.PART A2. Use the two sets of cards to model a group of hummingbirds living in an area full offirst two in the pile. Allele pairs BB and BbAllele pair bba tally mark in Data Table 1.3. Choose an event card. An R card means the hummingbird reproduces. An F or Pcard means the hummingbird fails to reproduce. An Sfailure with a tally mark in Data Table 1.4. If the hummingbird reproduces, put the cards in the Produces pile. If it does not,put the cards in the Fails pile. Put the event card at the bottom of its deck.5. BIOLOGY LABORATORY MANUALCHAPTER 5: CHANGE OVER TIMEName Date Time6. Leave the Fails cards as they are. Do not place them back with the other cards.Mix up the remaining hummingbird cards and the event cards.7. Repeat steps 2 through 6 for the second generation. Then repeat steps 2 through 5for the third generation.PART BHow would the data differ if the hummingbirds lived in an environment in whicha short beak had advantages over a very long beak? Such an environment mighthave fewer flowers and more varied food sources. Record your prediction.8. Use the cards to test your prediction. Repeat Part A for three generations ofhummingbirds. Remember that an S card now means that any hummingbirds withlong beaks will not reproduce. Record your data in Data Table 2.PART C9. Use the Fails to Reproduce data from Data Table 1 to construct a line graph. Besure to label each axis, review the data before numbering each axis, and carefullyplot the data. Use two different colored pencils to represent the long- and shortbeakedhummingbirds.10. Use the Fails to Reproduce data from Data Table 2 to construct another line graph.Be sure to label each axis, review the data before numbering each axis, andcarefully plot the data. Use two different colored pencils to represent the long- andshort-beaked hummingbirds.ObservationsData Table 1: Trumpet-Shaped Flower EnvironmentGeneration12Long-BeakedHummingbirds29Short-BeakedHummingbirdsFails to ReproduceLong-Beaked Short-BeakedHummingbirds HummingbirdsCopyright © Wright Group/<strong>McGraw</strong>-<strong>Hill</strong>Provides sample extension activities.Student Laboratory Manual330 CHAPTER 5: CHANGE OVER TIMEBIOLOGY LABORATORY MANUAL176