Chapter-1 / Physiological Foundations - WHNLive Public Library
Chapter-1 / Physiological Foundations - WHNLive Public Library
Chapter-1 / Physiological Foundations - WHNLive Public Library

Create successful ePaper yourself
Turn your PDF publications into a flip-book with our unique Google optimized e-Paper software.
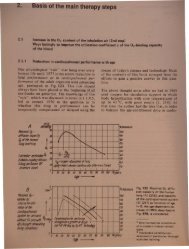
sand functl ni ove d cellular capillary wall switehilMJ mechani ofwith varying effects in the lung and other body tissue1.1 Ideas on the triggering of the switching mechanism of the blood microcirculati"on atvenous end of the capillariese basic effect of oxygen multistep therapy,the long-lasting increase in the arteriovenous O 2saturation difference of the blood (rt-effect),can, as suggested by numerous signs discussedbelow, be traced back to a cellular vessel wallswitching mechanism of the blood microcirculation,which can be triggered by O2multistep procedures, and which chiefly startsfrom the endothelial cells lof the capillaries.This switching, or regulating, mechanism iscontrolled bioenergetically, i.e. by the energeticstatus (hyperoxia and hypoxia) of the endothelialcells or pericytes of the capillaries, andoccurs in all capillaries of the organism simultaneouslyand concurrently. It therefore has thefundamental characteristic of a comprehensiveeffect.This mechanism is generally (but not always)reversible, i. e. the blood microcirculation canbe strengthened by the switching effect (positiveswitching, 11+-effect) or weakened by it(negative switching, 11--effect). We were ledto the discovery of this mechanism by theobservations already mentioned that it generallyoccurs in all capillaries of the human organism.Its effect is different in the lung and inother body tissue. In the lung the bioenergeticcontrol of the microcirculation leads to changesin the levels of the arterial P02, and in theother body tissues to changes in the venousp0 2. This mechanism is being discussed at thebeginning of this book due to its fundamentalsignificance for oxygen multistep therapy andthe research connected to it.The author obtained, in 1977, the first experimentalclue that a reversible switching mechanim of the microcirculation (in the lung) muste . t, from the surprising finding th~t thea e ·al re ting P02' which falls greatly 1D oldage, can by mean of an O2 multistep. procede of a total duration of approximately36 hours, be raised to levels otherwise generallymeasured in youth [3]. Further clues resultedfrom the course of the arterial p02 levelsmeasured after severe distress and subsequentcombat of the consequences of stress [20]. Thedecisive clues presented themselves early in1982 when it was discovered that O 2 multistepprocedures also cause a lasting drop in thevenous resting p02 [6]. In the course of thiswork, in interaction between literature studiesand our own research into the selective staunchingof the blood microcirculation in cancertissues using the cancer multistep therapymeasures [22, 23], increasingly concrete ideasof the cell physiology of the bioenergetic controlof the reversible switching mechanism ofthe microcirculation were developed.Stimulated by the intravital microscopic observationsof LUbbers and co-workers on theelectric triggering of changes in the crosssectionsof capillaries, caused by endothelialcells and pericytes [24], as well as by intravitalmicroscopic observations in his own institutethe author came to his ideas on the cell physiologyof the switching mechanism of the microcirculation[25] shown roughly and schematicallyin Fig. 1. It is assumed here that reversiblechanges in form, and swellings of the vessel wallcells (endothelial cells, pericytes, which are dependenton the degree of their 02 supply) influencethe narrowest inner cross-section of thecapillaries. This assumption is in harmony with. old experimental findings on thetransformationfrom an elongated to a spherical cell form epithelialcells) in ATP deficiency [26]. Electronmicrographs produced direct pictures of thenarrowing of capillaries due to swelling of endothelialcells in energy or O 2 defi i n h -poxia). The picture in Fig. 2 tak n from _r::;and co-worker [27] how the tag of initi 1swelling of the endothelial ell. It an n
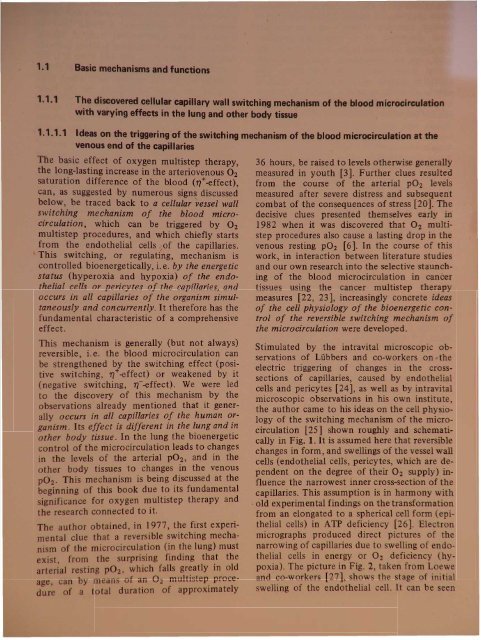
'7%ary O2 deficie.ncy causes on O 2 (energyJdeficit in the wall cellsa e ~enaus capillary end, which then swell and thereby lead toanarrowmg of the vessel with reduced bloodflow.Basic mechanisms and functions 7venous end 01 capillaryswollenwall cells'venulebloodflow Qreduced.Narrowing of vesselintensifies the above -mentioned Oz deficiency by:1. Reduced bloodflow Q2. Increased apparent blood viscosityTherefore a system with a sWitching property (changeoverwhen a th~eshold level is exceeded). The changeoverthreshold IS determined by the level of the venouspOz and its duration of influence as well as by theblood flow intensity.Fig. 1 Ideas for the triggering of theswitching mechanism of the bloodmicrocirculation at the venous endof the capillaries in 02 deficiency1 H20 flows into the cells as a consequenceof the failure of the K+/Na+pump, which requires a great deal ofenergy •alplliory wallcross -sedlon rt'tI(/c~d';.o.;.;:....-Wt--byswt>llingenergy-tieficiMtt'lJt!olhl'llol cellstarts to swellFig. 2 The elementary process of the switching andregulating mechanism of the blood microcirculation atthe venous end of the capillaries in the electronmicroscopicpicture. (Loewe et al. [24]. It was discoveredthat these swellings of the endothelial cells, if not yetat too advanced a stage, can be lastingly reduced byO 2 MT procedures. Blood microcirculation strengthenedin all perfused capillaries of the organism, weakenedin distress. L =capillary lumen; E =erythrocytefrom further photographs and measurementsthat there is always a transition to total occlusionby the swelling of the capillary endothelium.We could derive from P02 measurementsthat, up to a certain intermediate stage, theswitching mechanism remains reversible, andthis is the area ofinfluence ofthe 02 multistepprocedures. Here it should be noted that, accordingto the P0 2course between the arterialand venous ends of a capillary shown in Fig. 3,the bioenergetic control of the narrowest capillaryero. s- ection is to be expected primarilynear the venous end of the capillary, becau ethe lowest P0 2levels are to be found there. Ahigh proportion of the cell energy serves themaintenance of the sodium pump (Na+/K+ATPase, osmoregulation of the cell). In energydeficiency in the wall cells at the venou capillaryend, a reduction in the pump performanceoccurs and, with it, an accumulation of hydratedsodium ions [28]. The welling whi hthen occurs can be removed by the re torationof a good energy ituation (high P0 2_ n)'Further detail of th pathophy iology f thendothelial cells can be found in [29 30] and inthe literature reference 4 to 6 in [27].
8 1. <strong>Physiological</strong> fou~dationsmmHgarteriole240~~ILongitudinal range withbioenergetic control ofthe narrowest cross sectionIIrenu/e~kPaI-- up fa 350 32The bioenergetic controlof the narrowest crosssectionoccurs near thevenous end!2202001801602824\ ,201Pol'4012010080604020~\ \\\ ..,\.~,\\\ 14-12-"~~~36hra\ .l-o'u. ., rl/1,.... ISm/;, aMTI1TI'::::::: normal - - I --~ -o 25 50re/afire capillory len~~/I~ ..16S"'''-b . ()~!1T 4Mo'q..r ~I)g of. .c....oJ'J' ~J'q~cqPI#QI'.! ~,9r
10 1. <strong>Physiological</strong> foundations~~~If:-,,!' ~in;;,;;hl;.;;,m;;,;;·ti;:;,tJn~_1.... 4.1rIPt1.""':'·of blood flow ~8Frel---t......J. 10'" 10- 3 10-2 10-1lUa:r----T----T---....:;:..--~--~6normolsIttor sIressin the cDpillory•.#/.~ .M~~·~-+----+------t81O~~ 6~incrtJ: in 'Irtf ~t----+---t'-----JI----3Ir------l blood flow inhibitlD/1 18• P.feetiIxrIr cycleSNllchintl/l1K:tssI8f-mlucliOn.' t f .mcreose 0 'Irtf"copill,aryI .~ogreSSIve'BFrfducliOllFig. 4 The relative apparent bloodviscosity '1rel in larger vessels as afunction of the shear stress Ps forvarious levels of the hematocrit Hctaccording to Schmid&hanbein'smeasurements [31]. SF = bloodflow.1,3CPI- G8, Z 4; 6 8 101 2 • G8 ,0 2t!yn.cm-2~1 Effective hematocrits in terminalnetwork. Normal conditions:Hct :::: 10%. When microcirculationis inhibited, Hct becomes very high(50-75%)1.1.1.2 Differences in the triggering of the switching mechanism in the various organs and tissues.Relationship to the degree of effectiveness of the O 2 multistep therapy proceduresDifferences in the consequences of O 2 qeficiencycondition in various organs and tissuesof the human body on the one hand, and theobserved differences in the response for theelimination of O 2 deficiency on the other,stimulated us to investigate the (common)cause for these differences. The cause wasthought to lie in a vorying level ofthe switchingthreshold of the bioenergetically controlledswitching mechanism of the blood microcirculation.The effect of this mechanism, which occursgenerally in the whole body, simultaneouslyand equidirectionally, is superimposedonto the local regulation processes of themicrocirculation, e.g. through precapillarysphincters [32], which have been. known andthoroughly investigated for a long tlffie.At the venous end of the capillaries, where thelowest P02 level eXist~, the endothelial cells ofthe capillary wall begm to well due to waterabsorption in O 2 deficiency, becau e the K+INa+pump, which demands roughly 30% of cellenergy, diminishes in it perfor~ance [34]. ~hewelling lead to the cross- ectlOnal narrowmgalready discussed and, after the switching thresholdis crossed, to the triggering of the switchingmechanism.The swelling of the endothelial cells in O 2deficiency is at first of a reversible naturewhich means that the detumescence of the wallcells and, with it, a renormalization of thereduced blood microcirculation can be achievedby the production of high P02 level at thevenous capillary end (and of an increa ed capillaryblood flow, e.g. by mean of phy ical exertion)over a certain length of time (detume cence time). The further re earch into the parametersgoverning these dynamic i one of themost interesting tasks of the field of mi rocirculation,as the switching and regulatingmechanism described seems to be representativefor the uniform initial process in myocardial infarction,in shock, in peripheral circulatorydisorders, in damage caused by distress et '., a:well a , in the oppo ite dire tion ( hi 'h gr atlupgrades the mi rocir ulati n) in sportsstamina training and in th procedure var;' ntof 0 ygen multistep therapy. •
Basic mechanisms and functions 11e duration time for the high-charging of adowngraded microcirculation (detumescencetime) is determined by the therapeutically appliedP02 level at the venous capillary end.The O2 supply of the endothelial cells at thecapillary end by means of diffusion is dependenton this. From the measurements oft~s in Fig. 3 (guiding values) it emerges that,WIth the procedure variant with increase incardiac output by means of severe physicalexertion and P02-ven = 60 mmHg (8 kPa) thethreshold for high-charging will be crossed withsufficient certainty in 15 min; with the procedurevariant without increase in cardiac output,and P02-ven = 45-50 mmHg (6-6.6 kPa) inapproximately 36 h.The aforementioned P0 2 - ven levels are attainedusing the standard 15 min O 2 multistep qUickprocedure discussed below, and the standard36 hl18 day O 2 multistep procedure.From the theory of diffusion and from experimentalexperiences there results the followingrelationship for the effectiveness W of O 2multistep therapy procedures and of proceduresof hyperbaric O 2 multistep therapy:W......(Po 2 _ven procedure - Po2-ven before)n • tprocedureKey:P0 2 -ven procedure = venous Po 2 , measured duringprocedure with O2 application.This value is dependenton the arterial P0 2during the procedure andthe bloodflow Q in the capillaries.The Q-Ievel is roughlyproportional to the cardiacoutput and therefore approximatelytwice as highduring the 15 min procedureas in the 36 h procedure.The strength of themicrocirculation thereforehas a significant influenceon the triggering of theswitching mechanism. 1P02-ven before= venous Po 2 , measured beforeproceduren= efficiency exponent llIS 3.5;emniricallv obtained fromtprocedurethe measured value in ig.3 2 and the relationship ofthe duration of procedures= total duration of the 02MTprocedureIf, due to the named procedure variants or dueto their reversal in the direction of "02 deficiencyconditions over a certain length oftime", the oxygen partial pressure simultaneouslychanges at the venous end of all capillariesof the organism over a certain time span,a comprehensive effect occurs. It can be measuredabsolutely by spirometry as a change inthe resting O2 uptake or CO2 production of theorganism. Relative values of this change can begained from changes in the arterial and venousresting P0 2 (see Section 1.1.5).In the framework of the application of the02MT it is usually only the total effect that isconsidered in the judgement of the O2 situationand its dynamics. A more detailed evaluationwas made in [35].It is known that the O 2 utilization variesgreatly, dependent on the rate of O 2 consumptionin the individual organs and tissues. Thishas as a result that the venous P0 2 of the variousorgans and tissues shows great differences.The scale of P02.ven levels for normal youngpersons, resting, is given in Fig. 5 B, bottomrow. It reaches 22 mmHg (heart) to 68 mmHg(spleen). The mixed blood carried to the lunghas a resting P02-ven level of 40 mmHg, withphysical rest and compensated cardiac output.It is known that the mixed P0 2 - ven at rest decreasesto roughly 35 mmHg in old age [35].The reduction is obviously a counter-regulationof nature, to counter the severe drop of thearterial resting P0 2 in old age [37]. Correspondingto the reduction of the mixed P0 2 - ven of anaverage 5 mmHg at an age of 75 years roughlythe same reduction of the resting P0 2 - ven levelassigned to the organs and tissues occur . Thescale of the expected resting P0 2 - ven level forolder, untreated persons is given in Fig. 5 B toprow.The O 2 supply to the endothelial cell at thevenous capillary end depends on the level of thevenous O2 partial pressure. A high P0 2 • ven resultswhen a high arterial O 2 partial pre ure i1 The effect contribution of the optional adjuvant tep ofHOT- and hemodilution i mainly reflect d in an increaof blood flow Q.2 P. = 45 mmHg as umed for the 36 h procedur02-ven procedure
012 1. <strong>Physiological</strong> foundationsA. Clinical observationsafter 0ll1T treatmentremoralofarrhylhmJQsameltoratlon ofangma peclofls and-.shortness of breathmgIremoralatpeflpherol[lreulolorydIsorderstn Ihe legsamellorollonolnausea andClfculalorydIsordersimprovement oflung funcllon andreduction ofdyslrophlclIVer symptoms100mmHg1~(resflng) 50older persons 2untreated(7syrs,COP"" 1,1Imm-')B. Resting Po z -vennormal personsuntreatedJOyrs, COP"" 65Imtn-')Istomachmlesfmei r km40t(kidney)n prote~ - -\t,,\n~ -Oz\.S~'...o--80 I es\\O~J-"'" ~ L-I -=--_...l.-__---, 11WiO~I...-"In contrast 10 Ihe arterial Po -curve,0(...-"'- the venous Po----z- curve results 115 a ---10sum from many switching processes70 of the blood microcircolalion with variouslevels of the switching threshold in the960 ~__I L ~_va_r_io_us_o_r:;..ga-n-s-a-n-d-tl-ssT""lJ,-e5-0-f-th-e_h_um~a_n_o..... rQz...j'Q_n_ism....J0 1--~87'/- 20·/0 "'28%
Basic mechanisms and functions 13produced (02MT procedure with high O 2offero the lungt adapted to the respiration minutevolume RMV) and when there is a high capillary~lood flow Q (high cardiac output tphysicale. erbo~). The strength of the blood microclrCula.tlOn.therefore plays a significant role inthe tr~ggen!"g of the switching mechanism oft~e mIcrocirculation. The reason why a reduc~lon o~ the microcirculation (cardiac infarction,mtermltt~nt claudication) occurs more fre~uently. m older persons may be considered tohe ?artlcularly in the decrease in the nutritivecapl1la~ blood flow (reduction of cardiac outputwith age [37]) and thereby in the Po 2·ven·According to these explanations the scale ofthe resting P0 2 of the various o~gans and tissues(Fig. S B) gives us a clue to the mean riskfor the various organs and tissues in O 2 deficiency(old. age [37]t. stressful influences [20, 21].Accordmg to thIS compromise of the heart(myocardiac infarction) could first be expectedin O2 deficiency, due to diminishing of themicrocirculation, and then in the lower extremities,and also in the brain (circulatorydisorders, dizziness) and in the eyes. Correspondinglyit is to be expected that an improvementof the O 2 status with procedurevariants of the oxygen multistep therapy orstamina training, will help first the heart, thenthe lower extremities, as well as the brain(circulatory disorders) and the eyes. The aboveformulated rules give us new insights into themultifactorial process in various importantdiseases, suffering and complaints based onO 2 deficiency.Due to the discovered correlation between thequality of the O 2 status and the strength of theho t's cellular defense capacity [18], significantlocal differences in the strength of the defensecapacity dependent on location, can be expectedin the human organism from this viewpoint.Thi assessment carries more weightwhen we begin to take into account the localvariations in the defense cell density (differencesin the parameters of the capillary networkand the microcirculation etc.). Cancertumors can be expected to manifest themselvesmore frequently in parts of the organism wherelocal minima in the O2 status and in the defensecell den ity have existed over a certain periodof time. It i particularly easy to recognize 02tatu minima in the area of the skin, e.g. bymean of tran cutaneou large area measurementof th P02' Skin abnormalitie often formth ground of uch minima, which can bemade to di ppear or at lea t to weaken byo ygen multi tep timulation of the ho t'defense. Investigations of this type lead to aninteresting dermatological research area.The peripheral circulatory disorders in thelower extremities, caused by a deterioration inthe O2 status and often ending in the necessityof a leg amputation, are among the commonestillnesses of old age. This fact can be explainedby the low level of the resting P0 2 - ven measuredin a standing position, of this area of the skeletalmusculature, already discussed (see also Fig.S B), combined with the drop in the resting O2uptake of the organism, or of the cardiac output,to a level at the age of 75 years of 65 % or62 %, relative to the maximum (30 years).In order to round off our ideas, it seemed necessaryto find an answer to the question of whythis disease affects primarily the lower, and notthe upper, extremities, and why O2 multisteptherapy (and also HOT-UVR therapy) usuallygives unique aid particularly in circulatory disordersof the lower extremities (Fig. S A). Inorder to answer these questions, measurementsof the resting P0 2 • ven at the upper and lowerextremities were undertaken, in a standing position,the mean levels of which can be found inFig. S B. As our ideas had led us to expect, itwas found that the venous resting P02 in thelower extremity is significantly lower that inthe upper (measurement in a tanding po ition),by 7 mmHgjO.93 kPa). This result explain thepreference of the lower extremities in thepathogenic decharging of the microcirculationin the skeletal musculature, and in the therapeutichigh-charging.Within the framework of these investigationwe gained information about the cour e of thevenous resting P0 2 and the blood microcirculationin the lower extremities during the pathogenicand therapeutic proces es, ummarized inFig. 6. It may eem di concerting at first that apoor O2 supply to the capillary wall cell canexist with a high level of the local mixed P0 2 - ven(Fig. 6 C) and conversely, that the be t O 2supply (Fig. 6 E) can occur with a parti ularlylow level of the local mixed p0 2 • ven ' The eparadoxical findings can be explained b achange in the diffusion area a a function ofthe nutritive blood flow Q, whi h i er low inthe fir t ca e and very high in the e ond ( eealso the abov relation hip of the effe tivenof 02MT procedure). The dynami of thmicrocirculation al 0 contribute to th fa tthat, in th P0 2 - ven control of th di 0 r dwitching m chani m, the Po 2 - en 1 el f thwitching thr hold for th low ring r rai ingof th mi rocir ulation ar ery far apart (Fig.6, right).
~~6050~NtJnnoI aJntiilion(un/mImi)8.1rJtuition to0, deficiency(/rfore IVl'fJIfeRlng)c. ~ ti'fI~IK''y trJIltltliJn D.lkfortandtlunilg0, MTprocedure(after IlIf(JRenlilg)-- -----Eo ~ SurplusantiI!iJRftransilton MtNnil1l)/slrengllM'l1ilf) (Of/wslr~t!ll'nigofmi7ocituloliJn)rt'Sulltng mluelmn tm7/uly {}z1fT mollllily mue/ionct't1Sl'SI .. I I ...... , -....:.-----strmol!leninJ flnsllfJld._- 1 (/0It'e!"extll'mity)increas'!- - 7' A;;;C;;'pared Dd mlcrDClfe!!Jt!!1."'J---6bxiIIICnx:1ffi1'otion f1 rrI ,I~---------I"/6'I ~I~JJ.'~~"'/,~ II pOz-vm, 10000exlmnlly ~....... IIIq.."(WI1ll fmK¥rJIis)If)~l\et1/(eni/lOIImIKidLQP Or "",~::r,:-.(Ii»Itr !X/remilft /~...q.~:-...20IKJV' ..............,/~IIf------- I~- - - - -..I':J~PJOr l??- utilizationot ...g«Xi Oz -utIlizationg~~'O!tI~~""U:r-< VIoc.o(')Q)-+.oC:::J0.Q)-o:::JVIincreasIng I/osculor congesliJnin fronlofIlle constridiOll due toslVt'lltilg ofMIllcells ot1m- venous endoflitetlljl/llories#7mrlselilllletI,IJ,lJoll'ntIJItxJdviscosity..De~/e /i7t:rease til Parrenjloor 0 sUjlPIy toco,oi/laryIt'llilcells tlnd lissue.Reduced micrOCIrculation.HeduceddiffUSIOnsurface,The extreme increase in!'orren I despite intliallylow microcirculafion,lfodsto reriuced swelllflgofwallailsof the reflOUS cuplilor]end.Despite rl'duetm ,n ~-ren.verygood 0;-Slippl1 toCll,tJlllary wollcrlls anti tIssue.intenSIfied mlcr(){Yrculaloncauses Increase mitffuSIOnSUrloce.Fig.6 The course of the venous 02 partial pressure P02-v and of the blood microcirculation Q in a particular body tissue in the transition from the normal condition(A) to 02 deficiency (B) and the 02 deficient cona~~on (e), as well as during (0) and after (E) the reversion of the detrimental state by 02MT, exemplifiedby a lower extremity. Guiding values and speculative ideas
500r-T_-+5__r-_-+1O__,....-_~15.1O-3"'0;/'"blood1lN11A;4~ Bunstn sol"biolyCOffficitnl ~. aO~mIO;lml...""'iI'-+6O'-i--j----t--t---I-------J 55350r--r--+-_-j__-+-~5045range U1!nogO;HT IIuie/(procedure (15min)302550P Oz - ren1501 --r--;.---f---+__+--_-----t-20 range f/JU:i!lgIallfT cureprocedure (J6lJr)1001--rt--t---t---+-----j__--1 15Po;"ven I [f/UidrprOCeriurtl'r---+--tiuring O;HTtcure~tiureo---;;-';;:;:-----:-::::---;:l:=--~--l---...Ja25 as a75 1.0 1.25 15 vol %01~ ~nlrati()nIyoo(19. indiridualsandtiller Oz f1T10 normalorea (arl)oldtr indiriduals5 I ntrlTKJlfOf1(Je (ven)Offer 41fTFig. 7 The physically dissolvedO 2 fraction in the blood as afunction of the arterial (venous)oxygen partial pressure1.1.3 O2 binding curves and exhaustion of the O 2 binding capacity of the bloodAlthough only very small amounts ofO 2 are dissolvedin the blood, the physically dissolved proportionis - as emphasized above - of decisivesignificance for the biological effect and therebyalso for the 02MT, as only the dissolved O 2 moleculescan reach their reactants and thus undergochemical binding.By far the greatest proportion of the oxygentransported with the blood is chemically boundto the hemoglobin of the red blood cells [33].The reaction of the oxygen with the hemoglobinHb + 4 O2 ~ Hb(02)4follows the law of mass action. It is thereforethe physically dissolved O2, which, accordingto Henry' and Dalton's laws, is proportionalto the P02 level, and determines the proportIOnof the hemoglobin to be tran formed intoo yhemoglobin. The proportion of the oxyhmoglobin in th total hemoglobin concentratIOni termed the O 2 saturation of thehemoglobin:[Hb O 2 ]S02=------[Hb] + [Hb O2]This connection between the O 2 partial pre _sure and the O 2 saturation of the hemoglobinis expressed by the O 2 binding curve of theblood. As Fig. 8 shows, th~ curve is S- haped,the steepness being dependent on variou para?1eters (.temperature, pH, PC02)' Fig. 9 givemformatIon about the characteri tic of the O 2b.indi.ng curve (P0 2 range) between O 2 ab orphonm the lung and O 2 delivery to the ti ue inhumans (normal and resting condition ). If, ain accordance with this figure, a mean arterialP02 = 95 mmHg (S02 = 97 %) and a meanvenous P0 2 = 40 mmHg (S02 = 73 %) are a _umed, the content of chemically boundoxygen in the arterial and venou blood an becalculated at about 20 and 15 vol. 0, re pe tively.The arteriovenous difference of the 0concentration is therefore 5 vol. %. 0 n rmallyonly appro imately of one quarter of th t talO2 binding capacity of th blood i ploit d
Atempera/lJre dependency2 4 6 8 10 12 14100rl--l..-I:::+::~~~%8,PH dependency2 4 6 8 10 1 14100 r-...,......L.-,-L--+-....L..,.......l.......,..l...-_%Basic mechan isms and functions 1780 t-----i--+-#-..4--60 t--r-t--+---t---+--+-~T:3rt40r---tt-f-t----1--+----l--120 r-..,....,.--j---t--+------1-~20 40 60 80 100 1200 0 20 40 60 80 100 120P02 • P 02 •CdependencyP C022 4 8 10 12 14 kPa%80 t----+----,~60 80 100 mmHg...Fig.8 O 2 binding curves of the blood at varioustemperatures (A), pH levels (B), and CO 2 partialpressures (C) [32]. For simplification, here and inthe follOWing curves of this type in the book thesmall a/v shifts of the O 2 binding (dissociation)curves due to different CO 2 contents (Bohr'seffect) are disregardedin the circulation through the tissue capillaries.The degree of exploitation of the blood in theindividual organ , according to Fig. 9 and etion 1.1.2, varie greatly.1.1.4 Increase in the O 2 delivery to the tissue by means of artificial reduction of the O 2affinityof hemoglobinOne method of significantly improving thearteriovenous exploitation of the O 2 bindingcapacity of the hemoglobin is the artificialreduction of the O 2 binding capacity of thehemoglobin in the red blood cells, for approximately60 days. In addition to other substancesuch as 2,3-diphosphoglycerate (abbreviationDPG) [39], the equipping of the erythrocyteswith phytic acid (ino itol he apho phate abbreviationIHP) [40] i particularly uitable forthe reduction of the O 2 affinit. in 'e IHP, dueto it strong negative charge do n t p netratethe erythrocyte membrane, it i n 'e 'ar' t incorporatethisubtanc a ordingt [41,4 ...],e.g. in liposome , and to bring it int th r dblood celL in thi way [43 44] or t mbark
~IUI1!J ~atpWorMs---~~·tIIlDkeJ \IUI1!J:1iojItff htarl8c~ ptJrlil/lptPJSlUD/orItrits~7trJPItv;sv,~3.sIttItIiI~ 3/i$sueIhtorllininIh"!'~·rtIitJa)renae ctmltanir9rt htorfI'" Vo 20 40 60 80 KJO 120POI •.. 1\.Fig. 9 02 partial pressures (A) and C02 partialpressures (B) of the blood in the variou~ sectionsof the circulatory system under restingconditionson chemical [16] or other ways to overcomethe membrane barrier, without losing the IHPeffect [45]. Because of its complicated natureand the fact that it is effective for only 60 days,this method has not as yet been of practicalsignificance. It should be pointed out in thissection that, according to [46], the DPG concentrationin erythrocytes is increased byroughly 20 % by intensive physical training.Next to the slight shifting of the O 2 equilibriumcurve to the right, caused by this, a flatteningof the curve and an increased venousresting P02 can be observed in competitivesportsmen.1.1.5 The determination of the resting O 2 status and further characteristic values1.1.5.1 Definition of the resting O 2 statusThe absolute characteristic value for the restingO 2 status be defined as the spirometricallydetermined O 2 absorption of the organism viathe lung under conditions of physical rest.Strictly speaking, the O 2 absorption is given asthe sum of the two contributions Q02 andQ'02, with Q02 representing the O2 transportto the organs and tissues by means of O 2 loadingand O 2 discharging of the hemoglobin inthe blood circulation, and Q'02 representingthe O 2transport by direct O 2 diffusion fromthe lumen of the arterial vessels to special tissues(e.g. arterial walls, vitreous body, cartilage,etc.). As Q'02 < Q02' it is generally sufficientfor consideration of the balance, to use Q02alone as an (absolute) characteristic value forthe resting O 2 status.he numerical value of Q0 2 is, according toble 2 a product of three factors. Fast andgr at f1~ctuations are only observed in the firstfactor, the O 2 saturation difference 1'1 of theblood. The momentary resting level of 1'1 istherefore a relative characteristic value for themomentary O 2 status, with information contentofhigh diagnostic significance.The second factor, the resting Cflrdiac outputnormally changes only slowly with training conditionand age.The third factor, the hemoglobin content Hbof the blood usually remains roughly constantin the individual case, also over longer timespans.11 The hemoglobin content is known to be temporarilyreduced to roughly 66 % of its starting level,with the hemodilution method [47). Nevertheless, asignificant increase in the 02 transport to the bodytissue results, particularly because the venous P01drops, and the great increase in T} and in cardiac outputwhich then occur, greatly overcompensate for theinfluence of the hemoglobin (hematocrit) reduction.
Table 2 The quality of the 02 status is approximately equal to energetic state02 transport into body tissue 02 consumption in body tissue:00 2 [I 02/min ] = 11 x COP[llminl x Hb[021The meanings:Basic mechanisms and functions 19=Utilization (degree of exploitation) of the 02 binding capacity of the blood measured at restA relative characteristic value, usually applicable for diagnostic purposes, as the resting COP usuallyonly changes slowly with age and fitness, determined by means of the 02 binding curve of theblood, using measurements of the arterial and venous resting P02'COP =Cardiac output (at rest) =stroke volume SV x pulse frequency f.Determined, e.g. by spirometric methods, reduced with age, but regenerable to some extent by02MT + exercise.Hb= Haemoglobin content of the blood. In the individual roughly constant ~ 160 g Hb/I (1 g Hb binds1.34 ml O2) ~ 0.2144 I 02/1 blood.A60Measurements of thedoily 2+-h cycle 50of the 02 -saturationdifference Vin theblood in aheallhymole (39 years)frea ted with O 2 Hr.The deYiafions of'lare largely cond/1ionedby alterations in the '1venous resting pOz 20and are roughlyproportional to thedeyiations of 0/ up/oke10/1st maximum....tirednessIfalling asleep.~-I2nd maximum/1\J ,1\VJ 1\ /i'v ~~ I \Vnoclurno minimumap~rox. 3hrs afterfa li~asleep (phose of- poss 't nocturnalcnmJo 681012 141618 20 22 24I2I4 6hB30%20Representation of the 70doily 24-h cycleof the mean PhySiOIOgiCal1 0performance -70capacity L accordingto 0. Bra! [el 481. -20P stands for percent P-30of yoria/ion fromdoily mean.-50earN I measuremenf san f dar, d meosurement1sfmaximum ~lI "- I -2nd maximum/ f'.I-- ,"- ...V\\~J~ I\ I\ 1/-60681012 14 16time of day18 20 22 2426h. and two minima of the energetic status in the daily 24 hour cycle is clear-Fig. 10 The occurrence of t~o md~;;::nce '1"1 (A) and also in O. Graf's findings on the course of the mean physiol-Iy reflected in the 02 saturation I r " ,ogical performance capacity (B)
y r na onabS,olu'te clla.ra~t ri tic value Q0 2 and thereillti"e r t t value '11 of the resting O 2ignificantly in the course of theCU'lcadian cy 1 . Figure 10 A shows a measure~~~~lln eJtamlP:l of 11 for this. In Fig. 10 B ourme:asluement i compared with the circadianm of the mean disposition to work ac·n to O. Graf [48]. For the establish~enttherapy effect, the resting Q0 2or resting'11 me ur ments before and after treatmentould always be undertaken at the same timey (and under the same external condiion). We recommend the standard measurementto be taken at 15.00 hours (14.00-16.00hours), at rest and in a sitting position reprentative for the approximate minimal ievelbetween morning and evening. An earlymeasurement at 9.30 hours (7.00-9.30 hours),accomplished under the above-mentioned conditions,seems to be representa ive for e ma mal level between morning and eve . g.If the unique opportunities, which lie in edetermination of the resting O 2 tat fordiagnostic purposes, are to be used, it i particularlyimportant to standardize the time of dayfor the determination (e.g. 14.00-16.00 hours).The deep minimum of the O 2 status approximately3 h after falling asleep is noteworthy inFig. 10. It is the time point at which circulatorydisorders, cardiac arrest, myocardiac infarctionin risk patients occur with greater frequency.The low level of this nightly minimum canusually be somewhat countered by a cup ofstrong coffee immediately before falling asleep[49], and strongly countered by a lasting improvementin the O 2 status with the aid of theoxygen multistep therapy.·1.5.3 Determination of the arteriovenous saturation difference 11 at rest as a relative characteristicvalue of the O 2 statusThe determination of the 11 level is one of themost frequent and most important tasks in theuse of the results compiled in this book. It hasthe advantage that it also shows the restinglevels of the arterial and venous P02' which areoften highly meaningful on their own. Thedetermination of the relative characteristicvalue 11 is usually sufficient to make a diagnosticassessment of the patient's energeticreserves, to record the consequence of stress, todocument therapy results and to decidewhether a repetition of the therapy is necessary.By measurement of the arterial and venous P0 2in conditions of rest, the two working points onthe Hb0 2 dissociation curve of the bloodown in Fig. 11 for normal conditions (T =37°C, pH = 7.4), are determined. The utilizationfactor of the O 2 binding capacity of theblood (0 2 saturation difference) in each casecan be seen from the position of the workingpo·nt. ive examples of the positions of theor ing points and l1-values before (0, I, 2)a dafter (3, 4) implementation of the O2ult" tep procedures are shown in this presena·on. elp is given in Fig. 12 in the form of anomogram for the determination of the factor'11 of the 02 binding capacity of the blood,del)endelu 0 P0 2 - art for various level of thed nt I Po 2 -ven.. C 0 put ( 0 ) i the product of thestrc)ke v I V. n th pul frequency f. Inro volum remainunjintl.uelrlced. h naturel counter-vir:tnJllllyregulation in l1-changes almost exclusively takesthe form of adaptation of the pulse frequency.It is therefore usually sufficient for the stricterassessment of the relative O 2 transportation, toknow the value of the relative pulse changef + ~fkf = f in the corresponding change of 11.Measurements of the l1/pulse counter-regulationafter O 2 multistep therapy are summarized inFig. 13. The measured relative drop in the pulseonly reaches a level of kf = 0.91, even after atripling of the l1-value. The 11.value thereforelargely determines the volume of the O 2 transportto the body tissue under normal conditions.With this approximation, further discussionmay be limited, as a rule, to the considerationof the 11 value and its dynamics. Only inconditions of weakness with very (too) lowl1-values « 15 %) is it necessary to take intoaccount the fact that the organism then reactsfor a limited time with a significant increase inthe cardiac output (increase in pulse frequen )in order to ensure a level of O 2 transportationQ0 2 that is just adequate. Examples of thi arcases 8 and 10 shown in Fig. 1S.Although the method and technique of d terminingthe arterial and venou Po ar dicued in depth later in th boo it mnece sary to m ntion at thi t g th hith rtoapparent prin ipl diffi ulti . Th uffi i ntlaccur t m ur m nt of th r ti ~ itoday probl m fr u ually m d fr m
g --§f~'.J e.90 I I80 I Imean venous mixed PO 2arterial resting PO 2at.of= 7Syearsin youth or offer Oz MTnormal or alter in older age =75years100 t t distress ~ ~ normal i0/ 0 ledI C!ffer ¥ 0", (gain canlribuled byI dlslress 0 AAT arterial side)-t-- r z"',I II I . . (I ." =20% ,,::& 20% =:narmalfortI 7S years ofage)e ---- - - - -- 60/.-- - - - - - -1- -} (confribulionby70 I i 'I. 0 Oxygenabun(1)I ----------- -----------(J) ~ -i----- "'l ,;,. 26 °10 (by O 2MT I renous side)1501 : II'l =- 500/"50240\--l--+-I---.l---+----+--I---+---t--t---t---r---r--"""1utilization of the Oz-binding copacify 7lin anormal person of about 75yeors0123combination af stepswor~ingI "lpointsIduralionaffer severe c unlildistress (crisis) d 13 °10 rehabili(example)fationbefore 0 2 !1T/perma-26'; nentafter permanentdoily inlake ofOxygenabundI: ~lpern>7.20% nentI ~I4-after 36 h 02 HT I=a +20 /perma-9 +26 nent50°{,30 I I I I I I I I I201-1--4:::2after 15min 02 HT =a +20 IpermaqUickprocedure 9 "26 nentvarianl 6K 2-1=48'r..10lZ:o1020304050 6070pOZ ..8090100110120 mmHgOztransport to Ihe body tissueaD -rt· K j Kr::: 0.9 -1.3(the ,Jelor Kconsiders changes of the cordiocoutput and the pulse rate )Fig. 11 Changes in the utilization coefficient '11 of the 02 binding capacity of the blood exemplified in a 75-year-old male subject before and after 02 MT treatment(either variant GK 4-1, or GK 2·1)Q)::J(J)3(J)Q)::JQ._IC::J().-+o::J(J)N~
100907065"I 4y iological foundations2 4 610• .. 12 14APaI" 0.'/,/I"~.V /",,- ::r 22.5 emrpiriro/ IMIss.:,~1 /~-- --(ar. Lulalion reserves)0 .............. ~ • 25~I//'/r-"• 27.5Ius ofhosts rieknce/staQ,............--- ,. 30 ~0~Jca'/ / /" -eserves extremel,y/'" .......-- ~325 IHS1.~ JVi./ /" V-~- 35 /rig.............30rJpadfy anddrculalion'I / ~~ d~ 'feriorofion~~ VI~ ./20- 45notVI VI V freeofphysical~ ~rpI'!ints/V - 50 "'''!';./ ~isRofd,.O(llllgt>ITJ,tT!JOI1."Ii " mitofinslifficie«y ofrest .)VIIII~~ V ..... = 60I(hirghesf tolerable value)V ~ ~l./o KJ 20 30 40 50 60 70 eo 90 100 mmHgP01-fTt/~-'" ~ .../ "'~rven(f.\'lt. l;....---- 10--I- -• 15mm,• Tl5V P ..............--- =20I ~--~I I II/ /~/'" ~ .. IMJ~ - 37.5Fig. 12 Nomogram to determine the utilization factor 11 of the 02 binding capacity of the blood as a function of thearterial 02 partial pressure A0 2for various levels of the central mixed venous P02 . Hb02 binding/dissociation~rt ~ncurve for 3rC and pH 7.4tof--~-- -- --- lift~I When 11 values have sunk so low, a significant increase in the cardiac output (pulse) normally occurs, with the resultthat the values in this scale shift correspondingly to lower levelsof blood which, immediately after removalfrom the "arterialized" earlobe, is put on theindicator electrode of a universal P02 meter.undamental difficultie were seen, however,in the que tion of the sufficiently representaiveme urement of the mixed central P0 2 -ven·he greate t problem wa that no way couldbe seen of including this value in the routineblood analy i . So the determination of themixed central P0 2 - ven ha been greatly negI c d in medicine. Two rea on were par-.c I rly deci ive here:I. e m anitude of he P0 2 -ven m d toIV Ii I inform ion b ca it w u uallusumled h h mi d central v nou P0 2was subject to only slight fluctuations(around 40mmHg ~ 5.33 kPa).2. The theoretically nece sary central measurementof the mixed venous P0 2 involves considerablerisk for the patient and i laboriou. This procedure wa never con ideredfor routine use, and as re ult the trong andcharacteri tic reactivit of the mi ed entralP02-VeJ1' di cu d further belo remainedundiscovered. Why should a value be meauredwith risk and considerable effort( we p-in cath ter) when it wa generallcon ·d r d to b of littl int r t.v n in th inv tig tion of th ffe of th• m thod (r inf ion f th pati nt
ItBasic mechanisms and functions 23rtla#irr cIIonge in pu/$l kf I 150r-I-t--+-+--¥_~~L_-+---J4Or----r----i----+----Jl~hJ.C_--- -;----+----l.Pz-transport to body tissuemine!8010I:I ~(puISI'2010. Qo .... "·K= n·k, r)r------::lM"
1. hy lologlcal foundations70"''''JIg60so'ndo!quldptDCttjJ"flUI I I I'""Yf$, sfJDrlsmDn, all" 200W- 30mlnConly $Irain,no O,!1TJ.tm, , metllUflllllfltk8610ox,' ~ JC-"K- '-'- .-.-x-.-.- -.-'-j ....l:to ". C)o.. ...........31].')J tOOt!18 .•..~ __4x'6' .. --x"53....60?Sl.e! SOW--1-_-""0- .!..zI--66].~ 100Wo 20 60 180mm 1t ..2Fig. 15 Measurement of the \l8nausperipheral Po 2as a functionof the time t after ending of 02MTquick procedure in various individualsat different strains. Result:the appropriate time for measurementof PiO~ovenis one day afterend of quic procedurex' x-, 1 Slight strain relative to age;quick normalizationblood after its irradiation with short-wave UVlight) [50], we found typical regularities in thebehaviour of the P0 2 - ven measured peripherallyfrom the vena cubitalis (no tourniquet!). Theobserved dynamics of the P0 2 - ven , measured inresting conditions from the arm, indicated thateven this simple procedure, which is routinelyreasonable for the patient, can lead to sufficientlyrepresentative values. Therefore, thecomparison at rest and in normoxia betweenthe mixed central P0 2 - ven and the peripherallymeasured P02-ven was carried out as summarizedin Fig. 14 [51]. The volunteers werepatients from the Radiological Clinic of theMedical Academy of Dresden or CMTI patients,in whom due to other indications anintracardiac catheter had already been placedin the arteria pulmonalis or the right ventricleof the heart. From the minor deviations found,it follows that the relatively simple measurementfrom the arm generally supplies sufficientlyrepresentative values. The deviationsremain small as a rule, compared with the great,reactive changes in the resting P0 2 -ven discoveredand described below.Since these great changes occur due to the discoveredswitching process of the microcirculation,the sufficient correspondence ascertainedICMT = cancer multistep therapyin the tendency of the courses of the centraland peripheral P0 2 -ven values, confirms ourstatement that the bioenergetically controlledregulating or switching mechanism ofthe bloodmicrocirculation occurs generally in the wholebody (also in the arm).It should be pointed out here that deviationsbetween the levels measured from the unrestrainedvena cubitalis and the levels measuredcentrally from the arteria pulmonalis ofabout the same low level as in Fig. S, were alsoreported in [52].It should be emphasized in this context that alocally (peripherally) determined fl can also bea characteristic value of the circulatory regulation(e.g. for blood redistribution). The evaluationfor fl must therefore occur in connectionwith the physical situation (field of furtherresearch).The blood samples for the measurement ofP0 2 - art and p0 2 • ven should be taken after10 min complete rest (no physical activity nospeaking, no stimulants such a coffee orsmoking) from the sitting individual and a faras possible at the same time of day, e.g. 15.00hours. In the determination of the Po 1-art atime span of 10 min between the applicationof the hyperemia-inducing ointment (.g.inalgon forte) to the adobe and th follo ing "arterialization", mu t b allow d for inany ca ·e. In particular, it mu t b r m mb red
YeDrsNo. ofsessionsNo. ofrepetitionsaft" CUrt pfDteduftIW1fk ZWHks 'monthBasic mechanisms and functions 25ording to Prof. Dr. med.h.c.Manfred von ArdenneNo:Sex·Toto/lIO.ofhDul5Toto/ lID. ofminutesmm IIpodiyisf"ngDecrease ofcirculafion re~fl'tsD~drisk 1Iof arleri rClerosis40. so...--I --II .... Very hi...... ...lI'l ....0-: .a. ......... }mmune defense much lowered~ 7 0.., orrl, I-- lJDily Ii'Ie III'.'free ofphysical complaints"''o'"qIlDl'/q~' 11 {o~..,..14-- }ncreastd circulation risk4"11)~",i.D1b/i¥. q",q'~01'/..,.. o,9/t-OI lP""'.r ~ 'requent prolonged. dizziness.o~ 0,9..... i4-- damage to "fOllS I1 Riskof(my«Dldiac in"',,-I,
CII'Cli8LC outl)ut VAr;lllil i e re-QUired acc:orcllina exe t'on. cme,asureulen'ts 0 the co e of, an in erval ofe e d of t e proceduree for measurement._ nt given were carriedon he me ( y the right) arm. In pat'n ith single ided exertions or treatment,me urement from the vena cubitalis of theo her arm should also be undertaken, in orderto ta e into account the "vegetative asymmetry",to which A. Pischinger [53], in particular,has drawn attention. Findings of this typeshow that the energetic (i.e. 02 sensitive) controlof the switching process of the bloodmicrocirculation is to be seen as standing ininterplay with vegetative-nerval and vegetativehumoralregulating mechanisms of the peripheralcirculation. This viewpoint could explainthe effect of various stressful factors, such aspsychic factors, on the size of the arteriovenousO 2 saturation difference 11.The procedure success is objectified frommeasurements after the implementation of theO 2 multistep procedure, the result being recordednumerically both with reference to theincrease in the resting PO Z - art (successful regenerationin the field of the lung-heart system)and to the reduction in the resting POz_ven (improvementin the O2 utilization of the otherbody tissue). The patient record shown in Fig.o e ae teredotimeseve:rely re fevent, e e y a inf4~ctiO, ope a ·0etc., it can be q anrta ·ve y j dged ether arepetition 01 the O"MT procedure . to beadvised or not. Furthermore, ch measurementsmake possible a statemen as to ethergood P0 2 levels can be brought about naturallyby a change in lifestyle (e.g. transition tophases with daily heavy physical exertion).The measurement of the resting P02-art alone isoften sufficient as a basis of the decisions to bemade, or for controls, because the inversechanges in the resting P0 2 - ven are triggered bythe same capillary switching mechanism. Theirdynamics are therefore an approximate mirrorimage of those of the resting P0 2 -art" Fig. 17shows an example of the implementation ofafavorable lifestyle over a longer time span withreference to the Poz-tUt by means of interplaybetween measurements of P0 2 - artand countermeasures.The opportunity to record quantitativelymomentary energy reserves, indications,therapy results and cure successes is a fascinatingadvantage of oxygen multistep therapy.Figure 18 shows an example with arterial andvenous Po z values before and after 02MT,dependent on age. The improvements in thevalue of 71 are to be taken for this example fromFig. 19. The example refers to cure patients inneed of therapy, for the objectively and sub-f:'b 1 -f11807S10'Iilo.~, ~1\ 1/ 73'\..J," I ""J ~J1\12"- '{ I\. \ 1/"'JV1-77•'"~O~M~~~~~80~~~wm~~~~.~~_1--.....FI . 17 Example of the reactivity of the lung-heart sy tem, and of healthy Po.,_rt_Contr~1I d Iiof ch of the a"erlal restingPo 2In a 72-y.ar~ld man treated with the"'2MT, Vlrlant Gx t (I,) or I common cold Infection (c) folloMd by re neration me ure (b, d, f, )kPtz
Type of Oz supply QO zDec/slYe for lhe Oz transport /0tissues which are supplied by•orlerial" Oz diffusion, e9arlef/olressel walls supplied from Ihe lu·men, vitreous body of Ihe eye etcSiandard curve (loew and Thews)for heal/hy personsooyenWithout oxygen mullisieptherapy (far compaflson)20•~r--..oiw-.(l~~~L_-I---Sfandard curye.... ..•• • • • •• ••• •• •• ••• •40 SO 60 • 70 80age ..90 yrs(Hithaefer et.al)for healthy personsMeasurement ra/uesbefore therapy 0after therapy •(21, hlater)Fig. 18 Measurements of the arterial and venous oxygen partial pressure before and after oxygen multistep therapy(usually variant GK 4-0, dependent on age, in patients in need of treatment at the sanatorium of Dr. H. Wolf, BadIIdungen, FRG. Results of 72 successful treatments. Number of failed treatments: 8 (= 11%). Measured values incomparison to the expected values (standard curves according to Loew and Thews and Mithoefer, respectively).ncreased 1) (02 uptake at rest) by means of therapy from 100 to 230% (80 patients; 1985). The increase in the~ uptake, or in the C02 release, is approximately half of the increase in the value of 11 (see appendix)jectively strongest effects of the 02MT are notto be expected in individuals in full possessionof their physical strength, but in weakened, illor suffering patients.tudies on the effect of O2 multistep therapyhould therefore be· performed on physicallyweakened subjects1, e. g. on patients in clinicsand anatoria. This view is confirmed by themea urements and the course of the two expectedcurves in Fig. 18. Both fields here, withthe values measured before therapy, both below(PO:z- ) artor above (P02-ven) the respective ex-IBut not on permanently bedridden patients whoincapable of ufficient movement (lack of the 3rdp of therapy; for such patients, HOT· is indicatedn adjuvant step)pected curves (with their in place very highlevels of the resting P02-ven)' are an expre sionof the weakened condition of mo t patientstudied. Fascinatingly, it can be seen here thatafter O2MT treatment the mea ured value fornearly all age groups can on average be found tobe way above (P02- art ) or way below (P0 2 - ven )the respective expected curve. The mean increasein the P0 2 - art here is appro imatel10-20 mmHg (1.4-2.8 kPa), whil t the meanreduction of the resting P0 2 - ven i appro imately10-15 mmHg (1.4-2.1 kPa). A very significantincrease in the O 2 status (Tl-value) of thepatien ts is reflected in these numbers, rr la-"ting with impr ive record of obj ti e andsubjective improvement in th ndition ofh alth of the individual patient. Imo t thsame re ult , admitt dl with a mall r numb r
-'0 y 101091cai oundatlons80%6050l~'lJ)20.. • • ••••..,t..- • •• • I., •• I·• •I-,-I_ -••p••••II. •t.-....I: •~ 0 ••0• ••• • • 0• • • • ••-'" • •,.0 ,..• -. -0~,..20 30 40 500.~ -0 000• •0 00 o~ .0 000 o __B0,--o off' c~ 0- -0 00o~ 0 o 0- 060CIfJt --....... -~ g ~oooo qp 0 070Fig. 19 Measurement of the utilizationfactor 11 of the oxygen binding capacityof the blood before (0) and after (.)02MT, dependent on age, in 88 patientsof the sanatorium Dr. med. S. H. Wolf,Bad Wildungen, FRGof patients, were achieved in another clinic. Anaverage (lasting) increase in the arteriovenoussaturation difference 11 from 100% beforetherapy to 239 % after treatment occurred inthe Bad Wildungen group of patients. In asmaller patient sample in Bad FUssing the increaseafter therapy was 230 %. It can thereforebe established that in patients in about thesame degree of need of therapy the same improvementsof the O2 status to about 230 %occur. In healthy volunteers and with the sameP02 levels as in Fig. 18, the mean increase dueto 02MT would be 133 %.The therapy effect in healthy individuals isthus, according to these measurements, onlyapproximately one quarter of the effect inweakened patients.It follows from this that in the testing of theeffect of the oxygen multistep therapy, thecomposition of the patients' sample plays adecisive role.1.1.5.4 Determining the resting O 2 uptake of the organism as an absolute characteristic value ofthe O 2 statusIn the framework of research and in specialcases in 02MT treatments, when cardiovascular·training is combined with the procedure andthen the resulting changes in the cardiac outputare to be documented, a codetermination of theO 2 uptake, at rest, of the organism almostbecomes a necessity.A series of methods, invasive and non-invasive,has been designed, e.g. [56, 57], for the directdetermination of the cardiac output (at physicalrest and under exertion). After previous experimentswith the impedance-cardiographic method,which proved not to be particularly suitedto the determination of absolute valu s of thecardiac output, the spirometric unit in Fig. 20was developed for direct measurement of theresting O 2 uptake. The arrangement also allowsthe determination of the maximal O 2 uptakeand CO 2 production of the organism. Theprinciple discussed below has the advantagethat, in inhalation, we are not dealing unphysiologicallywith pure oxygen, but with air ofnatural composition. The arrangement shownmakes possible the extremely accurate measurementof the O 2 uptake at rest and a surpri inglaccurate calculation of the absolute levels ofthe resting cardiac output with th help of thfollowing well-known equation re ulting fr mTable 2:
Fig.20 View of the measuring assemblyfor the determination of the 02 uptakeat rest and of the maximal 02 uptakeof the organism, as well as of C02production at rest. Development:Manfred von Ardenne Research Institute.Simultaneously with our owndevelopment, an Oxycon4 instrumentfrom the Fa. Hellige, Freiburg/Br. (FRG)was put into operation in order to recordthe measured values of the lastinggreat increase in the O 2 absorption ofthe organism, and of the C02 emissionafter 02 multistep therapy as given inthe appendi xardiac output (COP)() • min-II =resting O2 uptake [I . min-I]11 • 0.21441021The value of 11 is determined immediately aftermea urement of the O2 uptake, in order toexclude the possibility of errors due to the discoveredcircadian rhythms in the 24 h cycleFig. 10). If the Hb value of the patient isknown, the product of the individual Hb andthe factor I .34( ml 02 per g Hb I should be usedin tead of the coefficient 0.2144. The standardmea. urement of 15.00 (between 14.00 and16.00 hour ), resting and sitting, roughly repre.ent the minimal level between norning andvening. The early measurement at 9.30 (between7.00 and 9.30 hours), resting and sitting,i roughly representative for the peak level betweenmorning and evening.Igure 21 A shows typical examples of the increasein the O2 uptake at rest due to the 36 h18 day 02MT procedure discussed below, bothwithout (variant GK 4-1) and with cardiac train109 (variant GK 4-11).he extent of the contributions of the increase10 O 2uptake under various conditions can betaken from the spirometric measurements ofthe uptake in Fig. 21 A (cases of untreated personsand volunteers previously 02MT treatedwithout and with cardiopulmonal minimaltraining included in the study). In the caseexamined there resulted for the male aged77 years through 02MT alone a lasting increaseof the O2 uptake to 161 % and through 02MTwith cardiac training, an increase in the O2 uptaketo 188 %. According to Fig. 19 B, thearteriovenous O2 saturation difference 11 increasedto 209 % due to 02MT with cardiactraining. The improvements in pulse frequencystroke volume and COP by the two 02MTvariants can be seen from Figs 21 C, D and E.Towards the end of the 36 h 18 day treatment(02MT and heart training) the curve in Fig21 A, B, D and E show the shift of the operatingpoint into a range with saturation character.It can be concluded from this that thechosen combination of type and do age of thecardiopulmonal minimal training (02, Alupent,physical exertion without extra 02) have beensuccessful in achieving the desired trainingeffect in the heart without further time e penditure in the framework of the 36 h 18 day02MT standard procedure.
,..._........,.--~"'!""!!'!~~----_........I...~lSI 22." 0, 6K
m 1m I O2 uptake a a characteristic value of the energetic r rv of~_I%il,"tli 0 ygen uptake i an indicatorpaJrtic:ulllrl in port medicine, of th~formance capacity of the organism.mElaslued hen the individual is subjectedCOlfttiftuously increasing train with an ergo-~2.ner. n tate of exhau tion is reached,uptake levels off. The numericaluptake in the plateau phase is anof the maximum 02 uptake or ofp rformance capacity. This figure isGl8l1Jlosti ally very informative, as it can also1n a a ind of characteristic value of the"j~"etic reserves of the organism. It wouldtheltet-ore be desirable for measurement devicesroutine determination of the resting O2uJ)'talc:e and the maximal O2 uptake to go into- cale production in the not too distante pected curve for the maximal O2 uptake2 -rna dependent on age in normal personsbe een in Fig. 22. The course of the curveo that this characteristic value drops con-. uou ly and steeply after the age of about 20.the age of 80 the figure is only approxirnaely 42 % of the maximum in youth. Thec osed circles entered give an idea of the meanvariation, and the points marked with a crowere obtained from enior sportsmen. It canclearly be seen that the reduction in the maximalO2 uptake occurs much more slowly inelderly, physically active persons than in normalpersons. The documented result is a seriouswarning to able-bodied persons not to neglectregular training (cardiovascular training) even inlater years [58].The lower part of the same figure shows theexpected curve for the resting O 2 uptakedependent on age. On the basis of the level ofthe youthful age of 20-25 years, a drop in theresting O2 uptake, e.g. at the age of 80, of approximately62 % can be seen. In physicallyactive persons of the same age group, the respectivevalue drops to about 60-70 % of themaximum. At the bottom of the same figure,measurements of the resting O2 uptake afterimplementation of the 02MT have been enteredas typical examples.It seemed advisable for practical reasons todesign the measuring set-up in such a way thatboth the maximal and the resting O2 uptakecould be measured by the same apparatus. Thismtkgmm~-max6050o302010----=scale fora70 kg persontOz 4 I+elderly SPorfsme1 % maximum• normal personsmin10o3r~ • + ft• ++ +++• • +90• +~+ + + + +-,.~ • + + ::::s 80Ci • Q•-Q~ ..... it •~~+ ~~ ~ •• Ie .+70 afler OzMT§- §•6K4-JI~'" ~ t:::i 60~ .0' ~.c:(wtfh training)~C;)'-~2§ ~ 501a, . ,~ ~ ~c::J "~ 40~ QE:300,8 c:::J\0,6dropm Ozuptake10Ol-uptake durmg/est ---ace to Boothby62%0,4---I,.,, ~rfnQ 0.2I I Io 10 20 30 40 50 60 70 80 90 100 yeorsage-..c:::..c:::20Fig.22 Maximal 02 uptakeQO max as characteristicva~ue of the cardiopulmonalsystem dependenton age, for normalpersons and elderlysportsmen ace. to Strauzenbergas well as restingO2 absorption and00 2at rest (STPD con·ditions) dependent onage for a normal personcalculated ace. to (48]and 02MT patients
hi v d in h arrangement shown aboveby th u of a flow sen or covering the rangefr m 0.12 to 20 1/ . In addition, the flow channelswere designed with an inner diameter ofmore than 20 mm in order to keep the flowresistance sufficiently low, even in flow peaks.1.1.&.Determining the lung function parametersPn umologists (Petro, Daum) were, as quoted Case I:in (17), of the opinion that the oxygen multiteptherapy procedures could not bring abouta lasting improvement of the parameters of lungfunction [59): 'None of these partial functionsof respiration can be changed in any way by theexogenous supply of oxygen'. This standpointwas opposed by the author's expectation that,by means of the high-charging of the bloodmicrocirculation in the lung area also, and thelasting improvement in the energetic status (anincrease in the performance capacity of therespiratory musculature), a long-term improvementin the parameters of lung function does orcan occur. In order to settle this question apilot study was performed, at first by DrGabriele Caspers and finally by us. For this aSpiroton-2 device from the Dragerwerk, LUbeck,FRG, was used, made available by the courtesyof the Erwin Braun Institute of PreventiveMedicine, Engelberg, Switzerland. This instrumentdetermines from a single expiratorybreath, which can be repeated twice after anadequate interval, the parameters exemplifiedin the two following cases. The parameters areretrieved from a memory and are evaluated insidethe instrument. The results are presentedby a plotter as flow and volume/time curves. Inthis way the following results were documented,showing that lasting improvements in lung parametersdue to oxygen multistep therapy reallycan be objectified (see column, right).In 15 patients from our group we found an increaseof 6.5 % in the vital capacity and of15.4 % in the peak flow (PF) after 02MT.Peak flow[1. S-I]FVC [1]FEV 1 [1]24-year-old male patient with functionalvegetative complaints. Treatment:two 15 min O:zMT quick proceduresDifferenceParameter before after abso. relativeO:zMT lutePeak flow[I'S-l]FVC [1]FEVI [1]Case 2:8.215.274.284.683.391.8710.506.044.265.813.602.08Explanation of the abbreviations:+ 2.29+ 0.77- 0.02+ 28%+ 15%0%54-year-old male patient with obstructiveventilation disorder. Treatment:36 h 18 day O:zMT procedureDifferenceParameter before after abso:- relative02MT lute+ 1.13 + 24%+ 0.21+ 0.21+ 6%+ 11%- Peak flow = maximum expiratory flow- FVC = forced vital capacity (in maximumexpiration)= l-second forced expiratory volume;Tiffeneau testDr Gabriele Caspers also produced similarlypositive findings with improvement in these andfurther lung parameters on 171 patients in theKlinik fiir Naturheilverfahren, Bad FUssing,FRG [60, 400a].1.1.6.7 Determining the resting CO 2 production as a characteristic value of the oxygen utilized bythe organismIn order to be able to differentiate the metabolicpathways of the (additionally) absorbedoxygen in the organism, it is also necessary todetermine quantitatively the C02 emission ofth lung. igure 23 show a schematic pictureof the e pathways. The ab orbed oxygen i u edfor energy production (biological oxidation)in the re piratory chain of the mitochondria ofall cell . Part of the energy gained is requiredfor imrnun proce es, detoxification reaction ,in hormone syntheses and in protein metabolism.The C02 production per unit of time O' min -1)can be determined by measurement of thabsolute CO2 content of the expiration air.Information about the oxygen actually convertedin the organism can thu b obtained bmea uring the O2 mi ion. Th ignifi anof this paramet r i ubj ct to thre limit ti nhow ver:
flllIftIIIhy """Basic mechanisms and functions 33: For comP.fl/1SRI relaltDIIShlp youth lage,1.13kJh·'·m·' After Oz M!a lasting mcrease of therestmg 0z·uplake Qo 10227% was5/IIromtiricallymhtDllhyall age groups.lJ31t8kJ h" mol -1.26 8 116"( mtQsured mweakened patients, and from measurents ;fthe ~-trI and Po atIflUtast In QOrest alasting increase altht 4 transport ID the body tissue to roughly 230 :lo-rlflIto only 133·4Sft 6tlgy Tables) (paper no. 333) dtttrmmldLasting increase in the 0z-ul!..fake at restIienorrnrJ.izotion fTtd oplirizotion ofMlIn msufflC,tnl bosa melliJo/ism H Wt,ghl/:.mIWtlghllaS5 1--sub,,",lt supply from Iht klwtrtd Itrtl In wtDktntd pol,tnhffOlTllht narmalltnlln htal/hy fWflan,•Jncreased concentration • ofl,nCrtaSt m hDrmontl•,ynlhtlts1ener9Y- nch ~h05j;ha tes(A P. C 'ItgllOgffeoch""cDtllttnl,l*tmzaliYl of thtpraltm tntlaballSlfI• • • •~InCftoStd capaCity Optnmg ofchoked InCftOstd cordial InettastdphysICal S'ttn~'htntng ofIhtcOfNllory artaS ~rfDfmanrt flStr'lS pttformanet capaCify dt/aJt eallng fNDCt5S~Itrductd floclllJn(ttduetd slram)ofCNS - systtm Increase In host :st,mt Idefence capacityTdie 3 Fig H.. (oxygen radicals)Flgm ~TronSlllan 10 a malttntfgeflc Ilftsl11t..ImfNa"tmtnttnquality of "'tFig 269Fig. 23 Where in the organism does this extra absorbed oxygen remain? It follows from spirometric measurements(see appendix) that approx. 50% of the extra oxygen offered after 02MT is metabolized to C021. A not inconsiderable portion of the CO2formed is re-used immediately in theorganism for syntheses (especially fattyacids), and therefore does not appear externally.It is important to know this for thebasal metabolism.2. In comparison with a certain absorbed andused amount of 02, the amount of the C02formed per unit of time is also dependent onthe type of nutrients as "fuel". Fatty acidscontain less oxygen than glucose, for example;therefore the intensity of metabolismand CO 2production is reduced at the same02 flow. These facts are reflected in the"Respiratory Quotient" (RQ):CO 2 production (mi· min -1 )RQ= O2 uptake (ml • min -1)At ·tandard conditions (basal metabolismthe RQ is - 0.82, corresponding to a CO2production of 250 ml/min and an O2 uptakeof 300 ml/min. As a rule, RQ increases after02MT (e.g. up to 0.9) and with increasingperformance. At about 2/3-3/4 of the maximumperformance capacity (physical exertion)RQ reaches a value of 1.0, which correspondsto an exclusive glucose oxidation.3. In great physical exertion and correspondingmetabolic acidosis (due to the anaerobicallyformed lactic acid) the RQ rises to over 1.0as a result of an over-proportional CO2release with only a slightly or not at all increasedO2 uptake. The falling CO2 partialpressure in the arterial blood indicate thatthe CO 2 expired comes from the normalblood stock and correspond to a re piratorycompensation (hyperventilation in rna imalexertion) for the metabolic acidosi .This excess CO2 therefore doe not ternfrom the oxidative metaboli m, 0 that thCO 2 output measured under rna imal e ertionhas only limited meaning..1.5.8 Determining the physical performance capacityo erie of experiments have been carriedafter two 15 min 02MT quick proc dur u into determine the phy. ical working capacitybicycle rgom try with a gradual in r inLn',I1"') before and after 02M . In the first seri .load, and . tablishing th P 1 (ph i al83 w mea ur d the PWC befor and working capacity in watt at a pul' fr qu n
34 1. <strong>Physiological</strong> foundations70%6050IIfqny f~ines greater therapyefkct"/lftkned polietilsweakntdpolienls•~•z· -0, 41N .. 67,9~~healthy volunleers"~ I~I~I---------1" ~ • " ••20 mean level forneolthy yo/un/eelS•Mill an overage10 ~ age of 5lfyeors.'""-"" --"'o20 30 40 50 60 70 80 90 100 110 120 130 140 WN 1 ..Fig. 24 Ergometric PWC 130measurements showing thepercentage of increase Z ofphysical working capacity14 days after two 15 min02MT quick procedures,dependent on the level ofperformance N 1 beforetherapyof 130 per min) in 10 male volunteers in eachcase, with an average age of 54 years, underconditions of a double-blind study. The PWC 130was re-measured 2 weeks after the last quickprocedure (lasting effect). It had increased from115.2 to 134.3 watts, in other words, by19.1 watts or 17 % (statistically significant atp < 0.05). In the control group (with placeboand compressed air) only an insignificant increaseof 5 % occurred, as a result of the trainingeffect.We performed the second series of tests in 1984with volunteers of both sexes with an averageage of 61, before and after the 36 h 18 day02MT procedure with administration of Alupentand daily 10 min training (following the02MT sessions). The PWC 130, which was lowerin these older volunteers (91.7 watts before02MT) rose to 119.3 watts after this moretime-consuming and laborious 02MT variant,that is, by 27.6 watts or 30 %(statistically significantat p < 0.001). The maximal performancecapacity was also increased, i.e. in five out often individuals one or, in one case, even twofurther 25 watt step were achieved.The blood pressure measured on the higheststep of the starting ergometry sank significantly(p < 0.05) from 180.6 to 164.4 mmHg, that is,by 16.2 mmHg or 9 % (from 24.1 to 21.9 kPa,i. e. by 2.2 kPa).The results stemming mainly from the firstseries with the 15 min 02MT quick procedureare given in Fig. 24. They confirm again thatthe 02MT effect in weakened patients is manytimes greater than in healthy persons. The lastpart of the book gives an overview of the medicinalconsequences of this effect, which is sostrong in weakened or ill patients. Even thelesser effect in healthy individuals is of greatpractical significance, especially for the preventionand prophylaxis of diseases, ailments andcomplaints. If, for example, it can be seen inhealthy individuals that the oxygen statu iworsening, the energetic reserves of theorganism are falling and the physical performancecapacity is dropping, the deterioration ofthe measured values should be stopped andeven reversed, e. g. by means of the 02MT immunostimulation,by which both the 0 genstatus and the ho t's immune defen e apa itare improved to uch an extent that overtdisease and crises do not re ult. A pro edureof this preventive kind hould become on ofthe main characteristic of future medi in . Thla ting incr a in th phy ical performan ecapacity that ha become p ibl i at finter t to per on with normally go d haIth,although it i at a 1 v 1 of only 10%. v nsuch mod rat gain can b d i ive f r vi toryin port comp tition . Th auth r kn ofvariou. po itive amp) f thi kind fr m t p-
Basic mechanisms and functions 35i h implementation of the 15 min::411Iick procedure days or weeks beforetion. inging, too, is a conversion ofrgies. Experience shows that theo ment in the energetic status and.iteal performance capacity seems to behelp to singers who, in terms of age,are approaching the peak of their vocal performance.An increase in the vocal performance(accoustically measurable), a longer preservationof the singing performance capacity during theculmination phase, and better endurance ofextended appearances were observed.termining the optical reaction timeameter which can be easily determined. pIe equipment is the optical reactionWorking on an idea of Fischer (Nordausenbach,FRG) we examined thein the optical reaction time due ton multistep therapy [63]. Eve deteronis based on the mean value of 20 inalmeasurements performed wit. in theof 3 min. In 20 volunteers of both sexes,a mean age of 60 years, the mean opticaltion time was reduced from 297 ms to235 ms after the 36 h 15 day 02MT procedure,Le. by 44 ms or 16 % (statistically significant atp < 0.05). The greatest reduction was observedin a 68-year-old patient with cerebrovascular insufficiency,from 515 (before) to 309 ms (aftertreatment). Thus in this case there was a reductionof 40 % in the reaction time. In cases involvingthe existence of extreme tirednessbefore therapy, even higher levels of reductionwere observed. In the control series, a reductionof only 5 ms or 2 % was measured (trainingeffect).For measurement of the critical fusion frequencyof the information flow to the short-term memorysee [62]Ie 3 Optical reaction time in milliseconds (ms) of 20 individuals before and after 02 multistep therapyan values ± s.e.m. from 20 separate measurements each within 3 min)Sex Age Diagnosis before after Difference°2 MT °2MT absolute relativem f years ms ms ms %f 71 chronic CVI 275±42 260±52 -15 - 5,52 m 55 glaucoma 256±23 226±25 -30 -11,73 m 52 chronic IHD 245±46 204±27 -41 -16,74 f 55 migraine 292±96 215±27 -77 -26,45 f 52 glaucoma 295±56 298±82 +3 + 1,06 m 76 ageing prophylaxis 209±56 199±17 -10 - 4,87 m 45 solvent exposition 202±18 185:1:23 -17 - 8,48 m 52 chronic CVI 253±76 231±33 -22 - 8,79 m 71 chronic CVI 282±82 258±46 -24 - 8,510 f 63 chronic CVI 276±46 218:1:21 -58 -21,011 m 68 chronic CVI515±139 309±58 -206 -40,0- chronic IHD -12 m 80 chronic heart failure 290±113 212±22 -78 -26,913 m 48 chronic CVI 295±141 224±22 -71 -24,114 f 63 chronic IHD 259±43 208±30 -51 -19,715 m 64 borderline246±62 228±47 -18 - 7,3hyperthyreosis16 m 57 chronic CVI 375±208 320±115 -55 -14,717 m 71 DAH 248±52 235±22 -13 - 5,218 f 40 chronic CVI 239±35 204±31 -35 -14,619 f 62 chronic CVI302±64 256±26 -46 -15,2chronic IHD20 m 55 diabetes mell.chronic IHD228±27 220±30 - 8 - 3,513 7600±10,7 279,1 :±85,0 235,5±44,5 -43,6 -15,6
logical foundationsu .on in the optical reactiongr t help to the followingn pilot;d r car-drivers approaching the limit ofth ir fitness to drive;3. -drivers who are easily fatigued or whohave to undertake long journeys;. car~vers with circulatory lability;5. racing drivers.It is known that the continually eoeate4mentary process in driving a CIIr co .visual perception of the current road a aconditions which - delayed by t e "op .response time" - triggers meaningf conreactions (steering processes, braking dcelerating processes etc.). The shorter the .dividual, momentarily existing optical respotime, the more able the driver is to avoidcritical traffic situations and accidents, or tominimize the danger of human life as wellmaterial damage in occurring accidents.1.1. Esta lishing and influencing the "biological" ageI~ order to establish the "biological" age, theVltal parameters of test subjects are determinedusing a procedure inaugurated by Pagelt andRoth and further developed by Ries [64] andPathig [65, 66], showing significant age-dependentchanges. The individual results in each caseare mathematically processed in the "Geromatdevice" (producer: Halberstadt District Hospital,GDR), and the result presented as the biologicalindex. Six different parameters are includedin the test: the measurement of theoptical reaction time to a light stimulus and apointer deflection; the measurement of theacoustic reaction time to a tone of a certainfrequency and intensity; the recording of visualmotoriccapacities; tapping test; search test inaccordance with Millner etc.In a pilot study with this device and other givenmethods, the following results were obtained involunteers who had ensured a good O 2 statusby means of02MTalmost uninterruptedly overa period of 15 years, showing a significant reductionin the "biological" age by oxygenmultistep therapy:No.SexChronologicalage (yr)Resting P02-art(mmHg)measured expectedMethod of determination(vitalparameters)Biologicalage (Yr)12mf797069('1 ~ 22%)72('1 ~ 23%)84('1 ~ 50%)82('1 ~ 40 %)Ries-PothingGeromat system(> 6 parameters)Quality of thevascular systemP02- art at rest;measured vs.expectedSkin elasticityRies-PothingGeromat system(> 6 parameters)Quality of thevascular systemP02-art at rest;measured vs.expected6450Q= 0.017640554740Q = 0.02141Skin elasticity4Ser factor which could in future contrib. ificantly to the determining of the bioith determining of the va cular
Basic mechanisms and func Ions 37in ly appli able. Thi ea ilyD8I'amleter an been as generally• ll1cal1l int re ting, a changes in thevascular system due to event of e mvaried kind (e.g. 02MT) are reflected in i .We are still far from a standardization of themethodol gy of the biological age [67, 11 0].of assessing the blood microcirculationuantitative or even just qualitative assesstheblood microcirculation is of veryormative value. Examples are:~lrelct determination of the increase in the6;tU~od microcirculation in the tissues of theanism by means of triggering the capillaryitching mechanism of the oxygen multieptherapy.ecognition of placenta insufficiencies andeir elimination using 02MT.ecognition of the time point of the selectivevascular occlusion in the cancer tissuesafter cancer multistep therapy (CMT).. Recognition and elimination of peripheralcirculatory disorders, etc.simple way to assess the blood microcircula:.,··:-Ao;··.....n in tissue near the body surface (maximumpth approximately 2 mm) is the method ofer Doppler [lowmetry [68]. One instrument'table for this is the Periflux made by Peried,Sweden. The nail fold of the 3rd or 4thinger is a suitable site to detect all the flowchanges [69]. Exactly the same point ofmeasurement an be easily re-found by micromarkhlg,the temperature can be measuredusing a thermistor and can be kept constant bya thermostat. This method is well suited todocument directly the increase in the bloodmicrocirculation due to the triggering of thecapillary switching mechanism of the 02MT.This technique can also be used to determinethe increase in the blood microcirculation duringphysical exertion and under medicationwith sympathicomimetics, such as Alupent.A further way to assess the blood microcirculationin tissue which can extend to approximately20 mm under the body surface is themethod of ultrasound Doppler [lowmetry. Herea small portion of ultrasound radiation is scatteredor reflected by the disturbed blood corpusclesand thus, in accordance with the sizeand orientation of speed, Doppler-shifted. Withincreasing frequency and hence decreasingwavelength A the back-scattered portion in-Icreases and 0 beys the -- dependency (Ra-A 4s80706050II- /30/men -Ii women/ /',JIP201020JOVI/ IJI B +V/--L ..-cIJ/ !150 60 70 8090ytorJFig. 25 Smoothing time M for askinfold on the back of the handcaused by pulling uP. dependent onage. M as a marker 1 of skin elasti·city1 Mean over many preceedin months
1. <strong>Physiological</strong> foundations. ~ la~), if the condition that d ~ A (d =P rtlcle dlam t r) i fulfilled. The Doppler frequencyhift Af of the wave scattered back bytho moved particle is proportional to the transmlt~erfrequency f o and the particle velocity v,proJ ted onto the transmission or receiverdire tion:2v .Af = fo • , With c = speed of soundc-vThe velocity range of the blood corpusclesrelevant for the microcirculation lies between5 and 0.5 mm/s. Using an ultrasound instrumentdesigned in our Institute for this task,anUS frequency of 7.5 mHz is applied. The valueof Af is therefore only a few Hz. (By comparison,with the laser Doppler flowmeter, workingwith light, the value of ~f is 1-2 kHz.)The speed orientation of the blood corpusclesin the area of small vessels is completely isotropic,so a "Doppler frequency spectrum of theblood velocities of < 5 mm/s occurs symmetricallywith the transmission frequency, by contrastto the asymmetric Doppler spectrum ofthe flowing blood in larger vessels.Our apparatus uses the impulse Doppler process.Firstly it enables a critical intensity notto be crossed despite high impulse energies and,secondly, a selection in depth is possible.The electronic processing of the back-scatteredsignal with subsequent Fourier analysis makespossible the assessment of a narrow range ofvelocity. With the developed multi-elementtransducer, analysable signals up to penetrationdepths of almost 2.5 cm can be gained.An exact interpretation of the results is difficultand requires great experience, as themeasured value, the amplitude of which isdetermin¢ by the amount of moving scatterersand the Doppler frequency by the velocity, doesnot allow us to distinguish between the disturbingblood corpuscles and other moving tissueparts. It is particularly necessary in this methodto distinguish the required measurement signalfrom those signals which occur due to tissuemovement in the pulse rhythm. It should bestated here, however, that even these tissuemovements represent an indirect measure oftissue circulation. This method will not be ableto claim to be a reliable, abSOlute measurementprocess. It should, however, be sufficient fora qualitative relative measurement. Thus itcould help in the recognition of the selectivevascular occlusion in the cancer tissue near theurface in cancer multi tep therapy, as well as inthe recognition of the elimination of peripheralcirculatory di orders by means of therapeuticA frequently used way to assess the bloodmicrocirculation in tissue which can be at anydepth beneath the body surface, is the 133Xeclearance method. The 133Xe isotope of theheavy inert rare gas is almost ideally suited foruse in humans due to its short half-life of 5.27days and its 'Y-radiation energy of 81 keY, aswell as its relative frequency of 27 % [70].Depending on the aim envisaged, the radioactiveisotope is added to the circulation, eitherin gas form via the lungs, or dissolved in physiologicalsodium chloride solution via the vascularsystem, usually on the arterial side. The clearance,normally measured with highly accurateand directionally sensitive 'Y-scintillation countersin the target area, correlates with the tissueblood flow, hence, with the microcirculation[72].In the view of Reference (70] and the fact thatthe author set up the laboratory for nuclearmedicine of the Medical Academy of Dresdenin 1964, and from the knowledge of the work(72] from the year 1967, it was obvious thatthe 133Xe clearance method should be used totest whether it is possible to ameliorate anexisting placentar insufficiency (disturbed fetomaterno-placentalrelationship) by means of theoxygen multistep therapy. The impulse for experimentsalong these lines resulted from adiscussion with Kyank. Several gynecologicalstudy groups followed from this stimulus, andwe learned of positive results [73].Further areas of application of the 133Xe clearancemethod, which has been ready for use inour Institute for some time, are the assessmentand the combat of peripheral circulatory disorders[71, 72, 74], the recognition of the timepoint of of the microcirculation inhibition orthe triggering ofhemostasis in the cancer multisteptherapy [22, 23, 76, 77] and in the determinationof the local cerebral flood flow [7578, 79].The lasting improvement in health status afterthe end of the 02MT procedure (after end of02 application) was discovered in 1977 bmeasurement of the resting P02-art [3] thenproven and scrutinized. In 1982 th jointmeasurement of the resting P0 2 - ven(d terminationof 11) [6] was added. Since th n thestrength and the urprising duration of ththerapy effect have al 0 be n prov d b murement of the resting O2 uptak [37] of thparamet rs of lung function, ph i al p rformancecapacity [61] and pti al r a ti n tim[63]. Studi with d t rmin ti n f r ting 0production, bioI i al ag nd mi r ir ul i n
Basic mechanisms and functions 39y long duration of thed by v r more paramdical institute. Retup tudies with theu ment of a number ofI ge number of weakened patherapy.It is therefore only afore it is generally recognizedQ.W!leulfled that, through the discoverythe capillary switching process ofmicrocirculation, both medicine and.ces have been given a new aid of aand efficacy hardly observedhe special feature of this aid isthat it significantly increases theserves of the (weakened) human orng-termand non-invasively.thor was very much helped in his decichangefrom physical to medical rese960 by the close, cooperative relationsfriend Prof. Dr med. Bernhard Sprung,of the Surgical Clinic of the Medical.my of Dresden. Due to his prematuree lost our clinical partner. Since thisevent we have had to limit ourselves forany years to methodological developBeing without ambitious clinical partelooked for new solutions to importantcal tasks on the basis of a physical way ofg and also the medical knowledge obin52 semesters of research study. Wewere supported by the doctors in our n tituteand by numerou physician, biochemi t , biologists,rheologists and immunolog' ts all overthe world. What followed forms the content ofthis book. Time and time again, however, wefelt the painful absence of the great, highly recognizedclinical partner at our side. De pitevarious appeals, for many years we could findno suitable clinics prepared to repeat andextend the results obtained in our treatmentseries, using large numbers ofsuitable patients,and then to report on their results. In this situation,the author is very grateful to the Ministerof the Health Service of the GDR, Prof. Dr med.Ludwig Mecklinger, for some time ago allowingand encouraging the establishment of an externalbranch of our Institute at the nearbyWeisser Hirsch Clinic (director: Dr med. HeinzLanger) for treatments with all variants of theoxygen multistep therapy. The above-mentionedfact that respected clinics in contact with us(avoidance of methodological shortcomings)have this year set up comprehensive, well plannedstudies, also justifies the expectation of anearly breakthrough of the oxygen multisteptherapy to form a part of academically recognizedand taught medicine.In the following paragraphs we will discuss theprocesses, influences and findings of which isnecessary to have knowledge for the implantationof the 02MT procedures.The effect of the cellular switching mechanism of the microcirculation in the lung;effects of P02-artI ng occupies a special position with refertothe effect of the cellular vessel wallc ing mechanism of the microcirculation.This mechanism leads here to change in theresting P02 -art and hence to change in the O 2saturation of the blood.•1 The loading of the blood with oxygenollowing links are all involv~d one afterher in the transport chain of oxygen fromxternal air to the sites of its chemicalformation in cellula~ metabolism:onvective transport to the alveoli of theby ventilation;u ion from the alveoli to the pulmonaryilIary blood;v ctiv tran port to th ti 'ue capillariI od circul tion;n fr m th apillari to thial1rf01Jnain II .the 02MT are in link 2 and 4. The follo ingare factor influencing the level of th art rialoxygen partial pre ure and th reb the tr ngthof O 2 aturation of the blood:I. alveolar v ntilation V .2. pulmonary blood flow (p rfu ion) BP'3. lung diffu i n capa it DL.d
II foundationsI tem IBPtrsons with (in oIde,ogt)• sntTl'" ,lducedlung {JtrllJff1loflttDistributiDn sererely worsened!I 1,1iM IIIIrN1t1t epI'""ium""""thymeClpiIItl'1"'."""um I ~~~~~~Fig. 28 Diffu '0for 02 and (CO2) ithe exchange ofin the lungs (see al[81], Table 8)1 Diffusion path enlarged(highly reactivelayer). Swelling of capillaryendothelium. arrowingof capillaries.SimuitaneoutrstrongIncrease In ventilatoryinhomogeneityThis contact time is, however, usually sufficient- as seen in Fig. 27 - to bring the oxygenpartial pressure in the blood into alignmentwith that in the alveolar space. It should berecognized, however, that a worsening of theO2 diffusion conditions (e. g. due to reductionof the microcirculation, that is, of the perfusion)and of the pulmonary functional inhomogeneities[80] compared to the norm, must immediatelylead to a reduction in~he P02-art.The contact time is reduced during physicalexertion, which can lead to smaller O 2 saturationof the individual red blood cell. However,this subsaturation is normally more than compensatedfor by the increase in perfusionthrough the lung capillaries which occurs duringphysical exertion, and the increase in the P0 2in the alveolar space of the lung, resulting fromthe increase in the respiratory minute volume(RMV). The result of this is the important factthat the P0 2 - art increases during physical exertion.In addition to this, there is an increase inthe mitochondrial metabolism in the cells ofparticipating· organs when extreme physicalexertion is regularly undergone. This "trainingeffect" improves O2 utilization in these organsfor limited lengths of time. The effects havealready been successfully used in medicine andnatural healing (strength-demanding activitiessport etc.) for generations [9-12].Under the conditions of 02MT the increasedlung circulation which occurs during physicalFig. 27 Increase in 02 partial pre ure in rythrtIS during passage through th lun capillari ,represented for th diffu ion cont t ti (2)tK = 0.3 (re ting condition, pul 70) nd0.126 (tr in conditions, pul 110); 1 mm•
Acapilloryendt7A-arttJOcopillar! openingBasic mechanisms and functions 41Bcopillor!fIKIt:~~---- ~-C 40 l...,.....---" r--20P~"",(72mmHgJP~-"n6020/V./ ~tRritItt maindftds «tJIfJ f--isIIr rf-esloJiisllmMl gfgood ai-cu/otionantidiflusionconditions in III! /UIl§5.0o20 40 60 8J~iY.---t.. -700% (IoN tioro o20 40 60 8010H.--.....-100%f/ow~Fig.28 Increase in 02 partial pressure in the blood during the passage through the lung capillaries, representedfor a 70-yr-old individual with reduced arterial resting Po (A) as expected, and for a 70-yr-old individual witharterial resting POl. (8) lastingly raised by means of the O;MT by 26 mmHg above the expected level, to 38 mmHg.1 mmHg = 1.33.10 2 Paexertion brings about a great increase in theflow rate of red blood cells virtually saturatedwith O 2 , despite the shortened contact time.The desired augmentation of the O2 offer thenoccurs for the whole organism.Just how much the O 2 saturation of the bloodin the flow through the lung capillaries is worsenedwith the reduction in cardiopulmonal performanceat an age of, e.g. 70 years, can beseen from diagram A in Fig. 28. The course ofthe curve emphasizes to what extent the circulationand diffusion relationships in the lungbelong to the target area of therapy, when wewant to ameliorate or eliminate the reductionin cardiopulmonal performance with advancingage. Diagram B in Fig. 28 gives an example ofthe effects of the 02MT procedure. It showsthat the relationships in the lung system canoften be regenerated, even in older age, to adegree previously hardly believed possible.he interrelationships of the factors decisive forthe P02-art and react!vity of the .lung-hearty tern are shown in Fig. 29. In particular, thecoupling and feed-backs existing between thevarious elements have been drawn in here. Thetriggering factor of the reactivity can either liepredominantly in the lung or in the cardiovascularsystem, or together in both area . Thecellular switching mechanism of the microcirculation,which lastingly closes, or re-openthe capillaries in the diffusion-perfu ion area ofthe lung, is primarily the main contributor toreactivity. Depending on the type of the triggeringfactor or of the regulatory mechani m.the reactivity has either a mall (TI) or a large(T2) time constant. We mu t make a fundamentaldistinction between degenerating influences(-) which decrea e the po 2 - art • andregenerating influence (+) which in rea e thePo 2 -art·Figure 30 shows a typical example of P0 2reactivitywith a mal1 tim con tanto n th rexample of arterial P0 2 r~activit with a malltime con tant i the redu'tion of aIm t 10mmHg (1.3 kPa) in the P0 2 - art due tadof 1.6 mg nitroglycerol. Among th r.. Fi .17 above i an exampi of art rial Po ractivity with a larg time n:tant.1.1.8.2 The reduction in the P02.art due to age and stressful influencesn a non-. el ct d group of patient the P02-artlu vary ov r a wide rang . Figure 31 giv sm tion about th dL tribution of m asur dTh r i' a v ry pr noun d and 'har t ri tidependence of th m an Po -art on a nb s n in ig. 32. It i: n tur 1 th t th r du -4-..l-"'K.LJ~~:':':""=";:;'''';;;''';;';''';''''- L''''''''''''-_~:'''-''~.--I!l-.__,~>.l..... ...-...,.-4J."-,,,-.......~~~ +
1. <strong>Physiological</strong> foundationsAirdosing01tJlmJli (-)r"li ~(ftn:f. shuntproportion)~_L.-_..,hprwnll10lKJn M7;,7;1 1. fJMW:1r!lylJfJWf/lilolKJn (-)r" 1l ventil1tiJnfA.~t/irln1Jultt¥l (-)lj-.tJlfJlwoli Mr"lZ~~+~_t__(ClJIItilJulrs t, rtgtlltfllli,n )8.IJHusitJn~.1 lIiffu.sKJnsurftJrzrciJsing ofcopIiltPs (-)7i[~tlistrilJuliJnJ (-)1; /tpming ofCfJpllories M7i12.2 IIi/ii. .I': 'USKIR({onlribu/~s l(Jrq~n~lQtion) lengthlc. I+rfusionshunt perfusiondependent on Ihebody:SO posdionll!artcart/iac (JutputCOP3.1 lJloodperfusionQ~ contacttimeII(t-t----a~ 0 ~ COPfhealf1lypersc:zs)~ == OJs (Ilealtll.! persons)COf=- 61Il11il- 1 ( resl7~ adulls)4. arterial~-pressu,eP~tFig. 29 The factors of the lung-heart system determining the arterial O 2 partial pressure and reactivity (82).K = diffusion conductivity. Time constants of reactivity: T 1 = a few seconds (sphincters). T 2 = , 5 min to severalhoursDnn/fliTg acup 01coffee (8,59) Increase in urterlal POI __Duralloll ofeffect rery Yonable.110--..........--r-----r---r---,-----,---,I1Pammilg J6Jt.Or~ 14100. .••• +•••••••••'"--Jtf''-+- ~// .: ..... ......../ .. -..•12. ..••.,,-3tUrs,,1110Fig.3O Influence of drinking a cup of coffee
Basic mechanisms andm 80....90Fig. 31 -Frequency distribution of the arterial PO zin clinical patients of all age groups (admitted undervarious diagnoses) ace. to measurements made byH. Krauss [84] on 150 persons under resting conditions.n =No. of persons with P0 - r 2lewis in theinterval x ± 2.5 mmHg. 1 mmHg =, .33-10 2 Pa100Iexercise training90~~""'"=='"t---f80......---. Increasing impairmen!oftheritreous70 body, arterial vesselwalls and joints5560so~--+----+--------+-- -+-----4502030'0 5060age -----1__708090 yrs'Awl..... dependence of the arterial oxygen partial pressure P0 2- t' at rest, on age of healthy individualsring population, according to Loew and Thews [85]. The a~~ependent decline of the resting,1litl!lch effects a relatively small reduction in the blood, particularly affects tissues that are supplied byd"ffu ion (002). The resting P0 2- is a characteristic for the ability of the lung system to take upactII'blrICtiiolnal ate, degeneration, regeneration)
110N.ttJJOt~1. <strong>Physiological</strong> foundations8APP'lprlizk1TItf1SIJt'tm1/ flint.9N-32T..+-- --~-- ~--+-=.:;: -...... -.1-'---:::::: ~.- 1--'-,-,- '.-. -r.-:-ri-- ":"'".~.- ... 'tN-1t.rN-66~fh-qrlit)10I12t ..16 17ItPa1413121770Fig. 33 Daily fluctuation in the meanarterial resting P0 2(mean ± S.D.) forN = 66 healthy individuals between theages of 25 and 72 years [86], with d and9 groups separatedt:~~P OrtTt"'1---+---+----1f----+-~IIo(h.,.__-+__I..10 20 30 40 50mint12111027 637 1Si)9 58 20Fig.34 Measurement examples ofthe consequences of a visit to adiscotheque at different ages.Measurement of the arterial oxygenpressure before, during andafter a single short visit to a discotheque.Measurement: Manfred v.Ardenne Research Institute1 Stressful process with directeffect on the circulation. Nolasting effect"2 In a group of 8 volunteerswith an average age of approx.40 years, a mean reduction~02-art = 8 mmHg, at t .. 30min, was measured100mmllgt:POrtr170mtingJ 60s,evertph,Sicol inoclinljI.. ..... ........ ............A B co 5 10 15 20 25 JOdJJSt ..I100mmllg90807060excess stress andsevertphysical inocl/nlyIIool'-- """""'--"'-o 5 f) 15 2025 30dayst •I100mmltJ~807060long ii/ness paraplegiaI I ~fJI1JSCa/ diSlllJlemmt~"'-- _. ~~o 5 KJ 15 20 25 30daysf ..Fig. 35 The reduction in the arterial resting P02 by various debilitating effects on the lung-heart system: physicalinactivity (A), excess of stress and physical inactivity (8), long illness, physical disablement and paralysis (e)1.1.8.3 The reduction in the P02-art due to stressful influencespecial inve tigation were carried out into theimportant que tion of the strength and temporalcour e of the reductions in the P02 -artU to tre ful influences [20, 21]. In doingndi tingui hlarg timth d prdiat ly, i.
Basic mechanisms and functions 45is. /nilitJ/p/mt BParalysis. Advanced,Jmt90 ,....,..---r---,r---r--~-......KPo.mmHg 1180 r--t---t-t-+--+--+-11070 1-+-f--+--+--jI--...j......I 960 8o K) 20 30 40 dayst --50 0 100 200 m 400 days·f ..Fig. 36 Examples of the lowering ofthe arterial resting P02 by paralysisA ColdB 'fluC StnOkejKJison/ngo rOCtl/infectionOzIfTP6~eepSmoke !KJfS0Il1ir!flxrrlinfecID.l'xlrodtiJn10011111~80ill60I-~ retO~ ~\. ...,.~t___o 1 4 6 8 KJ 11 " IS IJ days100111II119~80ill6IJ~I1/1I Pfl19 iFier~esP;'fIt/~ with 0lo2 46 8 lJ 11" 16 IJ a'tl)'St---1001fIf11g~--80....70"""t-r"6IJI..... 1.0"'"IIcftJ1111100 1 4 6 8 KJ 11" 161BdlY/f--9£ OperaIiJn, injlJry~, ~~f--1~r~ ~....o 1J 10 30 40 o'ayst--~mmlgF CancerostaticsI80~~ill6050drug treatment!oXic SIde effeds....... r-..... ............0 KJ ]03f)4OtiJFt----I6 Radiation IImJpy15· 2 Gf 15-2Glstroin ~ lJycellulor breokdDW/190 /JnK/uttsmmlg80ill~ ~~ l.a...6IJI...... ioo"50 0 KJ 10 30 40 d/{ysf--H .BurnIJurnslft1il1 byttllufor bmJkrJJtm pttJdt1ds,."",,; IrPa8On-~~7Ww~ill6O~~--+"""~+-~50 0 lJis. 37 Examples of the lowering of the arterial resting P02 by stressful processes of infectious, toxic, and quasioxickindng-heart sy tern reacts with a large time conantto most of the other tressful influencesich we examined. It can therefore be asmedthat the cellular vessel wall switchingchanism is decisive here.e of the wor. t stressful influences of ouri the increa ing lack of exerds in thodern lifestyle in industrialized tates [87].i therefore no coincidence that leisure sportn all its varieties has become so widespr adth appearance in 1881 of Ferdinand.....,.......'ich' pioneering, rou ing work [88]. Thim nt i a ign that a healthy in tinct
1. Phy iological foundationsAnoO;HT'flui1fectmIBI .J6h -tim tftalmrnf'fluilftdiont----frJ(J~-r-~-r---,-~---,mm2 t---I-f~~~++-~ICJ6h -41fTffealmett'"Iu yt](ril1llfiJn1fJ(J_...--.......~I--..............._mm~ ~-++----f--t-~-I014- 6 4 10121# ~ 1Idtrysf--'IJ t---+--+-iIL-JtIffrmIIIdifIn6O""'-'-...I...'~...I...'~""""~--01# 6410"".1Idt1ysf~Fig.38 Measurements of the change in arterial resting P02 (degeneration and regeneration of the lung heartsystem)in a 'flu infection (A, B) and a 'flu vaccination without (A) and with (B, C) regeneration by means of02MT during infection phase. Examples. EV =expected valueinfluences can be ameliorated and combatted,if the 02MT procedure is implemented simultaneously.It can be seen from the cases compiledthat it is by no means only stressors suchas those in Hans Selye's classical experiments,which cause depressions in the P02-art. Perhapsthe concept of stress should be modified, followingthe findings discussed in this book.Although one of the consequences of stress is aworsening, for a longer or shorter period oftime, of the O 2 status (P0 2 - art , Po 2 - ven , 11, O 2uptake, CO2 production, physical performancecapacity, etc.), we have only discussed the influenceof distress on the course of the P0 2 - arthere in great detail and supplemented with examples.The reason for this was, on the onehand, the convenient routine measurability ofthe course of the P02- art and, on the other, thefact that the inverse changes in the P0 2 - ven aresimultaneously triggered by the same capillaryswitching and regulating mechanism of themicrocirculation. The changes in the P0 2 - venare thus mostly the approximate mirror imageof the changes in the Po 2 _ art. The measurementsof the course of the P0 2 _ art alone will only beinsufficient when it is necessary to gain absoluteRecommended nuniJfrof freotmen! hours110mmlfJ1009060024I I I I I I Ilime ofI1rtJsunmtnf- 10 a.m.I I1I:• • ..• r .--iI• 4~ ~-..,.".,. ~ """""'"Intrtmt• I~ 4 to 13l%I./~ ofHtt#::'PlV " :4. I I II I I I I I6 8 KJ 12 14 16 18 20 21 24 26 28 30 32 34 36 38 401nEf--4I--...t1t~blttl I -- t~ •OxygenolJund'JJOmin IJt!ryt ftld1 SfSSion.IlJratiJn qfindividual IheroflJ stSSion ;Io~h~ingstssion P~ .. ,.2:t 12mmHgIJtfort flttrapyFig. Measurements of the arterial resting Po as a function of the total no. of treatment hours T of the 0 Tfor healthy persons between the ages of 65 and ~5 years. No of persons N =8. Mean values. Daily e ercise training.R ult: I ting increase of arterial resting P0 2to 132% of the level before treatment
Basic mechanisms and functions 47values for the O 2 saturation differforthe O2 status Q02' In practice,v ry much simplified by the factsimple measurement of the restingevel& is usually enough to make pos-sible assessment of the strength, temporalcourse and elimination of the consequences ofdistress, and to signal the necessity of 02MTrepetitions.The increase in the P02-art by means of O 2 multistep therapy procedures and exerciseimplementation of 02MT procedure step therapy procedure in this book. TypicalGK 4-1) with exercise programmed for measurements for this on persons of an old ageroughly every 20 min, and if possible are summarized in Fig. 39. A comparison withexercise training in the intervals between groups of subjects of various ages shows thate sions (step land 2), there usually results the improvement in P02 b particularly successcreasein the P02-art to an upper limit level ful in old persons, for whom the attainment of'n 30 to 36 treatment hours. For this a good O 2 status is of primary importanceon this variant is termed the 36 h O 2 multi- (Fig. 40).oHetI/1 recommt'ndl!tfIKJ. ofl'Ure!lours £ f-.J5101Q1 2 3 4 5 6 7 8 9 10 11 12 13 14 15 16 17 18 19 20session60}.llJ'i1,1.~ a.n.- ~.... .... ....V•• 0.•• .... .---If V ....... y'~t--..:-II--~~rm~I: 35to ~ years N·5 h~....t-- ._,J/a.1: H to irJ years N=20 r., v .... 111: 70 to 7.1 years N=2 s.I I I I IN-28 ev......t"," Drug combination JOmins IJefore ea1'se~slon.l n1/-"- IJuJiltion ofindiVIdualsesskJll ?II~I /o 2 4 6 8 10 12 14 16 18 20 22 24 26 28 30 32 34 36 38 4011r-Duringsession fJOl-f/ • flf2:f f2mm~ I. IO;-pro/llsion IirJmJmi~ exetpSt ~roin~ in/~ 1If,1tr"f1s. I I I-JtIKtrr (nOll e apltcator)final yolues(mean)140%130~.o2 3 4 5 6 7 8 9 10 11 12 13 14 15 16 17 18 19 20sessionit"" !>-""'Iv,....~.,Jr-o ......V"!f, ....-- 1--, 1>-'-/, ~ ..... Lt-'-100 ~lo 2 4VV r-- I .. ,oJ' " V ~- Vl--" ,-,/---1- - - -- _.- -~ ..... '" ........." " "0 •• ' "'"'" ' .6 8 ro U ~ ~ m ~ II ~ ~ M ~ 3£1---2 34 36 38 4011IIldivldualsftJrfitr;vallie. f h " I rest"lng ftO as a function of the total no, of treatment hours ~t of 02 MT in patients9 40 BehaVior 0 t e arteria rl 2. ' , H G L", . N f fents N = 28. Mean values ± standard deViation. Measurements . . Ippmann.VlrlOUS ~ge~roups .. 0.0 Pta e' tablish the optimal no. of treatment hours, Measurements in sitting position (stanclalsarles of experiments 0 S
hysiological foundations...fJJHT(JIll )' ,1002 3 ,5 6 7 I,r1""/rgIf L1..lD7 129 -- s,-,ZJt /tItJ,'. 117 7.45SJOr N-"- ~1!11l ",.l~~( N-1OP/Iz-.1 1-4 N-I,JTht i1crtfJsei11hr P/Iz-a1 IIJ8b lilt beller, the 11I0rt exactly Ihe 1Mpalienl R1IIDMS flit nstr"dion ofcomilllJinr doily t'Xef'&bt 1rtJining.'tJ A~tiliJn oIH1t' tIItropy is usually only 'SSOI"y ~1Itn astlll'rtstressful i1l!umae.g.'IIiJ, tpt'roliJn) ((JUst. flJt Po; tTl to,sinKIrJ6050l:N 10ortJUgN,y !Ittpre-hropy Itvtl.- 2 0 2 4 6 8 J) 12 14 16 18 20 22 24 26 28 30 32 .34 36 38 40 42 44 46 48 50 52 wrebt ..43Onlfdconlinutfus/y dro)pi/W.rofptl/;ens29complied wllh thertf/IIesi ltJra regtit1r hi/ow-upo 2 3 5 6t -15I10-7 8 9 10 11 12 I1KJflIIIsFig.41 Measurements showing the lasting, almost unchanged increase of the arterial P02 by means of the discoveredfunctional regeneration procedure for the lung-heart system on initially 53 subjects (groups of 43 and 10 witha mean age of 65.3 years and 62.6 years) without pronounced chronic unspecific lung diseases. Sx =standarddeviation; the 02-art increase is statistically significant at the 1% level; study made by H. G. Lippmann and H. H.Wiemuth in our Institute 1979/801.160;n ftlctors ~16 '23 ~.J) 1,,25POrirf10013mmIfJ'" e IrPa70 F-~=--+---t----t----i600 9 If 27 3617f ~ '7~~,gluessloIistf('(]l!y sgnliCllnl. rp-O,D5).'o,lJ,c,d,t: difftlMlZS !IIltIttn tk POrt!tFig. 42 Effect of the 02MT regeneration procedureon the arterial re ting P02 in 30 patients aged5 9 V a with roughlv normal blood pressur .i n from non pecialized cure institutions12"9This increase only gains considerable medicalsignificance with the fact, which now has beenstatistically proven, that it lasts for up to morethan a year, provided severe stressful events donot lead to a lasting reduction (switching).Figure 41 shows the results of a special investigationinto the duration of the P02_art elevationafter 3, 6, 9 and 12 months. The resultof a further study into the gradual rise in theP0 2 increase with an increasing number oftreatment hours, as well as into the duration ofthe effect after the end of the procedure anbe seen in Fig. 42.The regulating and wit hing m hani m f thmicrocirculation, th effe t of whi h in th pulnaryy tern i chara t tiz d in th pr . ufigure, i actually nothing but th r al fnatural pro e which ha b n kn n f rlong tim and ha be n larg I pI .n del ctron mi ro op [89 90]. r rrito th pr f th sw lling of th nd th l' Icells in O 2 deficiency. B u thi 1.
Basic mechanisms anunctions5511111;tfellz«4SB50+----_~I40~----......JI I IOzHT IIfItr ilion f£1ff ok--0oס1 ....1' , IP lIz « under inho/a/ion- 120mmHg ~8lrPaArterial resting levels of P02 (A) and the2 (B) before and after 30 hrs 02MT cure prore,represented as x + 1s. N = 13. (Therapynders with a mean age of 59 ± 9.4 years) [92]est capillary cross-section extends again,the microcirculation increases. Our diserytherefore refers to the reversibility offundamental, natural mechanism whichoccurs in all capillaries of the human body,and also to the recognition and proof that thebasis of this mechanism is formed by a feedbacksystem with switching properties, whichleads to the persistence of the bioenergeticallytriggered effect.As has been mentioned above, the ba ic effect,the increase in the P02-art or in the oxygentransport to the body tissue, has unfortunatelybeen called into question by two studie madein foreign institutes with small numbers of patients,e.g. [91]. Since these negative findingsmet with an extraordinary response in variousmedical journals, centers in Dresden andelsewhere, which had been practising the 02MTfor some time, carried out studies with largenumbers of patients into the question of theincrease or non-increase in the P0 2 _ artby meanof 02MT. The positive and evidential result ofthese studies are given in Fig. 43 and Table 4We should refer here to the works of Caspe.[93, 94], in which it is established using 108cure patients that 18 months after 02MT amean increase in the resting P02_art of 6 mmHg(0.7 kPa) still exists, as compared with the pretherapylevel.e 4Results of 12 studies into the lasting increase of the arterial P0 2(tP02-ar ), at rest, by means of 02MTdies, authors no. of patients toP02-art [mmHg] time(mean age)3rd German editionof this bookp.35.37p.37.38p.38p.39p.44p.67p.317f rther studiesCaspers 1985olf 1985olte 1980von ArdenneLippmannseveral sanatoriavon ArdenneWolf10 clinicsvon Ardennevon ArdenneSchnizer (Fulgum)19811982 (!)8 (72 years)43 (64 years)30 (59 years)13 (59 years)108 (67 years)1407 (69 years)5 (- 60 years)15 (58 years)3827938 (67 years)88 (62 years)22 (62 years)22 (also after 30 days)14 (after 90 days)13 (after 50 days)18 (after some days)19 (after some days)12 (after> 30 days)16 (after some days)4 (after> 1 day) 1o9,4 (after> 1 day)13 (after> 1 day)14 (after> 1 day) 1o (failure to reach switching threshold):ti:',.E!!E!r:!!i~on!!.:2682 (I) toPa02 = 14 mmHg (!) or 1,8 kPa11 studies1 study (Nolte) 22 ~ = 0 mmHgverage lowering of the P0 2- ven(flP02_ven), at rest, in these studies was -10,3 mmHg (v.A.) or -15 mmHgment of the effectiveness of the 02MT without including measurements of the changes occuringvenous Po is not possible I This basic principle was ignored by some authors (Nolte, Hendrik,in false assessments of effectiveness.ulti~
1. <strong>Physiological</strong> foundationsCOCOM I' en+ + -- + + -+MM~(OCOI I I I I0,frl O~ IM-+~~ repetition of the treatment. Three typical .excoamples of the effect of the 02MT qui k proceu"£; dure on it first application are hown in Fig.~...44. The three cases differ one from the other-III in the fact that the tarting 1 vel of the re tingC! P02-art is ith r particularly low (exampl A),c; or mod rat (B) or aIr ad. v ry high (C). It iQ....significant that th durati n f th ff t inco terms of th P0 2 - art and Po 2 _ en fund ing all thre cas ,as aloin th r a hi h~ xamin d. It an b n fr m th am 1.!!'+- that th P02_ rt an lob m'T a d b m ano of th qui k pro dur and that, furth rm•
BaJ ms ana uIIII/t105700lIS~1"~olmtnlIflolmlnlIt'SIir9 p.o 0,o---3369 7215t--...~~'"t-3IJ(}IV -15"'" strom No ~ addtdIt PoIMln iIoIV' N-.1 "IIrygrtrJI~ nHM> 13orltritrl~ Po,~- /1---12, ~I 1185)-----137 plrs75 --- 39 .,,,..._ ......52 years 50 years ~'" ..... I 5865POprI • -~-~-i60 -855 750 '7 -52 63% "'-27 44% 7[-24 48% 1'/ ·23 35 --~·o-,P~ 45 6,403S\ \o-3dJyS-9\\~ 5~ \ 41'/25 Po,-....\ //3/"20"""rI15 Hry low lew! of r-- \ /10 ~ venous ~ os a /o:iIJi9 S;.t:~ PH-! Dte/in/ng "nJ1n¥g efIt!cf-i--I?fJCliYl Iiit:::.ictJl/y5 IoN Iffl'I.s 0. fn!ri:T1'2I i 7Exptcltd IMIofresltng P!JrorfExompliA'(5'9yrs)£xptcltd It'tltTmimi fJOl- '/t'f1Fig. 44 Three typical examples of the increase in the arterial resting POz and the drop in the venous peripheral restingP0:l by means of the 15 min 02MT quick procedure (variant GK 2-11 with simultaneous physical strain of 100Won a bicycle ergometer. From A to C increased P0 starting level. Individuals never previously treated with 02MT2procedures. Control series for comparison: slight, qu%kly diminishing increase of 11 when sham-treated (compressedair instead of 02)I!IR1N)10090v30mins each:(\--'-65JV~ t65JV•._- ---? ./" 12/,~~ ......... f4-10~ 1\~-f1IQlchtd yaIIH IlCC to /QeN-Tht ~ 91311POz-tr/ aflffstrenuous J(JmilTSexercise froiningover JdaysremainingPqt- rr / iiepressionafter recoreryfrom 'flli.6050SIono'arrideVIation234586 daysFig.45 Increase in the arterial Po afterrecovery from 'flu through strenuous 30 minexercise training over 3 days in a 42-yr-oldpatient
g r d, whi h con iderably contributes to thefast, large increa e in 11, i. e. to a great increasein the O2 tran port to the body tissue.In the inve tigation into the contribution of theindividual steps to the entire effect, one of thequestions which we examined was that of theincrease in 11 due to physical exertion. As a controlin the program of the 02MT quick procedure,O2 application and drug administrationwere omitted in 3 further individuals. An increasein 11, on average only slight and quicklydeclining, was then found (training effect). Theswitching process of the microcirculation withits lasting effect was not triggered by 100 Wphysical exertion alone. In contrast to there ult in Fig. 44 right, an increase in the P02-artafter strenous exercise training was generallyalso observed, if the strong physical exertionwas repeated on several consecutive daysFigure 45 gives an example of this type. Thethreshold of the switching function can becrossed and a lasting P02 effect achieved, asdocumented by part "d" of the curve shown inFig. 17, by means of strong exercise training(daily 3 h gardening) over 1-2 weeks, e.g.mowing the lawn.In older age and in the case of disease, thecapacity for high-charging of 11 by means ofstamina training or intensive sport alone isdrastically reduced. Variants of the 02MT,adapted to the individual performance capacity,are then to be chosen.1.1.8.5 The level of P02-art and 11, and its relation to the amount of circulatory reservesIn the discussion of our 02MT research the followingview has been repeatedly expressed bythroroughly competent persons. It was saidthat the aimed for increase in the P0 2 _ art couldbring about no improvement, as the gain insaturation attainable even in old age was only4 %, and the reduced P0 2 - art in old age was stillsufficient to saturate the arterial blood almostcompletely with oxygen. This view is wrong forseveral reasons:1. The gain of 4 % must be seen in relation tothe fact that the arteriovenous exhaustion ofthe O2 binding capacity of the blood is only20 %. Hence, an increase of an additional 4 %in the O2 transport means 1/5 more as comparedto the original 20 %, and that is a greatdeal in stages of weakness.2. The O2 supply to the arterial walls, necessaryfor the maintenance of a good arterialvessel system (good O2 supply to the tissue),occurs mainly due to O2 diffusion from thelumen of the arteries and is therefore determineddirectly by the P0 2 -art.3. The triggering of critical conditions, as wasalready pointed out above, does not generallyoccur when the arteriovenous saturationdifference 11 on the Hb02 dissociation curvecorresponds to the expected value for thatage under normal conditions, but when thevalue of 11, particularly when near to theminimum in the circadian cycle, sinks farbelow the expected value, due to acutetres ful events (e.g. infections, toxic stres ,reduced cardiac performance, hypoxemiaduring leep, high fever, chronic CO poisoningetc.). The more the mean level of thP and are raised the reater the cir-culatory reserves and the smaller the probabilitythat O2 deficiency crises (e.g. dizziness,Meniere's disease, collapse, attacks ofangina pectoris, myocardial infarction) willbe triggered.Figure 46, especially, the patient examples onthe left, gives a quantitative basis to the statementin the last paragraph. It is assumed in caseB that the starting level of the resting P0 2 -art is72 mmHg (9.6 kPa), which roughly correspondto the mean expected level for a 72-year-old.It follows from the further drawn scale of theHb02 saturation of the blood (standard conditions37°C, pH 7.4) that the degree of saturationis then still S02 = 93.3 %. As the furtherscale of the utilization of the O2 binding capacityof the blood shows, this corresponds to11 = 20.3 %, taking as a basis the normally applicablemixed P0 2 - ven of 40 mmHg (5.3 kPa).The numerical values named, characterizing acirculatory condition which is still just aboutgood enough, are drastically reduced when aa consequence of stressful influence a temporarydrop in the P0 2 - art and a ri e in theP02- ven are triggered. The case B in our figureshows just how severely the numerical value f11, the Po 2 _ art , and the 02 aturation of thblood can deteriorate in u h ca e . The w r ing points on the variou ale hift t d Pwithin the dangerou zone. Th ir ulatreserves converge toward z rooA much more favourable ituati nA in Fig. 46. Wh n th tarting 1 v 1re ting P0 2 - art i high (b tw n 9 ndmmHg ~ 12.7-13.3 kPa) th O 2 atur tialmo t 97 % and th h u ti n f thbindin ca a it f th b
lJrItritJ/pt¥Potient examples%mmllgutilizationof 0l -binding(Opacity. pll11eoloodCIrculation rt'~r~s%13A. YOIJIJD pallen" oro/dpalleril after O~T971009524IValue 10 be acll/ered by Ozl1Tstatus ofhosts ol'ffnst'CqaTC/,y ~ 'f)'n¢1290 23111098796;mporary reduction ilPOz-tTt f¥ 11-(m>1til Ine21-hrCfflf tina'lIIrougjlstressful p-taSSfS 1j95~~-~- ......----948. Palifnl inold a~ -1-(Expected ~vel for 72,ors) 93ltmporary redaction inPOz-tT/ or 1(/evtl in the2¥hr Qde, oaf thlVl.ig/Jsiressful processes 1)So.?~f6reaf dotget': M7 reserves)- - 8590858075605522--- -t- ----1-\70 20POrtrt.651513Rtdudlon inclirulotiJn ~ryt>sStatus of hOsts defen5/' capacityseverely redllcedlbily lileno longer frft fromph]Simlcom{iointshcrtased circulation riskNisIfofdomage to0tyJIlS through sIroin(cardiac inforc/ion elc. )Insufficiency at rest(11ftr!Sf, tlffJk~s)5010.. Rasa/1M/. Pulse mrmal680457.. Ibsa/levrl Pulse increased7573mixed vallJf 2 )40 POrven 0(normal COst)Fig. 46 Quantitative representation of the drastic reduction of the dangers of stressful events in older personsthrough permanent increase of the utilization coefficient 11 of the O 2 binding capacity of the blood. Guiding values 21 Assumption on the basis in our measurements of the reduction in P02 or 11-level during stressful events of very-artdifferent kinds.2 In subjects with a long-term very low P0 2- t (~
logical foundations13IrPtz12.........- ....... ~ .,f-IJ960 8o 2 4 614 16 188 KJ 12It ..Fig.47 Example of the behavior of the arterial resting P02 during the 02MT treatment of real nonresponders(slowing of respiration by 02 excess). Mean values of 3 patients [92]lOllThe main indication for the 02MT proceduresshould be seen as the prevention of illness.These procedures should always be used forprophylaxis at certain time intervals derivedfrom P02 measurements, in cases of pathologicalmovement disability or after approximatelythe 55th year of life (even earlier in exceptionalcases of levels P0 2 _ art < 70 mmHg Q9.3 kPa). In youth and middle age daily strenousexercise training (leisure sport, jogging, runningetc.) [12, 88, 95] is generally sufficient as ameans of permanently increasing the value of fl,or the Po 2 - art .1.1.8.6 Lung-conditioned, 02MT partial nonresponden; influencing facton, contra-indicationsLike every other therapeutic procedure, the02MT also has contraindications and therapynonresponders. There is usually a contraindicationfor patients in whom the body's respiratoryregulation is not controlled as normal bythe PC02 of the blood, but primarily by thelow P0 2of the blood (Loeschke's effect [96,97]). In these patients the 02MT can only beperformed with special precautions·.In some patients, as Fig. 47 shows, even a reductionin the arterial resting P0 2 of roughly5 mmHg due to the 02MT procedure was observed.In these patients a drop in the P02- venunder 02MT must have been attained.As is known [96, 97], the arterial hypoxemiawhich exists in generalized respiratory insufficiencyis associated with an 02 deficient controlof ventilation. Application of O2 eliminates• Artificial respiration if necessary. Recognition ofparen with abnormal respiration regulation bymeans of initial test, e.g. with checking of the bloode. or the dangers of artificial respiration for patienwith severe chronic respiratory insufficiency02 air mixtures with 02 proportions> 50%(JellPUatory depre ion, arterial P 02 60 mmHg,the adequate stimulus for the 02 deficiencyreceptor, and so alveolar hypoventilation (withthe reduction in the resting P02-8rt alreadymentioned), and also, in such cases, in increasein the PC02_art (hypercapnia) and the risk ofapnea can occur. When the generalized respiratoryinsufficiency is considered to be a relativecontraindication [98, 99], which is absoluteunder outpatient conditions, and when attentionis carefully paid to the blood gas analysisand the acid-base balance in partial respiratoryinsufficiency, where we have never observedany dysfunctions, the 02MT has proven iprincipal applicability under these circumstances,too. The temporary inhalation of.oxygen in patients with chronic lung di aand consecutive cor pulmonale has been ucessfully practised with the aim of redu ingresistance in the lesser circulation for[100]. Whether, and to what e tent, thcould have a comparable If ct i to bsubject of future inve tigation ppropriin pulmologically ori nt d tr atm nt nHowever, there can hardly b any ri f rpati nt in our th rapy progr m . hdoubling or trebling of th O 2 ont n iinhalation air in th 6 h pr do MT, or th t chnology d v 1 d f r ·
Ip even to (particularly to)severe chronic lung insufficiencylDffi,cien1ey).c .ses is accompanied by ahe normal acid-base status ofthis reason we have alwaystatus in the research phase inype. So far a change in statusobserved in these checks.eV6lrY In early 1982 of the drop in the-"Jft forced us to a change in the01 responders and nonresponders toe nonresponders can be defined astjjldi~ri'duals in whom there was neithere in the P02-art, nor a drop in thee. no improvement in the value of 112MTI. It is no longer permissible, asIn [91], to class individuals in whome in the resting P02- art is found, anonresponders to the 02MT (see alsoabove).this fundamental finding, the questionmfluencing factors on the responder rateterence to the increase in. the P0 2 -art istopical significance, as the absolute valueP02-art is in some important tissues ofmpnism (arterial vessel walls, lens of thec.) alone decisive for the O2 transport toe, and good lung function alone benethefollowing links in the O2 transporttions of factors influencing the lung-coned,partial failure rate of the 02MT werey be taken from a pilot study [92]. Thecarried out on 46 unselected patients,ales and 17 females) within an age range-75 years (x = 55.9 ± 11.3 years), withnumber of 20-30 treatment hours,d that, with a mean P0 2 - art under O2 inof115.3 mmHg (~ 15.36 kPa) insteadmHg (~ 16.7 kPa), the failure rate rosebe ween 15 and 20% to 33 %. It is cerno.coincidence that in the gro~p with aoportion of non-responders (fallure ratea mean P02-art of 105.5 mmHg (~ 14.1a established during inhalation. It cann from these findings that the success rateapplication of the 36 h 02MT procedurequickly when P0 2 - art under inhalationbelow 125 mmHg (~ 16.7 kPa) (oxygenparingly applied, e.g. < 3 I/min; parevena certain therapy success when themain the arne, if a reduction in theoutput can be recognized (less train on theticularly severe, advanced degeneration of thelung-heart system, e.g. chronic bronchitis).According to the above, the measurement ofthe P02- art (20 min) after begin of O 2 applicationis one of the routine measures of the02MT. Examples of such measurements for the36 h 02MT procedure have been compiled inFigs 48 and 49. In order to ensure that thethreshold of the switching mechanism of themicrocirculation will with great probability becrossed, the O2 flow should be so adjusted thata P02- art between 125 and 145 mmHg (16.719.3 kPa) is measured under O2 flow. This aimis often difficult to achieve, especially at thebeginning of therapy (Fig. 49). In such cases allmeans should be used to increase the P0 2 -artunder O 2 inhalation during the first sessions.The adjuvant means include: the increase ofthe O2 flow to 5 Ilmin and more; activation ofthe applied O2, HOT* procedure during 02 inhalation;increase in blood fluidity; administrationof 0.5 g nicotinic acid; drinking of a cup ofstrong coffee; treatment in a lying position withupper body at a lower level (resulting in aP02-art increase of up to 6 mmHg ~ 1.33 kPa);preceding physiotherapy to improve respiratorytechnique [101, 102] and to improve ventilationvalues (gain of up to 15 mmHg ~ 2 kPa);simplification of breathing training by means ofthe respiration biofeedback instrument [103]and, in chain smokers with CO poisoning of thehemoglobin of up to 20 %, preceding detoxificationby means of a 15 min 02MT quickprocedure [18].According to the findings discussed, the groupof lung-conditioned partial therapy nonresponderscan be divided in six subgroups:1. Structural pulmonary diseases with diffusiondisorders, namely, in the existence of ageneralized respiratory insufficiency. Theproportion of such cases in nonselected patientsis less than 10 %.2. Cerebrovascularly decompensated patientslacking compliance due to an organocerebralpsychosyndrome.3. Patients with a high proportion of huntvolume in the lung.4. Individuals with severe CO poi oning ( .g.chain smokers).5. Cardiopulmonally decomp n at d p ti nt :a recompensation i a pr r qui it h f rthe implem ntation of th pr dur.6. In per on with a high P0 2 -art r 0 mm~ 12 kPa .g. du t ph i 1 t min r ining),a high r I v I annot b t t
,. <strong>Physiological</strong> foundationsIf-RoN 10kset for POrrrt ~ 125150 2081111" ~~~140 t-o.portiol 101/1/1"(118rale as to130 p02-arf increase120 16/fPa~20%110~330/0100Porrrf90 12141 ~60%701------10~~-----1-------+---+----+---+------+---~ 8art resting pO;/a7g-termiThalalionwdhO£indiaited.1 2 3402 flow -----.--5 6 7/mirr 'Fig. 48 The level of the resting Po resulting 20 min after start of 02 inhalation via the 02 wasting (outdated)nasal cannula as a function of the (32 flow for various types of patients (measurements taken in a sitting position).The Pi02 value to be attained during the individual sessions of the 36 h 02MT should be > 125 mmHg~rt .1 To be supplemented by respiratory therapy [102, 103]; check Po «40 mmHg)2 Patients of these groups should breath oxygen at the beginning o'li'tJ first sessions in a lying position with thehead directed downward, in order thereby to raise the A 02 level under 02 inhalation by about 6%-artThe factors influencing the rate of lung-conditionedpartial therapy nonresponders for the36 h 02MT procedure was quantitatively invetigated in a special study (104): after multiplecontrol mea urements on the same personon the arne and consecutive days alway at tharne time of day, the P02 level m a ured inkPa), and mean d viation w r blow 3 mmHg(0.44 kPa). With th in lu ion of a h rt af tpan we can thu peak of an in r a in thPo 2 - art • wh nan incr a of mor than 5 mmHg(0.67 kPa) i m a ur d in r p at d ntr I .Proce ding from thi ,w w uld lik t gi thfollowing definition:
Basic mechanisms and functionsOr flON to set740 r--r---"--~--+-----r- IfPa130 t-----+--18{"allure rote as top02-ortincrease, roughly~20%120 t------1--~,.--t7=----+_-~+_--.J.76~33%170 t----i.-~\)/ 0t~· \)~ ,ff\c1Ir--~-I---+-t~~~ 5~\~\(,IIF-----+---I-~.~t\~ {1·;-l--'1.-01-.-.14---+---+120< ?J ••v.... ----If---------I1 60 0'-100%/~~\S ~ *.Q •• iOO~er 1)• ~ •• •·MaiO 570 t-----oO ~ • •• ell•· Heasuremenl 20milS after• :~. slartof~-Innalation60 t-I--+-----+--------j~---+----+----1-850 ......__~__.l--__~_--l.__--l.__......1o 1 2 3 4 5 6 {mirr'Oz-flow-......~~10Fig.49 Improvement of the pul·monary diffusion/perfusion systemof a normal person (NP)aged 53 with the increasing numberof treatment hours, exemplifiedby the P02 ' at rest, as-illtfunction of the U2 flow duringtreatment in dependence on thetreatment time1 Treatment not indicated forthese types of patientsA P02-art responder is an individual in whom,after 02MT, the P02-art under resting conditionsis measured at more than 5 mmHg(0.67 kPa) higher than before 02MT. Atherapy nonresponder is a person in whomthis increase is not achieved. The non-responder rate is the proportion (in per cent)of patients without respon e among the totalnumber of individuals in the group underconsideration. Corre pondingly, the responderrate is the proportion (in per cent)of responders in the population under consideration.UnselectedNo ofindiYlduo/s 7 23 48 44 15 sub'eelsAge from- to 35-45 46-55 56 - 65 66 -75 76 - 64 years%100801V6040200ageFig.50 Dependence of the non-responderrate (V) of the 36 h 02MT processon age (discriminative index: 6.PO,-< 5 mmHg). 137 individuals tested-8rtbetween 1977-80; treatment conditionspartially not yet optimal at the beginningof the series
1. <strong>Physiological</strong> foundationsAll"i1tIJ~illJo/s N 7 23 48 44 15UnstIPdedIlJt'f'sons.~ 35-45 46 -55 56-65 66-75 itS - 84 ~%20t/~15 ~10LiPiIJ-tJ150// "\..V~ .."Fig.51 The dependence on age of thegain in the lJ'O'_art before and after _02MT. The entire sample was a total of137 individuals; controls and patientsbetween 1977 and 1980; at the beginning,process management not yetoptimalAb. tJfidfi/uols N fI) 17 39 37 935-45 46-55 56-65 66 -75 76 ~84 Years1LiPo,-tJ1%25t----+---+- :--~-_l_----J20 l/'~_/ ....~15 r----+.~ ,:....-+---+---+--~10 ..,;t-....". .~---+---~-_l_----J5...---+---+---1-----+------1oL..-_---L.__....L-__L..-_.....J.._----JFig. 52 The dependence on age of the gainin the tJ'0 2 -art before and after 02 MT.The entire sample was a total of 103 individuals;controls and patients between1977 and 1980; at the beginning, processmanagement not yet optimalInfluence of age. Figure SO summarizes the percentageof nonresponders V for all treated persons,dependent on age. A dependency onage can be clearly seen, inasmuch as a lowerage limit can be defined, below which therapeuticsuccess, in the sense of a rise in P02-art,can only be expected in exceptional cases. Itcan further be seen that a positive responsewith a low nonresponder rate is possible in theage range from 46 to 75 years. Above this agegroup we must again reckon with a higher nonresponderrate.Figure 51 shows the relative gain in P0 2 -art as aper cent of the starting level for all examinedpersons. The drop in the gain in the oldestgroup is primarily a result of the higher nonresponderrate. If we therefore eliminate thenon-responders from the same population andpre ent the gain in the same way as in Fig. 52,then the gain should correspond to that of theyounger group. That is not the case, however,the figure how. The gain already dropso the age group of 66- to 75-year-old in-It is therefore probable that our procedureencounters limits here which are primarily pulmonarilyconditioned. The regeneration procedureno longer succeeds with full intensity incases of manifest, morphologically fixed disorders.This is expressed in increasing age atfirst only in a reduction in the attainable gain(Fig. 52, start of reduction already in the 66- to75-year group), whilst the nonre ponder raterises significantly with further increases in age(Fig. SO).Influence of P0 2 _ artunder O 2 inhalation. If wearrange our volunteers and patients accordingto the P0 2 - 11rt level reached under O 2 inhalation,we find a clear dependence of the nonresponderrate on the e level in that the nonresponderrate i greatly reduced with highP0 2- art levels, and increa ed with lower Ie 1.Such statements can only be valuated a tland quantitatively if the upply of O 2 i e tlcontrolled. Thi i not fully th a ith urvolunteers, a th oxygen wa appli d u ing thop n y tern (nozz! appli ator), 0 th t vari
unctionsI~kPaFig. 53 Dependence of the number N of respondersand non-responders of the 36 h 02MT procedureon the P02 measured during 02 application.Result: The gregar the increase in P0 • rt 2betweenthe starting level and the measurement revel duringthe first session, the lovver the failure rate.Measurement 20 min after the start of the firstsession. The entire sample was a total of 137 individuals;controls and patients between 1977 and1980; at the beginning, process management notyet optimaltial pressures, occur, dependent on aely large number of factors (see our innonsin [5 I ]).heless we can deduce with sufficient acforclinical requirements that the nonderrate rises significantly if the P02-artnder inhalation with an O 2 flow to theator of approximately 3 I/min is conblybelow 120 mmHg (16 kPa). AccordoFig. 53, the nonresponder rate is thenthan twice as high. If a P0 2 - art in. theof 120 mmHg cannot even be achievedan inspiratory oxygen concentration of" (according to our measurements this cor-responds to a mean flow of 5.6 I/min in theopen system), then a positive effect of 02MT,in terms of a permanently increased P02_art,is less probable.More recent observations have shown that the"nonresponder rate" in terms of P0 2 - art can bereduced by the transition from a nozzle applicatorto a mask applicator (with storage balloon,see below), because with this the O 2 is alsodelivered via the mouth (no uncontrolled temporaryreduction of the O 2 flow when the testpersons are talking, or in breathing through themouth in treatments during sleep.%451-----~---+-·_---f---__t---___140 J----..------1----+----t-----r-------;351-----p!IIIII,-=:---+-----f---__t------tr:J---.-+----~r_______1V 20151----l---~---~;;:--_r_--_,10n ~ ~ ~ U ~~ 56 mmHJ 7,467~""-'1~------l-Heosuremenl alwoys duringfie fti-st sessiOnof~~durt---+-----+----+--:-=----+-I:k~--i5oL.__..L---..J.----L..----I.---....Dependence of the "non-responder rate" V of the 36 h 02MT proced~re ~~ the increase in Po -artIf r tlrting 02 application). The entire sample was a total of 1~7 indiViduals; controls and ~tlents771nd 1980' at the beginning, process management not yet optimal. Result: The greater the Incre, . durin he first session the lower th failure ra
~~itItINitIIJq/s N 31 54 52~IBIP~-.t 81 mmHg/linprxttIUI't 10.79 IrPa%454035 ~/30125/V201510• .///'5 #easl.Jrement before thelim!,orocedl.Jrlj sessIon.0P02-trf ..Fig. 55 Dependence of the "non-responderrate" V of the 36 h 02MT procedure on theinitial value of the PiO" . The entire sample.,-artwas a total of 137 indiViduals; controls andpatients betvveen 1977 and 1980; at the beginning,process management not yet optimal.Result: The greater the increase inP02 betvveen the starting level and themeasaJ~ement level during the first session,the lower the failure rateInfluence of the initial increase in the P02-artunder O 2 inhalation. Closely connected to thisis the rise in the P02-art under the conditionsnamed, in relation to the initial resting value.The greater this rise, the lower the nonresponderrate, as in Fig. 54. It follows from thisthat patients with, for example, a low restinglevel and a relatively high increase under inhalation,can still be treated with a chance ofsuccess if the target level of 120--125 mmHg(16.0-16.7 kPa) is not reached under inhalation.Influence of the starting level of the P02- artbefore the procedure. If the values we obtainedare arranged according to the starting level ofthe P0 2 - art before the procedure and the nonresponderrate considered to this, then it can beseen, as in Fig. 55, that the nonresponder ratecorrelated positively with the resting level. Thelower the initial value, the greater the chancesof success. This is the statistical evidence thatyouthful P0 2 - art levels are no indication fortreatment.The procedure's slim chances in individualswith an initially high resting value are easy tounderstand. It is not possible for the 02MT toincrease the P0 2 - art levels to considerably abovethose which exist in youthful persons withhealthy lungs. An increase can be attainedwhen these levels have dropped, in old age orfrom another cause. Then, however, and ourresults show this, the increase is all the better,the greater this drop is. Particularly, patientin whom the P02- art resting level has sunkbelow the age-dependent "expected level" andwho are therefore primarily in need of help,have good prospects for success, if the conditionsresulting from the other influencing factorsare fulfilled.1.1.8.7 Further causes for lung-conditioned partial therapy nonresponders; distribution disorders;proportion of the arteriovenous shunt volumeThe causes of the reduction in the P0 2 -art andthe corresponding increases in the mean diffusion-effectivealveoloarterial O2 partial pressuredifference APo 2with increasing age are to befound less in the deterioration of the ventilationparameters with age, as in Fig. 56, andmore in the increase in the following functionaldisorders [32, 80):1. Diffusion disorder: disturbed proportion between02 diffu ion capacity DL and perfuion (pulmonary blood flow) Q.2. VA /Q distribution disorder: di turbed proportionbetween alveolar ventilation' andperfusion Q.3. DL /Q distribution disorder: di turb d proportionbetween O 2 diffu ion apa it DLand perfu ion Q.4. Increa ed arteriov nou shunt volum .The perfu ion Q of th lun apillari nimportant rol in th fun ti nal di . Iti th refor u,nd rstandabl th t th
n...--t-:If-+---4-~-+-Residualvolume.30 40 50 60 70 80 90 100 year.'~Fig. 56 Total capacity, vital capacity and residual volume ofthe lung, dependent on age in individuals of average size accordingto [32]ically controlled regulating and switchingchanism of the blood microcirculation, dissedabove, must have a great influence one level of the P02-art, either positively (distennof the capillaries; 02MT, exercise training)negatively (narrowing of the capillaries; pertentstressful influences). The high P0 2 - artactivity of the lung is virtually lost in thertial nonresponders. According to the aboveexplanations the reason for this can be a para-lysis of the cellular vessel wall switching mechanismof the microcirculation, or a critical increasein the arteriovenous proportion ofshuntblood in the lung. The first experimental findingson this very important problem for themaintenance of health resulted from a (nonvoluntary)self-experiment [105 106]. A nomogramfor the determination of the arteriovenoushunt volume in the lung can be found in [107].The effect of the cellular switching mechanism of the microcirculation in the other bodytissue; effects of P02-vensponsible for both changes. Such a mechani mworking in the whole body, has been unknowntill now. The fluctuations in the resting P0 2 - venshow that the O2 utilization in the ti uechanges depending on the bioenergeticall controlledthickness of the endothelial wall andhence the blood flow in the capillarie .1.1.9.1 Change in the diffusion parameters of the capillary systemThe finding that, with the change in the restingP02-art due to 02MT, a counterchange in theresting P0 2 - ven simultaneously takes place,necessarily led us to the recognition that itmust be the same regulating or switching mechanismof the blood microcirculation which occursgenerally in the whole body, which is rethediscovered, long lasting reduction of there ting P02-ven after improvement of thenergetic situation, the resting P02-ven dropsfrom, e.g. 40 mmHg (5.3 kPa) before, to levelsof about 25 mmHg (3.3 kPa) after. The O2ran port to the whole body tissue therebye considerably as does naturally the O2an port to the Krogh' cylinders surroundingcapillarie. How can this increa e in O2. u ion be explained, de pite the fact that,e to the reduction of the re ting P0 2 -ven ' therenee in pres ure deci ive for the O2 difl\II:lonicon iderably reduced? The quatitativanswer to this que tion i coar el hematicallydrawn in Fig. 57, for the venou end ofthe capillaries. When, before the O 2 T pro edure, the endothelial welling ha oc urr d andhas led, due to a narrowing of the r ti nto a reduction in the ir ulator lum thresult will be a poor O 2 uppl to ti ubecau e th diff r n in O 2 pc ur nd thdiffu ion ar a th latt r of hi hid t rmin d by th lum n, i' r du d nd fin II thO 2 con 'umpti n in th thi n d nd th Humi' incr a d.
BDuring OzMTprocedurecAfter OzMTprocedureP Oz - ren 1:1 25mmHg (3.3 kPa)reduced swellmgReduced 0z-pressure differenceReduced diffusion areaJncreased ~ -consumption inendotheliumReduced blood flow QPrJDr ~-supply to the tissueGreatly increased O 2 -pressure differenceReduced diffusion area6reat/Y increased 02 -consumption inendofhelium 1Jncreased blood flow iJ despife iitiJ. IlITOWeddiameter (COP-increase,exl!!Cist training)Reduced. 0rpressure differenceEnlarged diffusion areaReduced 0z-consumption inends/heliumJncreased blood flow a.Good Oz·supply to the tissueFig.57 02 diffusion parameters at the venous end of the capillaries before (A), during (B) and after (C) 02MT.Rough schematic presentation. Example: 15 min 02MT quick procedure1 Predominantly therapeutically effective for reducing endothelial swellingThe O2 pressure difference is greatly increasedduring the 02MT procedure, just as the volumeof circulation is greatly increased by (simultaneous)physical exertion, with the result that anendothelial detumescence is triggered. When theendothelium has again reached its· original sizeafter the procedure, the diffusion area dependenton the lumen is simultaneously greatlyenlarged, the O 2 consumption in it reduced andthe circulating volume has greatly increased dueto the enlargement in the cross-section. Thepositive changes evidently overcompensate forthe influence of the reduction in the O 2 pressuredifference, so finally an improvement inthe 02 supply of the tissue surrounding thecapillaries results (see also Fig. 6).1.1.9.2 Slight drop in the P02-ven with age; dependence of the 7l-value on ageFrom the overview of a very large number ofresting P02-ven measurements in volunteers ofall age groups it could be seen that, in personsdrop in the Po 2 - art • And, indeed, referencewith a particularly low resting P0 2 -art theresting P0 2 - ven was, as a rule, also somewhatreduced. The organism evidently responds to areduction of the 02 saturation of the bloodwith an increased 02 exhaustion, in order tomaintain a sufficient O 2 or energy status. Theexistence of this counter-regulation leads usalso to expect, due to the average decrease inthe resting P0 2 - art with age (Fig. 32), a con ecutive age dependency of the resting P0 2 -venwhich will ameliorate the effects of the severe[36] reports on a slight drop in the mixedcentral P0 2 - ven with increasing age.In Fig. S8 the curve for the dependence of themixed P0 2 - ven at rest on age according to[36] is drawn under the standard curve for theresting Po 2 - art , already discu sed. De pite thdrop in the upper' curve with age the cowse ofthe lower curve surpri ingly lead to a slightincrease in the 7l-value with age. Th fa t thathe O 2 tatus neverthele significantl d rirateswith increasing age ( ee beloplained by the g nerally v re r du ti n incardiac output.
1tJD908070~~'"/~~/ I,../'~ B~Ih ~'y-,"..... ~vRtlatiw chfl1tJdlrislic IJr ~1/k-_10zIicisiw fry4-1nJnsptJrt IDfissur.s JlJlllifti IJy 'or1rriJlOz·tlff/asiM,t. g.orItrii WSSlIwolls, ttns 0/tilt qtttl.17 =24% =25%=27%/vRe/alive ChflfQcferislic for fJ/lt 01PJ~ll!yJOzDecisivt for Oz-tron3fXT! riahemoglobin 10 tlte othtr tissues533020 20~30~ ~iXttl Ilren ,alftsttrQ-/eQtr. faHifnoefereta/.7J6J40 50age60-7080Fig. 58 The dependence of themean arterial and the mean mixedwnous P02 (both at rest), as wellas of the arteriownous 02 satu-90 ytors ration difference 71 on age. Untreated,healthy individuals1.1.9.3 The increase in P02.ven due to stressful influences, particularly in conditions of weaknessThe strong dynamics of the resting P02.ven arevery striking, and have a great influence on theutilization factor of the O 2 binding capacity ofthe blood, due to the great steepness of the O2dissociation curve in the area of the venouspressures. Examples of the course of P02.venin lack of exercise, operation and in a phasewith a 'flu infection are shown in Fig. 59. Inall cases the '11 value sinks critically. The feelingof weakness in illness (energy deficiency),which forces the patient to stay in bed, correlateswith the low 'I1-values. The main contributorto the drop in '11 is the significant risein the resting P02.ven, which has been observedin all cases so far. From the course of the P02levels after the end of the 'flu infection, we candraw conclusions about the speed ofrehabilitation.The resting P0 2 - art reducing effect of the veryvaried stressful influences which we discoveredin [20, 21] and have commented upon in Paragraph1.1.8.2, is reflected in the increase in theresting P02-ven' The O2 transport to the bodytissue is even more severely reduced by strongstressors than we had earlier suspected.The great drop in the 1'1-value in operations dueto general anesthesia, leads us to recommendthe implementation of 02MT before and aftersurgical interventions on older patients in orderto reduce the risks [108].Figure 60 shows an example from the fi Id ofcancer therapy, of the wor ening of th O 2status due to the distre s of h m th rapradiation therapy or urg ry whi h i tillhardly known or taken into on id rati n.
A Bi3lrfss 1'1oafofmovement 8 0pl'roti()~ injury90nntt:p~150Ws!J 403020diSlress una'Sl'VW-~10m oflllO~ntI~- 1- ....~~ 1"........ tt"~).'i ,'"25% 16% - "-pO _,All"""-.o 2 4 6 8 10 12141618t1ofSt •90mmllg80706050403020operaniJnle/1JliUtDT~J;;;;1~0 2~1c!.Si\.--........IJedresto2 4 6 81012141618tioyst •10864CJnfluenzanormaI course90mlllhp80r ::50p~k5t) 403020lilledion rehabilt/olton- flLlIl.rox. BrJJY.§.~./A\/ \\ -,',.-,''---(1---22% 13% 21°/.IIVIPtfresl024 6 10 1 '14 ~ 18t.'D'Sr.~_-U~_.J-t--~.-DJnfluenzawith quick rehabilitation15min~ I1T flUielfprocfliurttilkcltiJn-rehubllt/ot/onAIfew !lours .I/90mmll§ ~' '" -_L80706050403020r-:~---f- --- I-23% 13% »>/0 -47% -/V7~b~re; i'-....I Io2 4 6 8 10 12 1416 18l ~Jt---I...10864Fig. 59 Examples showing thedecrease in the arterial. and theincrease in the venous P02 (eachat rest) by distress and severelack of movement (A), operation(B) and influenza infection (C,D). 11 = utilization coefficient ofthe 02 binding capacity of theblood1.1.9.4 The reduction of P02.yen by means of 02MT procedures and exercise trainingAt the beginning of 1982 it was discovered [7]that a further basic effect of the 36 h 02MTprocedure is a lasting drop in the restingP02-ven' This drop, which nor~allY contribut~ssignificantly to the increase In the 71-value, ISalso very often observed, as already discussedabove (Table 5), in persons in whom there wasno lasting rise in the P0 2 -art. The mean drop inthe resting P0 2 - ven was 4.8 mmHg (0.64 kPa)in partial therapy responders and 6.2 mmHg(0.83 kPa) in partial nonresponders. In bothca es there was an increase in the 71-value to150 % of the starting value.In a pilot . tudy with larger numbers of subjects,the changes in the resting P0 2 levels afterthe 15 min 02MT quick procedur wer investigated.The results of the P0 2measurementsafter a single (first) application of thisprocedure in nonselected normal persons aresummarized and statistically analy ed inTable 6. On average there result an in rea e of4.2 mmHg (0.6 kPa) in the re ting Po 2_ , artadrop of 10.3 mmHg (1.4 kPa) in the r tingP0 2 oven and an increas of 19% in th 71- alufrom an ab olute 28.2 % b fore. Th ° tranportto the body tissue has therefor be n increasedby the single 15 min 02MT quickprocedure to 164 % of the starting 1 v 1. Thonly light variation of th Po 2_ nand th hightati tical ignifi anc r ulting fr m thi rremarkabl ,a i th fa t that thi v r tr nff ct, whi h n bud in m n in
AChemotheraPfdrug toxiclfyIreQtment pefiotJ.~+---l71-13 %20 o!------I--....&....---'---I--....L..-.....10 20 30 40 50 60t ..mmHg90BFractionated irradiationcirculating foxic tissue degradationproducts807060504030~_..ooI-~.;.o~t":'.11.-27 %,__......pOz·venV_...~"1',111.=14 %I I l-I-20 a 10 20 30 40 50 60t ..807060504030[OperatJonside -effects ofanafstheslQoperalton+•-'I' ~., pOZ·D~ri~r-d~-"l ..231fa1P~I-"'''17r-o20 a 10 20 30 40t -'g.60 Remarkable deterioration of the O 2 status (or of the 11 level as the main factor of O 2 transport to tissue);.'"''IllI'IRr cancer treatment by drugs (A), fractionated irradiation (8). or surgery (C); figures for orientationedicine, in contrast to the quickly fadingaining effect, lasts a very long time (weeks tomonths and more). With between one and threeapplications of this quick procedure the averagecrease in the resting P02-art is only roughly/3-2/3 of that attainable with the 36 h 02MTrocedure. It is therefore recommended thathe combination of both procedures be conideredin cases where the P02.art remains tooow.igure 61 shows a test case of the improvementof the arterial and venous P0 2 values by meansof the single and double repetition of the5 min 02MT quick procedure. It can be seenhat a single or a double repetition is worthwhile.This example and also those discussedelow show the endurance of the treatment efectover the (arbitrary) observation time of2 10 weeks.n a self experiment, the external conditionsd cour e of which are presented in Fig. 62, itdiscovered that conditions of weakness ofthe organism are characterized by a fast andgreat increase in the resting P02.ven or. drop into close to the base value. The organIsm proitelf from damage (e.g. damage to organs)mg thi dangerou phase, by bedre~t and aincrea e in cardiac output (pulse mcr asfrom 60 to 66 per min in the example). Theself experiments further showed that it is possibleto eliminate the cause of the condition ofweakness (i.e. O 2 deficiency) in less than1 hour by means of the 02MT quick procedure.Under the very high, effective O 2 inhalation asurprisingly high level of physical exertion, ufficientfor the procedure, can be tolerated,despite the previous condition of weakne .The bioenergetic control of the capillaryswitching mechanism of the microcir ulation(with a small time constant) is reflected negatively(distress) on the 3rd day of the e perimentshown, i. e. "capillary narrowing , andpositively, i. e. "capillary di ten ion", on th4th day at 11.50 a.m. (quick procedure).Several (easily verifyable) findings about thimmediate arrest of the consequences ofdistress of the type de cribed in our figur ifthe quick procedure i immediat 1 impl m ntedat the fir t symptom hould dip intan important pra tical aid in futur m di in .A furth r typical r 'ult with a r imilarcour e of the POl and 11-valu L gi n in Fi .63. In a 'flu infection with fi v r th r isev r incr a in th r 'ting P nd 11approach th ba' alu. n' m r thcritically r du' d valu f 11 i n rm liz d
Table 6 PO b measurements of unselected individuals, at rest, show the (Iasting l ) increase in the arterial Po and the statistically highly significant reduction in the\l8nous PO~ rought about by a single (first) treatment with the 15 min 02 multistep quick procedure GK ~.,P0 2 measurement column 3 at least one day after end of process on the same arm (usually the right one)1 2 3 4Individuals before 15 min 02 multistep after 15 min 02 multistep Differencequick procedurequick procedureNo. Age SexP02~rtyearsP02~nd 9 11 P02~rt P02~n 11 P02~rt P02~nmm 9 11mm 9 % mm 9 mm 9 % mm 9 mm 9 %1 75 d 75 48 13 (flu) 84 34 32 + 9 -14 +192 32 d 84 50 12 (flu) 88 35 30 + 4 -15 +183 65 9 82 40 22 86 29 40 + 4 -11 +184 63 d 64 20 57 77 17 66 +13 - 3 + 95 58 9 64 22 52 84 18 64 +20 - 4 +126 70 d 66 30 34 72 16 67 + 6 -14 +337 45 d 80 42 19 82 32 33 + 2 -10 +148 46 d 70 44 15 76 22 53 + 6 -22 +389 71 d 78 35 27 70 18 62 - 8 -17 +3510 52 9 80 30 37 75 25 47 - 5 - 5 +1011 39 d 79 32 33 84 26 46 + 5 - 6 +1312 58 d 72 36 25 74 29 37 + 2 - 7 +1213 66 d 71 34 27 74 26 45 + 3 - 8 +1814 58 9 78 32 33 80 25 48 + 2 - 7 +1515 72 d 64 40 17 64 28 37 0 -12 +2015 58,0 Nd N9 73,8 35,7 28,7 78,0 25,3 47,1 I + 4,2 -103 , 2 +18,9 I=11 =412,9 7,0 8,6 13,3· 6,7 6,1 12,8 ± 6,7 ± 5,4 ± 9,21 The effect continues with a healthy lifestyle and disappears only after severe distress. This is a crucial difference from the "training effect", which is knownto wear off after only about 2 days. (See also Fig. 44)2 tc5 ~ statistical significance with a probability of error of 1%
9S15m;n quick procedure (Oz-MTgymnastics GK2)1.51 Z.na 3.rd trratmtnt• t •kPa"1390pO~-a't .,~ ~~, Lasting effect85lJa---------- ~--- ~ ~-1-- --'"'-4 l~""""",~(·80''"6S-"12 affer one year thePfJrrrt is still114- 10mmHgoboYf theexpected lerel10 expected level4- of the resting9 PfJrrrt ,atrtst,for 66 years6055'2=22 -40-54-54 -52-49% 7l='-9% -I-I-873530\pO/.-vtn,I-I-'"I6+- exp«itd lerelof the5 mixed P Orren252015105greatly improved0z_-utilization"Il"""321o3o36t ..91215days"1. 61 Measurements of the (slight) increase in the P02-art, at rest, and the (great) drop in the peripheral Po ,at rest, by means of the 15 min 02MT quick procedure with simultaneous physical strain. (Variant GK 2-1 wit 2 n vencycle ergometer 100W, repeated twice) in a 66-yr-old female, treated roughly one year ago with the 36 h 02MT.tJ =utilization coefficient of the 02 binding capacitY of the blood" hin approximately I hour by means of theMT quick procedure, and finally increasedthree times the value. The measured valuese document the success of a fast rehabilitanafter influenza.e effects detected on a patient undergoingbination treatment with the 36 h 02MTcedure plus HOT*, which in January 1981at first attributed primarily to the HOT*_Kedure, are summarized and commentedin Fig. 64. In this example it is highlyy that the life of the over-90-year-oldDI1:ient was prolonged by more than 2 1/2 yearse fast and lasting increase in the dangereducedl1-value. The increase in pulseoccurring due to critical O 2 deficiency shouldalways be seen as a very serious warning signaland taken as grounds for the implementationof an 02MT variant suited to the phy i al performancecapacity.In measurements of the re ting P02 before andafter 3 weeks of stamina training (running) alasting reduction in the P0 2 - ven (and in r ain the 71-value) wa found a for 02MT. Throughstamina training, too, the microcirculation isevidently high-charged long-term.Figure 65 how a ch mati pr ntati n inwhich the main conn ction b tw n th 1lular capillary wall wit hing m h ni m f thblood microcirculation and th ari u p itior ne ativ influ n ing fa t r ar umm riz d.
serert~ hyperoxia pure 0 } .distressstart " l Oz-I1TquICkprocedure~t---+-oI strom, SOWatlmmHg r----r-----,r----...,- - - - ----:pu::':I.'i: st:o:::;r,'::96;"1L~,~- ...-fJ..-::---"":"'- k Pa80 t----+-----l WtflK slrtssreocIJon ------+----~,v.:!pulst 60 of P, ,7570......-- - _.J~f_ _JUISt"-__-J551l=44%(!) ~ = 13 % (only) "1=39 =50%50~~~------J---+-+8155 Great drop in Fast remoYOl of50 the peripheral consequence of 7POz-1M ,at rest, tr--t----+---I.----~---l~distress by means ofPOz -'5 bymeansof1he .~ SOWott-15min exef'C'OiMTregene· f tTainingt15min ,01--t measurement•10txpttled !erel oflilt9.... POz-trf latmt,for 7Syears5rotlon procedu· ~ nighttime inhalation (251 O~min)40 re + dail~ 1x {:? - Ipec/onnina! comn!oinls ----\4---.......;;....-~1_4~ ex,tded !ere! oftilt.Oxygenabund ~ ~ ._! " , d D35 ~~J. diarrhea I nausea P"'r~ 5 mlxe rOz-ren~ (circulatory disorders) fJ.. l"q/30 1-----+--_,_'1 ~ , __--+ ~~-I'l!'~ ,0/'to.r?,25 '----.........- __..L...-__....J l0L,.!_--"__".L.1_--"_....:...12:;.L,o:...'c:..:./o:.;c::.;.k.... ,__1st day 2nd day 3rd day-'thday(normal) (normal) (dlsfrtss)Fig. 62 The critical increase in the venous Po6th day (roughly the somePaz -Imls on lilt 53rd doy)Lasting P Orren effect!at rest (drop in 71) as a consequence of circulatory disorders aftersevere distress and the immediate reversal of t~is critical condition by means of the 15 min 'V 2 MT quick procedure.Bioenergetically controlled switching processes of the microcirculation, of a negative (distress) and positive (quickprocedure) kind. Male, 75 years85mmHg807570651;;Po 50'2 4-5-bed restI flu - infection I at times 39.5°[fererJI7/,,23%o23~ hyperoxia ,pure 0 2 }start . 7 Oz /1Tquick procedureI I I strom 100Watt~i::- - - I Po _~ -:air;;t -.;..-:..-- kPaI ,-..-- --~--l'SS h!0C/; - - ~ J r--.'10hotpO. - - --- --- 11JII~'ort- -130// - 30%- ~"n I \5rtactiOn I 1 Istr eS -+I, 40 ~ strong I II I .peripheral POrren I at rest353025i-t-l-\29% 29%-f- 47% 8Measurement programt ..55678-16 day+-- expected. levelutthe POz-tTt Iat rest,for 32 years10976-I'i- -L -,,=410 1lo'clock--- --- -expected Itrelof the mixed.POz-Fig.63 Fast rehabilitation after a 'flu infection by means of the 15 min 02MT quick procedure. Pronounced increasein venous Po (critically reduced 71 level caused by 'flu infection! Significant drop in venous P0 2; very high71 level) caused by 8 2 MT quick procedure. Lasting effect1 Bicycle ergometer (home trainer with watt display)2 It should be remembered that the P 02measurement from the arm usually gives som what unfavorable (toohigh) values. According to our experienvce.r, the value of 71' k f should b 15:-16% In this case3 Empirical value for 32 years of age
100mln-',:pulse '020onegollYedistress/NotesS/J.osllwe°MT l,processt I I Remedying the dO~fDUS crisis) by_ns II! CIIIJb ntJliDn -of the O,MT...../IIt""", '''''''''" /X pulse can on be withstood fO/D /'-..... /\ limited leng h ot time.worninglirmDl ! /negoliw Oz pulse positire 0l pulse--reaction reacllon- - --I1S,·1OSk'aampleJC mm~ exilus seems imminent Ii course of the 80 (Increased cardiac orrhylhmlQS,. -renous ft_n -It,,,s'I'1O POz-tr1 -- - - QOz-consequences atphysical moclivilyJ....... 60 --------1""'.... _ / .,........,-------------,_--______+_, ,I of ,- ~------~. -1- -I BresuIt 1119 WliUlS 50 l'= 78% 8.% 25% 20°/:::r'lng capocily p~ 40 P Oz - non ~ -- • ............. '1 --- -- ------ 1:= 6D01 the Oz-offerto the orgonism(rest;~Or__------- ~ . .__20""'---------Q z - status---------------+4normal for life .threateningly poor normal, has so far lasted 16 monlhs, prolongation of lifeage 91years (dizziness, difficult breathing, lotol disablement) and of high - qualify life IS to bt expected7'k, ' 18'1.0= 78% 8,1,5- 72% 25·1.0·25% (March 1982)..---Jtoigo 64 The 02 deficiency pulse reaction is a warning signal of a life-threatening crisis, and the lasting remedyingthe crisis by means of intensive variants of the 02MT (36 h procedure + HOT*, GK 4-1111. Paradigm of a-year-old patient (May 1982) with negative and positive energetic control of the blood microcirculation (A) and°th the correlating temporal courses of pulse (B), of both resting Po levels (C) and of the O2 offer to the organm(0). kf = factor considering pulse increase 2.1.9.5 The age-dependency of the oxygen transport Q0 2to the body tissue, and the increase inthis transport by means of O 2 MT and exercise trainingOne characteristic of the older person is thedrop in physical and mental powers with increasingage. Physically, the deterioration in theenergetic status in the human organism liesbehind this phenomenon. Since under normalconditions the energetic status is determinedy the O 2 status, the curves of this status inig. 66 in their age dependency are of vitalignificance for everyone.The dependence on age of the O 2 uptake andof the O 2 transport Q02 to the body tissue,determined under resting conditions each, waslOve tigated in [37]. The result for normal uneatedper ons is shown in the lower curveolid line) in Fig. 66. It can be seen that the2 tr n port, at rest, drops at an average age ofoy ar to approximately 62% of the maximumapproximately 30 years. Figure S8 hasdy hown that the 77-value improves with~:re~lsing age. The increase in 77 (mean involunt er ) i' entered numerically inFig. 67 A. The real reason why the oxygen orenergy status usually deteriorates critically withincreasing age, despite the increase in 77, is thereduction in cardiac output. According to Fig.67 B [109, 110], the cardiac output in normalpersons of 80 years, who are inactive in accordancewith their age, is reduced to roughl 60 %of its maximum in youth. The difference incardiac output between portingly acti e andinactive individual i remarkable here. The agedependentchange in the product, fl x ardiaoutput, which is largely de i ive for the O2flow, is shown in Fig. 67 C.Guidelines for the improvem nt whi h an bachieved with 02MT can ben fr m thupper curve in Fig. 66 and fr m Fig. 68. It nbe . een from Fig. 68 that in mpari n tthe fl-valu without tr atm nt th r 'urr din almost all ag gr up an appr im t d uling of th fl-valu, and that th rim im 1incr as in th ag rang fr mOt 0
IIstress qirI/iII mn wryhJI1IJSISLosltiJfl. dl'krlOrlltion oftill' oKxx/mi:trJCIrt:llltrtiJn ('(JUWIJy sNl'ltigofW,ss61tf11(tds as 0 ~~of'b-Ii!io;nc.!fhrr;.y tilic/enCj')------------,it pulmonal areadecrease oftheredIJodr to sII1lJ~tontlilionin ~xfrofJlJlmonolDrMitrno.se oftill'I RetllJdtiJnin pl/lmonal areailrrea~ of fileIEnlargementfl!ttlbodf 10 stobietont/dionin exfraplJlmonolarea10~rli1gof tileLosIi!7!J imprOYfmenl of fhe IJIootImicrocirculafion Iltr(){Jo/! r1efumescenttofVfsstl NfJU CfUS as aconSffJClfna of Oz-txttss (pJltering)-----------~Oxygen Hultistep TherapyAtljlJwn! measures:exercist Iroimilg, HOTfeffed p1iongtd IIIrntrgttrlifts/JIt)Fig. 65 Schematic presentation of the main connections between the cellular capillary wall switching mechanismand the positive/negative influences such as age etc. 02 multistep therapy stamina training, distress
0,5l(hmin0,41 0 ,3~t nst) 0,20,1.~,ol,"results ofter Oz MTand cordiO'lasulQr\ ~ troining/ti.~""'- " +~ -........._._-"",,~._.~I1r.-~~._._.. I ~,""~ H"j "~((tl$~r(~--. '01 fJ~rsons )1800/0160150140130120110100 (A-25 years)90 RQ· 0,82807060504030201010 20 30 40 50 60 70 80 90 100 ytarsA -Fig. 66 Dependence of O2 uptake at rest,002 (oxygen consumption in tissue) onage A of healthy males without (-) andwith (---) permanently elevated oxygenstatus by means of 02MT. The curvesrepresent mean values obtained fromsufficiently large samplesA Dependence of the arteriovenous 02 saturation differenceon age in healthy, untreated persons (cf. Fig. 58)6O .......-~---r--"'"""'T--""T"""-0/050r----""T""--..,B Dependence of the cardiac output (COP) on age inhealthy untreated persons7 %/om- 1 1006t---+-----.:~t------¥--1\-~-+--+--~901 u'I 301 5 I--------+-----cOP4t----+--+----+--+--='I80...-202030 40 50 60708090Yfors3'--_-L..__.l....-_--J...__..L-_--l..__..l-_~20 30 40 50 60 70 80 90 yttrrJ504tNl3o 20- --,// \ ~/0/~730/ ~~40 50O!Jl'--....... -607080]j~ of OJ~/l/!.IyJloz/lJrJp in a-flowto 5/% lYo10055o2590,mrsC Dependence of the product wCOP, largely decisivefor the volume of the 02 flow to the body tissue, onage, for healthy, untreated personsig.87 The dependence of the arteriovenous saturation diffe~ence 'Tl (A), of cardiac output COP (B) and of t~eroduct 710COP largely decisive for the 02 flo~ to the body tissue, on .age, for health~ person~,.nottreated WIthMT. Mean levels from a large group of indiViduals. All values determined under resting conditions
A/JtfJtnk«P~1Mtrr'ttriIWIItJfIS~.~~an.il.wlMJ'ptrsonsIrIoted. with 01 MT60-'V-~ -100...V ............~303078 llfllir 'COP43 20"~tr~ 6cardlat output (COP), 1on 17" in ~Hny persons/rl'fl/ed with ~ !1T 5~'"" ~~~~~30 4050:r$-Q'~ ~~O.r...-?~ ~"'1."~1i.. 'I()9j (",,1;;;;-I f{./'fT)5060607070808090 years90yearsCIlt!pPntIt'nct' offkjK7XfIL't f-. (OP, hrrQt&fir>a~vp for /lie I17mmt'IT1m- I!l-Ilow 10Int'b«!Y IlSS"~ gRog",Jfy 1.I!>O'#Hj' personsIItUIm'Wlln ~IfT3I2,,·COp1-r-.........20 30 40 50oller {}z1fTwtllt!lead fro/fllilg.........."-....~with COP /rms QS1iJ.7g. ;;B ~ ~'"'100%/ IwifhlJuf {}z1fTage ---t~_60I70 80 90 yl'tJl"~heifer values thanwe" measuredinuntreatedYOUll§indiVidualsFig. 68 The dependence of the arteriovenous saturation difference 11 (A), the cardiac output COP (8) and the productl1·COP largely decisive for the 02 flow to the body tissue, on age, for healthy persons after 02MT. Mean valuefrom a sufficiently large group of individuals. All values determined under resting conditionswhere an improvement in the O 2 status isparticularly desired. If the curve according toFig. 67 B is used as a basis for the age dependenceof the cardiac output, then the curve forthe age dependence of the O 2 flow to the bodytissue in accordance with Fig. 68 C is obtained.From measurements of the CO 2 produ ti n(see Appendix) it follows that appro imatel50 % of the 02MT-borne elevated O 2 ffer arused for increa ing the O 2 metaboli m in theorganism.1.1.10 Differences in effects and indications between the 36 h O 2 MT procedure and the 15 minO 2 MT quick procedurerom the total overview of our findings 0 far dir ti n(cf. also Tables Sand 6) it can be seen that theeffect of the 36 h ° MT roC dur Ii s om .
Basic mechanisms and functions 73mewhat more in the reduction of2-\'en (influ nc on 02 utilization). Thepr edur is particularly indicated inng r) p r ons ( ubjected to severe distress)P02-ven levels:::::: 40 mmHg. Furthermorem that the increa e in P02 as a conse:n e of di tress is 0 pronou~ecned that theing el vation in this value makes more frentr~~etition of the procedure necessary.deCISion to undertake such repetitions canmuch more easily taken with the quickedure, a the time (also for the patient)d oxygen required are only roughly 5 % ofat required for the 36 h 02MT procedure.e aving of oxygen is of great practicalnificance for all areas and countries wheree 02 provision from pressure cylinders orntral facilities constitutes a bottleneck.ue to the great savings in time and oxygenith the quick procedure, the question ariseshether the 36 h procedure can be fullyplaced by it. This question must be answeredthe negative and not only due to the somehatdifferent effects discussed. The 36 h02MT procedure will be specifically indicated,n the future also, for patients with restrictedmobility (cardially or pulmonally limited perormancecapacity, diseases of the locomotorsystem such as coxarthrosis, gonarthrosis, peripheralcirculatory disorders in the lower extremities,conditions after amputation ofextremities, pronounced conditions of weak-ness, severe hypertension and other di ea ebeing incompatible with the application of thequick procedure). he 36 h procedure with itsupply of oxygen via the comfortable rna kapplicator will also be preferred in ca e ofrespiratory insufficiencies (advanced lungemphysema, bronchial a thma, lung fibro i ,chronic bronchitis, condition after pneumothorax),also in cases of limited psychic trecapacity (claustrophobia etc.).The 15 min 02MT quick procedure GK 2-1,to be repeated once or twice, if nece ary.is indicated for sufficiently able-bodied persons(elimination of acute condition of weakne inyounger and older persons, especially afteroperations, infectious disease, accident andother stressful events; further, to increase thephysical performance capacity before tre ofall types, like operations and particular physicalstrains, amelioration of jet-lag in journey fromeast to west etc.). The use of the quick procedurehas great possibilities in outpatient departments.For sufficiently able-bodied patientwithout much time, the 5 x 20 min 02MT cureprocedure GK 9-1 (see AppendiX) ha beendeveloped.In extreme situations (e.g. severe circulatorydisorders in the lower extremities po siblenecessity of amputation) it can be recommendedthat the variants of the 02MT becombined with the HOT* method a ha alreadybeen done (variant GK 4-IIl, [50. 4]).1.2 Total irreversible blood microcirculation inhibition and capillary damage.2.1 Ideas about and investigations into the mechanism of the total capillary occlusionis, for the most part, the same elementaryheological mechanism which causes the total,rreversible stoppage of the blood microcirculationand afterwards capillary damage, in cardiacnfarction, shock, inflammation and also in theodern concept of cancer multistep therapyMT). This mechanism is the continuation ofcellular capillary wall switching mechanism,pre enting the reversible phase and di 'cussedthe previous chapters, to an irreversible end.e difference 10 the triggering of the mechamcon i t mainly in the fact that the 02flclency-condit ioned endothelial swelling a.ndreduction of blood flow are accompamed. H i ..caused by a tronger or weaker tran iti n tofermentation metaboli m in the ti u urroundingthe capillaries, and b the hamp ringof the drainage of the lacti a id formed. In thiproce s pH level of ~ 6.6 an ur at thvenous end of th apillari, leading aft r alatent period to hem ta i'.Thi pH r du ti n cau: : a r arran m nt inthe architecture of the biom mbran [11_].This aU ration in th m mor n aff t thmicrocirculation . n rgL ti all' in m n 'b CallS , a- ording t ahl 7. hanboth in th blood - 11' and in th inn rof th endoth lium, hi -h imp d th
Table 7 The change in the architectu;e of bio-membranes as a pH-sensitive basic process for the multi-functional,extre":,ely pH-sensitive stop of microcirculation, plasma leakage in capillaries at low pH, red cell aggregation(see FIg. 7S)Basic process1.Change in the architectureof bio-membranes duringthe transition from thenormal pH =7.4 to thevalue pH =6.5 1Findings of physicalanalysis (Kreutz,Hoelzl-Wallach,Freiburg 14.9.1976)Elements involved inthe starting process1.1Erythrocytes1.2Leucocytes1.3Platelets1.4Surface layersEndotheliumFibrinogen1. Effects2. Additional influencesGreat reduction offlexibilityReduced flexibility,adhesion to thevenular endothelium;jamming of erythrocytesIncreased formationof microthrombiIncreased stickiness,non-enzymatic adhesionof fibrinogen toendotheliumOverall effectThe combination ofand interactions betweenthese stronglypH-dependent andblood flow-reducingeffects finally conditionthe pH-sensitive stopin microcirculation2.Additional factors for theselective triggering of theirreversible stop of bloodmicrocirculation in thecancer tissues2.1Blood picture2.2Blood flow2.3 .Endothelial swell ingNumber of leucocytesand thrombocytesnormal or (artificially)increasedWhen blood flow isreduced, influx ofleucocytes into thecapillaries is greatlyincreased
ITI\J\.il 0fLttsr.., ~)HfJIIzI-~IIJAl'tII"....3/r1lt'lutrIIItJfIIiIdIIfJrIllfJl,,--lb-~_".'lJo/itiiiI'ltrocy/f~ fiJi"!]:1 - highII11OI7IlJ1)6~JI/'4 J0,V hoemIooif·tJ%2 fIOIl's'/J -5,um -) Ap1• 391111T1HgV T -3'''( -./ I I I I2 ~7 z 4 6 8 8pH--......-Idrop Df/ i1~I1NC17JcircIJlafion-defidtnftissU£ Wilh'uI:ttIpH-1M/.remflIlfstopoflJixxifKJ"')Fig. 69 Disappearance of erythrocyteflexibility at pH ::::: 6.5. Measurements ofthe relative flow rate of a red cell suspensionas compared to plasma through poreswith 5 Ilm G. H. Schmid&hoobein et al.[114,115]1 cf. also W. Kreutz, Freiburg/Br. FRG.Colloquium M. v. Ardenne on 14.9.1976in Freiburg in the Institute of Biophysicsand Radiation Biology of the UniversitYB Copillary in /issue oreas willllollfler Iosllng ~-deldncy5 35000Iostit!J (1;-tNU«yitIJvger fissut> tJml f 129Jeffects:7. inhibiti", ofIJbotIIJ1It::rocrnJItfpH-U)I ~2. sticking iT~fowrxillDl3 I·~.W:J..IJiTkfi1f&JtsIn"" IRSIIKI~ I4.•".DI~ ,..,."••~ lySIISDmtll tnrylTllS(offllrks from outsidt )5 flTnmLiT~IWJfI~ .ITICf'OII1I tJiJJ,6. at/3t i1Jamf1t/"St7. lorgt ftx:u3 11n./~,
nsMslor rotd'1uI.-Jl!Jg1"/11(J(JrfreeIfIIfJSUrMTmfi1 tile IRtIsdetissue 011*~fReglO kmortiltswrilralis)in~ction ofalml5%Evrms'81uesoli/liJfl iliatml mili v. ilj«'lion of£WJI1J'lIIlIe8Js0,,)1 IfE0,250,200,150,100,05IItime 01 influxI--t68-11 6,36S '--1: fW=t65 ?A =5;3715I (BFm =1OO%J,.- ....I/IVfV Lo"'"I ~ , slee{ltess of illux,28,019 =22, 9600 1 2 3 4 5 6 7 8 9 10 St ..Imoxi/lllJmextinction0,211,E= 0,189,ViFig. 71 Photoelectronic measurementof the inflow of a dye into thevascular system of normal tissueafter an Lv. bolus injection. Thecurve is based on 20 measurementson normal tissues as standard [121J.Time of influx as a (relative) characteristicof the microcirculation.Vascular "color index" an indicatorof the vascularization of thetissueconnections lorp'!o!o rt'SiSIonll'HPY~Light-conducting glass rodStnm~l 20mm l'bX~=---- over-acidd~d tissflt' (fflmor)Fig. 72 Photoelectronic devicefor measuring relative bloodmicrocirculation of tissuesin situ at different pH valuesand with or without hyperthermia.Determination of sort ofcolor index (steepness of thedye influx into the tissue)after an Lv. bolus injection ofEvans' Blue (50 mg!kg as 5%solution during 0.3 s) [120, 121JL...-_Irreversible occlusion, which progresses fromthe beginning of the venule in the direction ofthe arteriole, only occurs in longer-lasting overacidificationof the tissue (Fig. 70), that is, inlonger-lasting O 2 deficiency or, in cancer tissue,in the longer-lasting state of stimulated fermentation.Due to the great medical significance of thecombat or deliberate generation of the totalirreversible stop in the microcirculation, itseemed necessary for the strengthening of thescientific basis to devise and implement in vivoexperiments which would allow us to determinethe influence of O 2 deficiency and overacidificationon the microcirculation in theti sue [2, 120 123]. Since this problem i concernedwith the influencing of the blood flowby means of pH reduction within the capillari .and venule it is in rinci Ie irrelevant whichtype of glycolysing tissue is u ed in thi sort ofexperiment to bring about the pH reduction atthe venous end of the capillaries. We thereforeused the DS carcinosarcoma of the rat a amodel tissue. Our Institute had e ten ive e _perience of the reduction of th ti ue pH inthis tumor after long-term increa e of the bloodglucose concentration [2, 123].Our principle of in vivo measurem nt of threlative drop in microcirculation at r duc dcapillary pH consi t in th re rding f thtemporal cour e of the .. olor ind ' in thblood ves I y tern within 0-60 fter an i. .vital dy inj ction of appro imat 1 O. durtionvan Blu ) a in Fig. 71: th n th 1 p fthe curve obtain d at r du d pH i mp r dwith that und r normal ti u pH. Th n tru _tion of th opti al wa - uid rr n m ntd v 10 d for thi. i r
hyperJyceniJfltlntr tHiltiaJliKI) rimefII••5·10-3,-1 MOtXI¢x;rJsf)hyperthernia(foai tllTKT heatilg) rime(ofter If1J"., '26 f _ tenperultre)hyperJyceniJ +hyper/Mrni1: OfT'llglg-7 EWIR's Blu,1..:-11·Q3oofI)~10 sf----.---Ar·Tiv.-I'!J:110973BQ3t------....--_fr.-InjOJr2 r2Na1 0,1EE0 00 10 s 0f •0,3 ........----~-.....,J..-------+--=== IlTIIli tissue(N)f--......--10 sc0,060,100, 007 =tgATINFig. 73 Selective staunching of the blood microcirculation in cancer tissue after hyperglycemia alone (AI, hyperthermiaalone (B)l and hyperglycemia and hyperthermia: CMT (Cl. Photoelectronic simultaneous recording of theintravasal influx after 0.3 s Lv. bolus injection of Evans' Blue in normal tissue (Nl and in tumor tissue (Tl. Wistarrats with a body mass of 200-250 g and a tumor mass of roughly 7 g1 This measu rement reveals that the hyperthermia step also causes a selective microci rculation inhibition, as themicrocirculation in normal tissue remains at virtually the same level2 Same picture after 24 hthis quick measurement method the course ofthe optical density in normal tissue (muscle,one leg) and in tissue with definitely reducedcapillary pH (DS carcinosarcoma in hyperglycemia,contralateral limb) is recorded simultaneouslyin one and the same animal using twoarrangements of the type shown. Figure 73shows the results of such twin recordings. Bycomparison of the slopes of the dye influx instrongly over-acidified tissue tgAT and in normaltissue tgAN one obtains tgAT/tgAN =tgAT/N = TMI (tumor micro~ircul.ation ~nde~)as a characteristic of the mlcroclfculatlon Inoveracidified tissue relative to the normal tissueof the same animal. In our example (Fig. 73 A),the pH topography of curve T roughly cor!espondsto the conditions in a severe myocardlacinfarction' the microcirculation in the overacidifiedt'issue sinks to tgAT/N ~ 6· 10- 2 (triggeringof extreme O 2 ddiciency).It can be seen from the further example (Fig.73 B) that a reduction in the blood microcirculationto similar levels (tgAT/N ~ 10- 1 ) w~sob erved in cancer ti 'sue in local hyp rthermlaalone, i. e. without hyperglycemia. Only ourcombination of hyperglycemia + local hyperthermialeads, as can be een from Fig. 73 C[121], to the selective, almo t total, mi rocirculationinhibition in cancer ti ue.Further measurements prove that the almo ttotal stoppage of the microcirculation tillexists after 24 h. After these model experiments,which could also be reprodu ed withother types of tumor, and after analogou e periments with further adjuvant tep [124], itcould be estimated that, under the conditionof the 1977 concept of cancer multi teptherapy [125], the de cribed comple me hanismwith a virtually total toppage f thmicrocirculation i ele tivel triggered in thecancer tis ue. The achievement of thi irrversiblestop in blood flo i hi t 1 gi allconfirmed by Fig. 74. Th ob rvati nrelevant for thi animal and thi tum r m d 1have gained fundam ntal ignifi an f r urCMT con pt. a r ult f lini al p ri nhowever, modifi ation ur, d p ndin ntherapy manag m nt, tum r hi t I g ul rarchit tur and ho t tL u .
IonsFig. 74 Histological pictures showing the successful selective segregation of a cancer tissue (OS carcinosarcoma of radfrom the circulation through uniform triggering of irreversible hemostasis with the aid of extreme overacidification+ 42.5 °c local hyperthermia and further measures of the cancer multistep therapy concept. The blood vessels areexpanded and obstructed (B) (trichrome staining according to Goldner, green filter)1.2.2 Cancer multistep therapy (CMT) and oxygen multistep therapy (02MT),The central therapeutic mechanism in the CMTis the selective irreversible closure ofthe vesselsof the tumor growing in the body [22,23, 129).This new method, used by us clinically withsuccess for the first time in 1979, is fascinatingfor many reasons because:1. due to the vascular obstruction, a segregationof the cancer tissue from the circulationof the organism occurs; thus the toxic strainon the circulation due to the sudden inundationby tumor degradation products iseliminated and at the same time the dangerof internal bleeding is reduced.2. the direct therapy target is not only formedby the cancer cells with their enormousvariation in cell kinetic parameters, but additionallyand mainly by the blood andvessel wall cells with their greater uniformity.3. there exists justified hope that a universaltherapy principle will be achieved, with individualarrangements in terms of tumorhistology, vessel architecture, host tissue,stage and localization of the tumor, as allsolid tumors are nourished via the bloodve els and must perish when these vesselsare ob tructed.It i understandable that our ideas about thechani m of capillary/post-capillary va cularCMT research. Figure 7S gives a summary ofthe new ideas developed in close co-operationwith P.G. Reitnauer. We know today that boththe formation of pores and the aggregation ofred cells are favored by pH reduction. Comparedwith the course of the same mechanismin myocardiac infarction or inflammation [30]for example, the difference in CMT lies in thefact that the adjuvant step of local hyperthermiaof 42-43 °c is necessary for the triggeringof hemostasis, and to enable the contributionof endothelial swelling and red cell aggregationto become fully effective. This is obviousl aspecific characteristic of the cancer tissue capillaries(known to be previously dilated).In our research to optimize the selective as ular occlusion, many series of experiments recarried out, partly also on the basis of SURgestions kindly given to us by numerou colleaguesNone of these efforts met with radical uOne idea presented it elf at the beginn'1982 from the 02MT re arch ith hcovery of the bioenergetically c ntr 11 d ceUllllarwall switching me hani m and fr m .micro copic inv tigation: th 1concrete mea ure to increa th procclu ion th id of interruptition for a time at the start of thregional hyperth rmia pluu
_-----~-------..,..... ....-.....-n-QrlO;Jl;;ill,._~rlUl~rOTTIT'lTTTonJOTra:nrr"CaDTfJaTV1:ranrTalJe--Icapillaryyenule"/b ~rc and. 'I' I'" " ttll (.AIl ,JWI ". ,welting 0 tile endothelial ,rcriUCeu.0l-deflClencydiametrrextravasation of fluid. I{"reasing with time (pore formation)pH" 7. Ithyperthermiadeformationzone_ erythrocyte ~ stiffening zonesluggish flowerythrocyte aggregationpH-reduction increased tendency to words aggregationpHS 6.7increase in apparent blood viscosity.i,,:reased hemostasisleucocyte----- irerersiie helflJStosisFig. 75 Schematically presented ideas about the triggering of the mechanism of blood microcirculation inhibitionin longer-lasting strong tissue owracidification (and hyperthermia). Examples: myocardiac infarct, inflammation,gangrene. Manipulated selectiw hemostasis in cancer multistep therapy (CMT) with two~tep regional hyperthermia(selectotherm process)the endothelial swelling discussed in detail [127,128, 134]; there also resulted the instructiontemporarily to increase the blood glucose concentrationas much as possible (to eight times itsnormal level) in order to optimize the selectivepH reduction in the cancer tissue. Along thesame lines lay the measure of the temporaryblood flow strapping [124], inasmuch as accessto the arterial arm of the tumor concerned waspossible. Other measures have recently beenadded in order to stimulate the selective extravasationof fluids, and the red cell aggregationin the vascular network of the tumor, correspondingto the ideas in Fig. 7S [130].The measurement of red cell aggregation was pioneeredby H. Schmid-Schonbein [131], Chmiel[132] an,d Reitnauer (influence of pH) [133].The other condition for the selective triggeringof the vascular obstruction in the cancer tissueis that, for 100-200 min, a local temperatureof around 42.5 °c is attained in the tumor, buteven better than this, in the region of the bodywhere cancer tissue is suspected (combat ofmetastases). In order to fulfil this condition inthe human organism, the CMT Selectothe.rmprocedure was devised, in which for the fusttime a very homogeneous energy supply to aI rge volume of tissue is achieved b~ means ofcanning movement of the apph~at~r, fedy a hort-wave transmitter.. The prmclple of. procedure stems from Fig. 76 [135-139].. . i Ie 0 two-step hyperthermia, already suggested in 1965[2]. According to this principle, the first stepattains a whole body temperature of, e.g.41 °c, and the second step adds to this furthertemperature increase of 1.5-2.0°c for the partof the body where cancer is suspected, bymeans of regional hyperthermia.Thanks to this two-step principle, the necessarytemperature span of the regional hyperthermiaand of the temperature gradient is greatlyreduced in a vertical direction to the body surface,and hence the danger of thermal damageto normal tissue near the skin is considerablyreduced.In order to save the expensive high-frequencyenergy which had until now been used to increasethe body temperature to, e.g. 41 °c aSelectotherm variant was created with whi hthe whole-body heating of the patient oc ursby infrared A radiation in accordan e withFig. 77 (also suitable for variable bod etions).Figure 78 show a schematic pr entati n f thCMT Selectotherm equipment of the 3rd g neration. This equipment make p iblcontrol of the appli ator 'orbit ith throbot sy tern (Fig. 79) th adju tm nt f thdesired canning and th r b th adaptation ofthe regional energy suppl to th indi idualtreatmen tease.By m an of thd v 10 m nt of n
IonseM' Selecfofherm equipment-_s1SttmmomntntlnXY-dlftctionx for tntrll "tId !Iomogtnizalion in ~ l~Lxyz direr/Ionsmo~olJle d"p-pipetorSkm? ·wetted. compresscoolillg (bolaMe bt/wten ~«
1water and electricpower supply -venit/alorwater jet-HF probecollision sensormondoriflg assembly/I·keyboardA•paneldisplayTherapy roomceiling stand.Hf cableapplicatorpower supply...."""!r- 1(second keyboardJ /-:)---1\ ,(" ) I I r---Ir-_;''t~adopter unIt ~ ;'~~~~~~~~=t __thermost(Jted . I' ~?~F water mattress--i...Jwheeled stretcher/Control roommatchingbunit electric powerHFgeneralor supply1]water suppl~thermostaf (s~Supply room,Fig. 78 Schematic presentation of the CMT selectotherm III equipment for homogenized energy deposition intothe body's center (e.g. TN = 41.5 °Cl and into regions suspected of cancer (Tc = 42.5°CI. Two-step hyperthermiawith 02 inhalationwe are working to increase the prohability ofsuch results, in particular by means of favorablecontrol of the selective hemostasis and the cellularcapillary wall switching mechanism (cf.fig. 75, intensification of vascular leakage andof red cell aggregation in the tumor region).If the explanations in this paragraph seem tooexten ive, It should he remembered that thea ily controllable and homogene~us r~gional
.....-------................',..,-n::JTCrg T"'~rnrrn1'll~atlonSFig. 79 CMT selectotherm applicator system (3rd and 4th generation). The rf heating coil mows on orbits adaptableto each individual case over selected body sectionsBody contour~i":OIKfUdiYlIy)'r- ......Ring coil applica/or6connlilg) ~~=:--..ChlicalincretlJt'tT~ SOIJr« densllyFig. 80 Presentation of the owr-h8ating ofborderline tissue as a result of the body~:on1:oureffect. Possible momentary picture duringscanning
83flO0/09080'101 :E 40302010, ~\! ."SIxxJy contour ellect/ ~~"~,, -#'SUftning anlerOfJplirofor 1985(target rtgiJn),-..-- ,~,~7';--~~I I '"" ~, [,'Il;o'" 'r-.. ....."OfJIiicakr 19;9'-- _... ..., ooolti:alor 1985 -' ~~'IJZ-tCtn /X ~ ~ ~z·5cm V V~ -~......... V ~........~/--"'~IJz-5cm--.... ~~./'~-.1020x----t--3040emFig.81Measurement of the relative energy deposition at various depths in an agar phantom with a ring coil appli·cator 1979 (R '= 8.25 cm, distance zoz 1 = 11 cm, rectangu Iar scanning with x = ± 16 cm and y = ± 10 cmI and withthe new ;3pplicator 1985 (distance zozl = 11 cm, circular scanning with R o =10cml. Advance: Increase in energydeposition at a depth of 5 cm from approximately 25 to 50%Tumor rich inblood vesselsjva/v shunts jdemonstration of .the vena femoralls•fumor lIesselsno longerdemonstrable;/ffumpr destroyed.normal tissueunaffected. )AB
eM/rot gro"/!.Histologicallyconfirmed.lymph nodemetastases28%30%72%l'/ortalil,y rateIfetoslasis rolesurvival rote (> 5yrs.)8%16%97%Fig.83 Reduction in rate of metastasis in histologically proven cervical carcinomas (mainly stage lib) by meansof 02 multistep immunostimulation 02MT (BCG and 32 h 02MT) + CMT (concept 1974) 1 from 30 to 60%02MT + CMT as adjuvant therapy to the conventional oncotherapy (OP according to Wertheim-Meigs, radiationtherapy). Treatments between 1974 and 1978 at the Gynecological Clinic of the Medical Academy, Dresden(Director: Prof. Dr. B. Sarembe), M.D. thesi~ by C. Kaiser, 19851 Since 1974 the efficacy of the concept has been significantly improved through methodological and technicaldevelopment (thymus preparations, e.g. Neythymun instead of BeG, Selectotherm equipment of the 3rdgeneration)cardial infarction leads to the destruction oftissue highly important to life, and which alsooccurs during irreversible shock.Since we realized in 1970 that conditions ofcollapse do not occur after several hours of40-41 °c whole body hyperthermia if 02 isapplied during the hyperthermic phase [2], thesteps of the 02MT and, from 1974 [143], thesteps of the 02MT immunostimulation havebeen included in the CMT program. The efficacyof this measure was increased in 1977[125] by replacing BCG as an immunomodulatorwith thymus extracts, CEH or Neythymun.The addition of the 02MT immunostimulationin the CMT program was successful, on the onehand in that it enabled us to aim for as high a, 0body core temperature as possible (e. g. 41.5 C)for, e.g. 3 h, well tolerated by the patient and,on the other hand, in the immunological destructionof the cancer cells which have survivedthe therapy. That is, we are striving for areduction of the probability of metastasis andrecurrences. Our ideas on the reduction of therate of metastasis and the increase in the urrate by means of the adjuvant procedure of02MT immunostimulation have been clini allconfirmed, as Fig. 83 show . The tud arriedout between 1974 and 1978 on patient ithhistologically proven cervical carcinoma (m t1stage JIb) showed a reduction in th rat fmeta tasis from 30 to 16 % and a dr p in thmortality rate from 28 to 8 %. Thi r ultwhich wa obtain d 5-6 ar aft r tr atm ntcarrie great wight for th ran th t th1974 concept of th 02MT immun timul ti nand CMT ha b n greatly improv d in th nby methodologi al and t hni al d 1 pm nt .
p h rapyn inhibition of theocc:urs d to th m chani mcall~illa:ryl pill ry blood v el occlu-Gislcussed (f. ig. 75), the drainage ofid f rm d by f rm ntation i also'hi:ndlere:d i d n acido i ). This accumulation. i a id triggers a further feedback promthe MT procedure, in myocardial ininand aloin the late phase of shock. home temporal delay: the deceleration orpping of the drainage of lactic acid leads to aadual reduction in the pH at the venous andthe capillary from at first approximately6.6 to 6.7 down to 6.0. Linked with this is anincrease in the vascular leakage and red cell aggregation,and also a further loss in blood cellfl xibility, Le. an intensification of the occluion.The time required for this pH reductionwas determined at 150-200 min by in vivo pHrecordings for CMT conditions. The time-spanuntil steady-state overacidification is reachedseems to be considerably shorter under infarctionconditions (high-rate formation of acidicmetabolites by the permanently working heartmuscle).This double feedback process explains the sud- .denness with which the infarction overcomesthe victim. At the same time it can also beunderstood, however, that the infarction can beeliminated with the same suddenness in theinitial phase of the acute ischemia, by a measurewhich increases the tissue pH. The portrayeddouble feedback process in the triggeringor interruption of the infarction is a theoreticallysignificant characteristic of the myocardialinfarction which has hardly been discussedin cardiology as yet, perhaps because,although its pathogenetic rank in medicine wasprobable from observation, it is and can be seenin its functional context much more clearly byphy iology and physics.fter the reduction of the pH in the myocardiactissue concerned, there follows in thecourse of some 10 min the cellular release ofy 0 omal enzymes, which are activated with afetor of virtually lOat pH values of around 6,nd instigate the destruction of the relevant11 [141]. As soon as the outer cell membranebeen destroyed after about 100 min, theomal enzyme which then enter the extralIularpace contribute to the damage ofi boring cell, and the lysosomal cytolytich in reaction of the myocardiac infarction4] di cu. d below, proce ds after a furth rd lay of one to everal hours, which inmally I ad to th homogen ou larg -ar an cro i In the affected regIon f the heartmu cleoThe answer to the question of how long thecourse of the infarction mechanism remainsreversible in the given temporal course i ofcrucial practical significance for the de ign ofa causal therapy for the initial pha e of theacute myocardiac infarction. It is only po siblein the reversible initial phase to bring the acuteinfarction to a halt by therapeutic measure .Measures which are not applied until later, inthe irreversible phase, particularly in the clinic,can only spatially limit the self-maintainingmechanism, ameliorate it, and support theorganism so that it can better survive, or surviveat all, the time-span with reduced cardiac performance.In animal experiments we ascertainedthe amount of time up to the beginningof the irreversible tissue damage in the rat, bymeans of pH measurements in the rat heart,described below, under the conditions of amyocardiac infarction triggered by a coronaryligature. We found that the transition from thereversible to the irreversible phases occurs approximately20 min after the infarction is triggered.If we use as a basis our estimation thatpharmacologically therapeutic measures, withthe aim of interrupting the infarction in itreversible phase, must be taken within 20 minthen it necessarily follows that only the patienthimself can undertake this primarily helpfulmeasure, as medical treatment is only in veryrare cases available within 20 min of the infarction.It follows from this that only a therapywhich has been prepared by the cardiologi t inattendance (especially for high-risk patient)and which can be carried out by the patienthimself, can restrict the triggering and pread ofthe infarction mechanism in an acute case. Thisconclusion practically force u to restrict thesetherapeutic measures to drugs with a fast andreliable effect when given orally or perlingually.
A1er tnit,almonipulotionsand III«l$Ullmenf3(pH 7.+)~ /l-colilJrafionofthe pH-el«lrodt~a~pH-electrodeSit';2,M9/k9replaced in 9-strophanthinprerlous i. Yo! the heartlostinu/pH -In . crease~••,•s11pH-;fI(frOIt.d1l1fr!.P:!. ~I11- pH-tWlutfifJn~ It~pH.o.1 "j Ap"'-0.5t ~If -i.~ tp-talibra/,DR '1t-"t pH6.08I16.0 10I2Dt __.. 30terminallon7P1.•+omi"Fig. 84 The long"effect of g.troph8tricle of the my0C8lrc:lliumpH changes duringexperimental cerdiac n 8 •ad by a controllable (~cI.mpling.liftii"'".ligature of a coronarying rat heart, and 8'h8r i.v. j'nlje'de..g-ttrophanthin. Part of r'chart recording. pH re,..._a glass combination miiCf'Cll8leetrlDdl1 Not shown herefor g-strophanthin, which have not been observedwith digitoxin. Thus we found in accordancewith Fig. 84 that the pH in the focus,which had fallen during an experimental infarction,rose again within 4 min of a dose ofg-strophanthin [146]. The view, which can befound in old textbooks of cardiology, thatg-strophanthin stimulates the degradation offormed lactic acid as an energy source of theheart muscle, can help us to interpret this. Ifg-strophanthin moderates in the initial phasethe over-acidification which occurs in thefocus, then the reversible formation of "pores"in the vessels and the stiffening of red cells andleucocytes must also be reduced, and thestaunching of the microcirculation which hasoccurred must be more or less lifted. We havetested this conclusion with experiments. Theconfirmation of its correctness can be seenfrom the measurements summarized in Fig. 8S.Photoelectronic measurements of the colorindex of the tissue with a micro-optical waveguide [121] did indeed show that the value inthe focus greatly rises immediately after a doseof g-strophanthin (Fig. 8S A), that thereforethe microcirculation is increased again [122],which leads to a favoring of lactate drainageand hence to a rise in pH. The mean oxygenpartial pressure in the tissue was also simultaneouslyrecorded in these experiments (Fig. 8S B).From this record it can be seen that, roughly atthe same time as the increase in microcirculationcaused by g-strophanthin, the mean Po" inthe focus also increases considerably. It has thusbeen proven in animal experiments that g-6trophanthin,applied early enough, can weaken thecritical feedback process discussed, and restricte infarction mechanism.of angina pectori , too, g- trophan, over and above the effect of the in-crease in pH, an increase in the micr~and thereby also in the 0" supply in theconcerned. The result is, as a rule (in appromately 85 % of cases [147]), an arrest °angina pectoris attacks within 6-10 min °ad hoc application.A renaissance in the use of g-strophan .be expected following these findings if erefute a claim which, despite experimecounter-findings, is unfortunately broughward again and again: the incorrect clainJg-strophanthin cannot even be given pegually with certainty of effect1.It follows from our investigation [150], .cordance with Fig. 86, that the strengthaction of the oral/perlingual dose is largependent on the concentration of the sollutiGaapplied. This means that the strength of adepends significantly on the accidental dU'Iltic:.of the glycoside with saliva, i.e. that co,nsildel....able variations in the effect can be ex,pec:todwith this type of application. These varia·can be avoided, however, and a high effethe heart achieved, equivalent to the i. .dard dose, if the dose (according to [15applied perlingually in high concentrationfrom a Strodival special preparation 66 % in oleophilic phase). The admini tratiIa
'I'tIIIeI1Irililt dyt iflRIJW l ill fh'tirtullliion a"a ,fanof"wtd tDfOflll'1 "SStl%405060708090f)()o123......II I I I I8 95 6 7t~-.......-ill humons (R. £ TJohrmolln ttIll. 1.QSO1 IfocItyofirfl'tlSftiQ'OlIIJCnX:irt'ulotm-0,35 t.D!!i!g-~nIIin0)0 0/0t+5(expl; /D. 10)wttJlltr constrictiDn0.25-- -~- [9 teipl; I1fJ. 15) fl)/ fI1IJX Fi1116ninIj.(J teipt. IX}. flf).-~0.20 ~~ - I~~ mortsMI't CDn5triet;~0,15 f ---~---tmax ~30min 40Q10 1/IThe lime ~ passed for maximal tissue stoining-0,0520Jcoffe/otes reciprotolly w/lh the strength ofmicrocirculation.B Ifeosurement 01the meon POz in tiltcirculafiofl area ofanarrowed coronary ,esse/I1011fi)12111n20Yesselconstrirted"''"'\I 12 (t.. 15)o 1 2 3-456Iv. fl/!/JlicatiJn phose ofheart -eHtrtive slrofimlll,g- SlfTJjJl1Qfl/hin /llvosiJn in lite IJItKJd CIrculation~ ~.II.d'~ perlrrDliJdJ.sefiIcliirorWrtp(--in 17It'f1/1 p~ through§.-sfrol!..l1Jntl1in.... 185(exp!.I1J.15)-~\/raf~ b.w.- ~ (t¥/.. fO)./ ~J ---- ----t--.....-7-J89-- lMftxJi.IlJ.f))10115/cPo432112 minFig.85 Direct proof of restoration of microcirculation (A) and in the mean PO" (B) in the circulation area of acoronary vessel constricted to simulate cardiac infarction, immediately after application of g-strophanthin. Vitalcolorimetric measurement (A) using light-conducting micro-probe. Needle of light probe ground flat and attachedon the tissue area of interest. ~ = transparency, E = extinctionExperimental control2 Dosage adapted to species rat
Q'CSlNltftning1A. QfQ/-fJlf1inguQ/ QpplimfiDn of Img g-stmphonthinBy for lhe gfeat"port of Ihe dose is immediDlely boundfor sMrol hours to receplors of longue /mouIh ti$Sueetc. and thenloff heor/-ineffective-,t----_•/.Heon volue wl/hStrodiYQ/ sp«ial6mg-6% oleoph.,onlena ofcapsuledistributed ondried-off tongue '-'0r--------+------+-----J,..---:::ol~__L._.....Ioral dose____.P..trlin9.uol dose--+-~-8 soluh'on qUicklysolution dislribufe.d. over-1 drunk - lhe sublmgual Qreasof the orol mucosa.-6 Remains ofsaliva-St-+-__-=-p_re_Yl..:....iJu_lLly,:.s.....:wa=:.tIlc.::..0w,.:...::'t=d.:...-.--=::::::.....~:.....-------l-.....j-"t-t-------~'------.~••-3 H-------l-l---2fII.~----l----------+---1-2H------~~------_+__-------J~2 J "5618 12 3" 5 6 7 8 10 0/0Fig.86 Measurements showing the relative QT c shortening in the ECG by oral-perlingual administration of 6g-strophanthin from solutions with increasing concentration Cs (A) and by Lv. injection of 0.25 mg owr 1 min (8Result: The effect of the Lv. standard dose is only equivalent to the safely applicable 6 mg perlingual dose (> 6"in oleophilic phase) with due consideration of the mode of application described1 First swallow remaining saliva. After distribution, rapid shallow respiration for 3 min. Onset of heart effect (alsoQT c shortening) approx. 6 min after administration. With this mode of application, no side-effects in the intestinaltractto be practised in the following way: iirst,swallow remains of saliva, then dry the frontsurface of the tongue with a cloth and distributethe contents of a capsule over the driedtongue surface; afterwards rapid shallow respirationfor 3 min. If the described form ofapplication, which the patient, prepared by hiscardiologist and equipped with an emergencypackage as in Fig. 87, can implement himselfin an acute situation, is adhered to, a high andreliable strophanthin effect occurs. Grabka[151 J reports on the significant drop in themortality rate of infarction after the introductionof immediate therapy with g-strophanthin(Strodival) given perlingually, in undergroundmining.Unfortunately, the pharmacokinetics of thisdrug given i. v. and perlingually are very unusualand complicated [148J. This behavior is a consequenceof the fact that this glycoside isbound within fractions of a second by thereceptors of the outer cell membranes (also ofthe tongue tissue in particular), and is not disociotedfrom the receptors until 2-4 h later,and then only with slight modification of itsmolecule, with the loss ofits characteristics as aheart glycoside (I). Furthermore, we found thatthe active form of the g-strophanthin, with atime constant which is considerably smallerthen the circulation or mixing time of thblood, is eliminated from the blood circulatio .It is therefore difficult to attempt to combthe existing prejudice of broad circle againthe perlingual application of this glycosidemeans of theoretical clarification of its pharmacokinetics.The pragmatic method eemto be more convincing here.The therapeutic chance is much smaller if thcounter-measures, as is normally the ca e todaare not undertaken by the clinic doctor un .15-20 min after the on et of the infar tii. e. not until the infarction mechani m hasumed an irreversible character. It ould befrom mea urements of the mi ro ir ulatiwith the dye-injection m thod that n fthe progression of the m hani m d rib d ntran ition to th irr ve ibl ph proportiof microcirculation of some per nt illr m in until th n t f th I m IIyti h in r i n. Thu th i t
Fig.87 Emergency pack for immediate perlingual self-application of g-strophanthin for risk patients. The processof a cardiac infarction only remains reversible for up to approximately 20 min after its onset. Therefore it is usuallyonly the patient himself who can make use of the often life-saving effects of strophanthin: increase in the pH in theinfarcted tissue, reduction of plasma evasation ~nd red cell aggregation. By this, the hampered blood microcirculationand O2 supply are restored. Safe and reliable action by definite dosage of 6 mg g-strophanthin as 6% oleophilicsolution per capsule, administered by distributing over the previously dried tongue. Onset of effect:::::: 6 min afterapplicationTable 8 The various treatment phases in combatting a myocardiac infarct.EmerQ!!ncysituationAdmission to clinical treatmentPhase Prophylaxis Reversible Irreversible phase Rehabilitation phasephase phase before the after thestill a high cytolytic chain cytolytic chainlevel of thera- reaction occurs reaction haspeutic respon-occurredsivenessDuration 2 days~120 min ~2 daysMicrocirculation almost normal still amost sinking to as sunk to as lownormal low as 1% as 1%Measures 02 multistep perlingual Administration Standard 36 h 02 multistepregeneration self-application of the Iyso- measures procedureprocedure of 6 mg = 6% somal stabilizerStradival } ad g-strophanthin methylprednispecialhoc sol one, combi-Nitranginnation process02MT + HOT*standardmeasuresEffect Alleviation of often a total Extension of Combatting of Increased physicalangina pectoris stop of the in- the lysosomal the further pro- performanceand arrhyth- farct after cytolytic gression of the Reduced patientmias 6 to 10 min chain reaction large-area infarct riskIncrease in prevented necrosisoutputton t ofmyocardiac infarct
otllm'lv.2 h th ju tifi d pro p ct of favorablytnflue.ncin th furth r cou of th infarction. Ult bl m u . In 1971 w ugge ted forth. [144] th t th dose of g-strophanthin beupplemented by a lysosome stabilizer (e.g.m ~h lpredni olone) in order to hamper cytolysISand cytolytic chain reaction. By means ofthe treatment of 270 infarct patients with theuggested combination, Dohrmann achieved adrop in the mortality rate from 38 to 16 %[152 153] in his unselected patient sample inthe .Evangelisches Waldkrankenhaus Spandau,~e~lm (West). After these particular reports,It IS enough for the further therapeutic actionin this critical time-span of such practical importanc~)to refer to the comprehensive) morerecent hterature on clinical infarction therapy[154]. The experiences gathered in the last fewyears entitle us to estimate that the wide use ofthe discussed results of Dohrmann)s and ourgroups could lead to a drastic drop in infarctlethality. The way to this is to abandon [155]the old-fashioned pharmacological ideas on thelacking efficacy of the perlingually administeredg-strophanthin.Strophanthin is also of significance for othermedical disciplines) in addition to its use inmyocardiac infarction) particularly in situationswhere there is la~tacidosis) e. g. in sports medicine.According to as yet unpublished selfexperimentsby my co-worker W. Klemm)sporting performance capacity is increased inthe anaerobic boundary region (with lactateaccumulation). The same performance could beachieved on a bicycle ergometer at a lowerheart frequency after perlingual administrationof one Strodival capsule.From the above consideration we can recognizeseveral treatment phases of the acute myocardiacinfarction with differences regardingsuitable measures, effects and the chances ofsuccess. Table 8 gives an overview of these.The consequences of the O2 deficiency in alarge volume of muscle tissue have been particularlythoroughly investigated in myocardial infarction.Thus Fig. 88 can give an idea of thejoint destruction of finer blood vessels in alarge-focal necrosis in the final stage of the infarction[156]. A comparison of this figure withthe X-ray arteriography) Fig. 82, is very informativeand shows that a mechanism veryclose to nature is triggered in the cancer tissuewith the modern CMT concept.O 2inhalation is one of the tandard measuresin the therapy of acute infarct. An improvementin the O 2 tatu, a fast and a trong apo ible) i thereby trived for. Our P02 m a -urement lead to berevperhap be achieved if,lowing paragraph, a 0plemented simultaneoUllytion and a further raising 0blood fluidity were therebyunder unfavorable circulatory co:DdjitU1_It also seemed necessary to go .discussion of the complex p1roc_gering, course and therapy ofcardiac infarction, because ewith one of the main causes 0time and because a great change . OCClltWpresent in ideas about the mec:halUsm iI...,and the suitable counter-measureWith the meaningful use of vanan02MT it should be possible greathe probability of suffering a myoalldiiac-'"farction. A prophylaxis of a myocarditd infllTetionwhich attacks the primary ca e·when it is possible decisively to re ceprobability of O2 deficiency in emuscle) lasting for some minutes, which t~·Pil'Sthe infarction [Ill, 157]. One of the mfective means of avoiding such O2 deficieconditions is the use of 02MT and (or) exer .training in order to raise the O2 status wblicbhas been critically worsened in increasing age ordue to distress.In the rehabilitation phase following myocardialinfarction it seems possible to reduce considerablythe risk ofreinfarctions and to shorten theperiod of recuperation) e.g. by application ofthe 36 h 02MT procedure) GK 4-1. The patient'sstress capacity increases considerableven during this procedure) in correlation torise in the P02_art measured without additioO2 application) or in the l1-value. This fast . crease in the strain capacity is of specific sign· cance for rehabilitation after a myocardia infarction'until now treatment here has hadtread a tightrope between triggering a recurreninfarction due to too much strain and an unnecessarilyslow return to a suitable wa of li~in the case in question due to too little train.This tightrope is broadened and the ri k to thpatient thereby ignificantly reduced b meanof the discovered initial mobilization f thinfarct patient, which) in the e ample in Fi .89) occurs after the first e ion of the h02MT procedure. Thu th m bilization ffof the 02MT ignifie a d i iv aid t ha iIitationafter myo ardial infar tion hi hhould b tak n up with a littl dip ibl by all m di inal bran h n rn d iththi probl m. In rd r that thi d m ndmor a il und t d and pt dr port h r th rv ti n m d in
main coronary resselsr/'!1tf!1rideleftYiiitriclestate ofterlorge-areanecrosIs withobstructed,partlVlysed capJllariesand. arterioleslarger and medium vesselbranches l'Iitl1 free fll!Ssage(no (ysis throughdiolfl relJet/on).Fig. 88 Large-area necrosis and dama ge to blood capillaries. Postmortem coronarography of a myocardiac infarctin the peak area of the left ventricle, according to Baroldi. In the volume of the large-area necrosis the capillariesand finer arterioles are occluded, and partially lysed. The functional elimination of the finest vessels is the finalconsequence of a longer-lasting deficit in 02 utilization in a greater volume of tissuecharacteristic case. A middle-aged patientcomes to us in Dresden soon after a myocardiacinfarction, in order to undergo 02MT. On theday of his arrival his P0 2 - art is low, and he canonly climb to the second floor of his 13-storeyhotel, as severe anginal complaints prevent himfrom climbing further. After just three sessions,each of 4 h, this movement disability disappears,and the patient climbs all 13 storeys ofhis hotel without any anginal complaints (nosigns of decompensation). Due to the "initialmobilization" he is now able to undertakeregularly the obligatory exercise training of our36 h 02MT procedure between the ession . Atthe end of the cure, and even week afterwardan increase in his P02-art of around 20 mmHgis measured. Afterwards the patient repeat hiclimb to the 13th storey of his hotel twi emore without complaints. The de ribed effe tof the 02MT procedure on th lung-heartsystem is not only of significance for r habilitationafter myocardial infarction, but hould beused generally for rehabilitation after illnv~~,v~.operations, accid nt and other h alth ri
t48xlD J WsEhmmahooofMe ~crdieal, cardially conditioned. 25constraint ofmobilityfthrough 20"Initial mobilization" 15during the firstsessiDl1S of the work 10O 2 MT regenerationprocedure5oInitialmobilizQfionI1/2VJIfast ,Low-riskrehabil;lation(with energetic exercise training)~ S 6 .,!-/51-- . ~stlH no exhaustion ./ (mobilily no longer reslncled )hi. Iil1ldtd by IIIIStt of I-l1ec/ang,nal complaints(serell ry restrained mobill1y) ~N° of sto"ysellchofJm,climbed in theglrtn filM13in 26DS12 in 2+0$f-- 8in 160 $4 in 80 S1 in 20 s8 9 session (day)o It 8 12 16 20 24 28 32 36100'r--I--............-...........~mmHgl....-..................--"_""""--"""""-k Pa13Course of the arterial pOZIat rest, during the Oz-H7 f gOI--------+-----+----4----=-~+-----+IZregeneration procedurewith a total of 36 hours, 11here diY/ded between R 80J----+---,JC---4---+----+--~9 sessions of It hours. 02-trt(ftSfingl10Measurement 1+ daysafter entt ofcure, elercisetraining rontinued10 '---'--~__~~-~---L.-~~~---I1 Z 3 4 5 6 7 8 9 session (day)If -Fig.89 Example of risk reduction and speeding-up of rehabilitation in a 55-yr-old infarct patient through initialelimination of cardially-conditioned constraint of mobility with the aid of the 02MT procedure GK 4-1 (A). This"initial mobilization" of the patient is of principal importance for the general problem of rehabilitation and isclosely connected with the increase in the arterial resting.poz (B) and the decrease in the venous resting Pooccurring during the 02MT cure (increase of physical fitness) 21.2.4 Shock syndrome and oxygen multistep therapyShock is a clinical syndrome affecting ill personswith more or less acute onset ofcirculatoryinsufficiency; ill persons who are peculiarlydazed, sense increasing weakness, whose extremitiesare cold, and whose skin is cool anddamp, who have a fast, weak pulse, in whomthe excretion of urine decreases more andmore, and in whom a drop in the arterial bloodpressure can frequently - but not always - bemeasured. If the various causes which attackthe different sites of the circulatory system arenot eliminated in time - in other words, if the"point of no return" has been reached - thanthe causes and consequences of the acutecirculatory insufficiency superimpose: theshock becomes irreversible. Shock need timefor its development and its clinical picture idetermined by the juxtaposition of auhost's compensation mechanism and generaland local consequences, which sometime forma vicious circle. The purpose of the cir ulationis fulfilled in its periphery that is in the dirneighborhood of the respiring ell and ti u .In this respect, shock i a more or Ie a utfailure of the circulation, in which I all andpronouncedly the capillary ir ulati n dr pacut ly to below th r quir ment f th tisues,simultaneously in e ral organ . Thus thmicrocirculation b om th k t th qu litativelyand quantitativ I ntr 11 dint r-
....------~~~.~........~T-WI'T'r-~~j;[c-;---n:enr;e_~Tlconsequen y enved rom t e tngge gth ba i of all form of hock i the common cause i the renormalization, as fast as pOIpathophyiological characteri tic of the decele- sible, or, even more effective, the substantialration of the blood flow in the capillary net- improvement of the O 2 status in the reactivework. The gen rally in ufficient circulation in capillary endothelium. In the u ual treatmentthe periphery hould be particularly con idered of shock events triggered by O 2deficiencyhere, e p cially the form which is triggered by (hemodilution [47, 154», the application ofO2 d ficiency from the mo t varied cause O 2 , as early as possible, is a matter of course.[158]. A with the selective vascular occlusion The speed and extent of the improvement innvi aged during the CMT, or with the mech- O 2 status brought about by this measure canani m of myocardiac infarction, there also be easily determined by the measurement ofe ita reversible and, subsequently, an irre- the resting P02-art and P0 - 2 venvalues. Due tover ible phase in the largely analogous shock the circulatory insufficiency, the loweredyndrome. We believe that it is not only the P02-art is often only moderately raised. Itprecapillary sphincters (hindrance of influx) should be a principle that the facilities shouldand the postcapillary constriction (hindrance always exist further to increase significantlyof outflow) [158], but also the bioenergetic the P0 - 2 art and the 71-value by means of acontrol of the cellular capillary wall regulating combination procedure with simultaneous O 2or switching mechanism, discussed above, application and HOT*. We hope that the abovewhich playa role in the slowing down of the comments will stimulate the implementation ofblood flow in shock. The therapeutic inter- pilot treatments with this combination proceventionin shock can only be successful in the dure.reversible phase. The counter-measure which1.3 Oxygen supply to the tissue1.3.1 General remarks on the limit of oxygen supplyThe oxygen reaches the cells from the capillaryblood by diffusion and is used by them inoxidative metabolism, whilst the carbon dioxidereleased as an end-product is simultaneouslydelivered to the capillary blood. The dropin Po 2, or increase in PC02' which therebyarises between the arterial and venous ends ofthe capillary, has already been indicated inFig. 9. Since O 2 deficiency in the tissue limitsthe oxidative cell metabolism much sooner thaninsufficient CO 2 removal does, it is enough hereto consider only the O 2 supply to the tissue.The limits of O 2 supply (diffusion distance)which surround the capillaries at distances ofsome 10 p.m, represent the start of the zone ofcell decay in the living organism. They are ofvital significance in the formation of the steadystate between cell proliferation and cell decayin the intercapillary space of the tissue (organs).If these limits come too close to the capillariesdue to O 2 deficiency over a long period oftime, then the cell decline triggered by thileads to a critical decrease in organ performances:O 2 deficiency conditions or O 2 deficiencydiseases [159] occur. In special ca e itis possible significantly to increase the O 2supply by means of hemodilution or HOT* (improvementof the flow properties [47 160]).The furthering of the O 2 upply limit i onetask and an elementary process of the 02MT.1.3.2Vascularization parameters and the O 2 metabolism characteristic as th~ boundaryconditions for the O 2diffusion field in the intercapillary space of the tissueThe basis of most of the pathological consequencesof O 2deficiency in the human organismi primarily the principle of th~ O2 supplyin the intercapillary pac of the t1 u . Th.principle can be theoretically and quantlta-tively formulated for idealiz d mod 1 ithrelative littl math mati aI-ph . al ff rt pr vid d th boundary ondition ar n n[161-163] and th ar ail mpr h n-ibl .
old°z-/ImitMW mode of calcu/aflonCC~~---_.L- ---lL.... __'1 q:: const. (saturated)JlI.JfO~~ ~lIIlStduiaIitIl.solunilrti f~(f/I1!(/fJ I(1/I1!flnn/lKJ.9nn:I: 101lg."!JID./1'1./4,~5:,1,; ~r r"A~~~~7 Vtl: I~~, :&1'q:: ex .C(unsaturated)r-----tl--II-/,.~2I .,. II1II- P. ' f--fr.• r. . _'lUI' iL~ r z I ! P~24 6 100III1III1fJFig. 90 Model of a single capillary with coaxial 02diffusion field. Symbols as for the solution of thediffusion field equation, see Table 10r = radius, measured from the capillary axisc =concentration, Le. 02 partial pressureo =diffusion coefficientq =consumption of permeated substrateQ= consumption constant = 6q/6clIRc =capillary radiusC c = mean concentration in the capillaryRt = radius{ at the crossing pointC t = concentration between CI and CIIR z =fictitious supply area, Krogh's cylinderFig. 91 Characteristic curve of the function _q~ =f (P0 2), Le. oxygen consumption in dependence ofoxygen partial pressure in tissue. Idealized extrapolatiaccording to data given in [164]. Parameters: P0z. atcapillary wall, 45 mmHg; T*z =time constant to the~consumptionin tissue 1 ;TA = time constant of the ~exchange circulationltissue 1 ; q02 is defined as Id O 2consumed per mg dry weight of tissue and hour1 For the definition of these parameters, see [2, 163]H~ = H~).J aRt) = Hankel's function at the pointo (R t, C t)Table 9 Mean values for the 02 consumption, the blood flow rate and the arteriovenous difference in the 02 concentrationin the blood of various human organs at 37 0 C [32]Organ tissue 0 2 consumption Q02 Blood flow rate BF a/v differenceml/100 g/min ml/1oo g/min vol.-%1 Myocardium at rest 8 to 10 80 to 90 10 to 15under severephysical strain to 30 300 to 400 to 17----------------------------------------------------------~ Kidney cortexouter marrowinner marrowtotal9 to 106 to 6.50.3 to 0.55.5 to 6.5400 to 500120254002,0 to 2.551 to 21.5 to 2.5------------------------------------------_._--------------3 Brain cortexmarrowtotal8 to 1013.580 to 11015 to 2550 to 60104 t066 to 7----------------------------------------------------------4 Liver total 4.5 60 to 100 3 to 3.5----------------------------------------------------------5 Spleen total 0.6 to 0.8 100 to 130 0.5 to 0.8----------------------------------------------------------6 Skeletal mu Ie at re tworking hard0.25 to 0.5to 102 t04to 5010 to 15----------------------------------------------------------7----------------------------------------------------------ood 0.008 to 0.01
For reasons of clarity we will consider here thesimple model with a single capillary with aradius R c and its O2 diffusion field in the interstitium,as in Fig. 90.For the calculation of the O 2 diffusion field ofa capillary with a known radius and a knownmean Po" of the blood flowing in it, it isnecessary to know the size of the diffusion coefficientD for O2 in the interstitium; also thevolume of O2 consumption qo in the satu-.2rated range of the O 2 metabolzsm and the re-duction in q02 in the unsaturated range. TheO 2 mdabolism characteristic of the tissue orcells gives numerical values for this. Its coursefor tissue or cells with an O 2 consumptionqo = 10 and 5 mIll 00 g. min (e.g. myocardiaccelrs, liver cells) is given in an idealized formand rough approximation in Fig. 91. Meanlevels of O 2 consumption in various humanorgans are given in Table 9, in accordance with[32]; this table also gives data on the mean rateof blood flow (BF) (indication as to mean vascularization).1.3.3 Solution of the diffusion field equation of the O 2concentration (Po ) in the intercapillaryspace, under consideration of the drop in O 2 consumption in the ar~ of unsaturated O 2metabolismIn the calculation of the concentration field ofO 2 in the intercapillary space of the myocardium,we work from the diffusion of thesubstrate from a central capillary to the surroundingcylindrical tissue area, in the discussedsimplified model. In all older papers on such amodel [161, 162] it is assumed on the basis ofapproximation that the substrate consumptionTable 10 The solution of the diffusion field equation for the oxygen concentration in the intercapillary space,taking into account the decreased 02 consumption in the unsaturated area of 02 metaboJism in cancer cellsGeneral diffusion equation:Area I:c > Ct --.q =const. (saturated)1 n Bernoulli'scj' (r) + -r cl (r) - 0 = 0 differentialequationBC:ci= ckin the tissue cylinder has a constant rate q(Table 10, area I). However, as soon as themetabolism is not loaded to capacity, the consumptionq drops at the same rate, in accordancewith the offer (area II). Guiding values forthe transitional value P02-t have already beengiven in Fig.91 (and Table 9, O 2 consumption).The hitherto simplifying type of calculac=D~c-qd 2 c 1 dc q--+-----=0dr 2 r dr 0~~at steady state conditions c=0Vessel geometry assumed as cylindrically symmetricArea II:BC:clI I{c > Ct -+q = const.c < Ct --+-q =(k'Cc < Ct ~q =(k'cll (unsaturated)" () 1 , () (k () 0 Bessel'sclI r +-r clI r - 0 clI r = differential= CtequationSolution:r·= RKci =0r = RZq ...9-..!.....CI(r) = ck + 40 (r 2 -Ri) - 20 RZ In RK1Solution:( )r = R t2nd boundary condition (BC) neglecteddue to adaptation of the solution to theproblem in handCt .H (1) (. Ci'). H (1)I Ot0clI r = • I 0 I-rHankel's function, type 11 See (1 65, 166] (1)2 For calculation of HO •• tables of higher functions
he cylindr'cal area upplied by the'1 ry, which only gives a rough approximafn can b en on th left of Table 10. Whenth dep nd nce of the consumption rate on theof r i considered, this area is very significantlytended. The solution of the diffusion fieldqu tion for the substrate concentration in theun aturated area is presented in detail on theright of Table 10. The symbols are summarizedin Fig. 90. The diffusion field equation presentedsatisfies our premises, whereby the consumptionin area I is assumed to be constant,and in area II to be linearly depenCJ4~ntconcentration. The co ideraf0 0tionary case simplifies the problem,a Bernoulli differential equationand in area II a Bessel differential eqwltl(]lnboundary conditions which lead to t e 101111ticmin both areas are also given in Tab etwo-dimensional diffusion field eqUiltionrelevant for the P0 2 topography in sup,plythe vessel walls from the lumen, giveanalysed in Fig. 243.1.3.4 Selection of the equation parameters for oxygen and normally or deficiently sulJPIiied ....1-a) The oxygen partial pressure at the capillarywall in normal supply lies between 50 (venousend) and 90 mmHg (arterial end). In normalsupply P0 2 = 45 mmHg (6 kPa) can be seen asa representative level for the middle of thecapillary, and P0 2= 30 mmHg (4 kPa) indeficient supply.For a more accurate consideration of theeffects of an increase in the P0 2 of the inhalationair, as envisaged by the second main stepof the 02MT, it must be remembered that thedrop in P0 2 occurs predominantly in roughly25 % of the capillary length, calculated fromthe arterial end [166], cf. also Fig. 3.b) For the oxygen partial pressure in the transitionzone from saturated to unsaturated 02metabolism of cells, P0 2 _ t= 10 mmHg mustbe used, in accordance with the characteristicin Fig. 91.c) For the diffusion coefficient of 02 .healthy tissue, values between Do'], = 3 ·10-6and 9·10-6 cm 2 /s are used, since the valgiven in the literature vary greatly. For comp .son, D02 = 3· 10-6 cm 2 /s is given for' laccancer tissue, which is used as a basis in [163 .Because other papers [166, 167)D0 2 IllS 9· 10-6 cm 2 /s, we have also incl dthis value in our consideration. Since we 0need principles here, and not absolute vatuthe calculations have been extended overwhole range of variation of the D0 2 values.d) The oxygen consumption in saturation isaccording to the respiration characteristic (cf.Fig. 91), P0 2 = 10 ml/100 g·min and is in acordance with [164]. Depending on the demandson the functional capacity of the heartother P0 2 values were also included in thecalculation.e) In accordance with [166] R c = 4 /lm wasused for the outer capillary wall radius.1.3.5 Calculation of the P02 distribution in the intercapillary space of normally supplied tissueFigure 92 shows the calculation of the O2 cuncentrationdependent on the distance r of thecapillary axis for normal tissue with the equationparameters named in Paragraph 1.3.4. Thecourse of the curve for constant substrate consumption(area I, simplified calculation) isgiven, as is that for the dimini~hing substrateconsumption below the saturation concentration(area II, accurate calculation as in [168]).With reference to the supply, the level Po 2 =3.5 mmHg (0.47 kPa) should be seen as thecritical oxygen partial pressure, at which, accordingto [146, 164] the respiration of thecell changes to fermentation. An approximatelynormal supply thu exi t ~ alon~ a t~econdition P0 2> 3.5 mmHg remams fulfilled mthe largest distances r occurring in the m 0cardium. The variation of r which we u e abasis for healthy tissue, in accordance with [166, 168, 169], is given in Fig. 92. It canseen from the courses of the curves under haconditions the P0 2 reaches criticall 10 1 Iin the tissue. The calculation given h represent the most unfavorable bord rIinbecause of th und dying model with a inglcapillary. In reality th contribution of nihboringcapillaries to the 02 suppl i alto be added. Thi additional ontribu i n iesp cially promin nt in th my rdium duth r lativ ly r gular arr ng m nt f thlarie th r. i ur 9 h n idch m f th pill riz i n h
angts of r for some healthy tissues: II1)fXOrrIium [168]IIi /tithJartrx D66J, artln/arln~]IWifisslJt ~~ tneIJY turnrJwr LJOH---~~----4tor-----::!~+-----t----t--(I1/?O I)saturated.transition(oreaJ[)unsaturated.change intofermentofionFig. 92 Po values in tissue asfunction orthe distance r from thecapillary axis, calculated for thediffusion coefficients 00 = 23.10- 5and 9'10~ cm 2 /s; further assumptions:healthy myocardium accordingto [163, 167]; O 2 consumptionq = 10 ml/100 g. min (normal) aswell as 20 and 5 ml/100 g. minF'93 Schematic capillary pattern of the myocardium.1:~lized cross-section, modifie~ ac~ordinQ to [168].On average one blood capillar~ IS asslQ.ned to each hea~tmUlcle cell, so that every cell IS supplied by four caplllariftcardium. According to thi each cell i uppliedby four capillaries. The maximal nutriti edistance, corresponding to the di tance.betweencapillary axis and m 0 ardial ell ientered above right in the cherne. In wellperfusedmyocardium under phy iologi al onditionsthi value r is 15 fJm and more underpathological condition (e.g. in tructural dilatation).Because each cell i supplied b fourcapillaries, the drop in the P02 around the ellaxis is smaller than in the mathemati allsimpler model of the diffu ion field f a inglcapillary (for a mean of al ulation f r themodel with four capillarie, e [170]).
Tn-T-~-----1~--~--~JaluralttJtranSitionunsa/ura/ttlchongt iTtoftrnitnlatiOl1Fig. 94 P02 values in tissue as function ofdistance r from the capillary axis, calculatedusing the following parameters: diffusion coef"ficient 002 =3 X 10~ cm 2 /s; oxygen consumption,q =10ml/l00g X min (normal);P0 2at the capillary wall, as low as 30 mmHg.For increasing the value of T when O~ is increasedby a factor of 3, see Fig. 921.3.6 Calculation of the P02 distribution in the intercapillary space of deficiently supplied ti"ialllAFigure 94 shows the calculation of the 02 concentrationdependent on the capillary axisdistance r for deficiently supplied tissue withthe equation parameters named in Paragraph1.3.4. The situationt which has drasticallychanged compared to Fig. 92t is a consequenceof the numerical deterioration of threeparameters in the case of deficient supply.1. P02 =30 mmHg (4 kPa) at the capillary wallis assumed as a representative levelt when theO 2 offer is reduced. The variety of the factorswhicht individually or jointlYt can cause thelower O 2 offert have already been shown intheir functional network [I 71 ].2. In severe circulatory disorders and in disordersof the microcirculation, as well as in thefast mesenchyme reaction after sclerogenicnoxae, investigated by electr n microscopic andalso nuclear-physical methods [172]t i. e. in vesselschanged by arteriosclerosist an additionalsevere deterioration in the capillary blood flowmust be expected. In such cases, a P0 2 of between30 and 100 mmHg (4.0 and 1.3 kPa) isto be assumed to be representative in the capillarywall.3. An increase in the maximal values for r 0 curs in structural dilatation.I t can be seen from the resulting curves that ecritical level P02 = 3.5 mmHg (0.47 kPa awhich the metabolism changes from respiratioto fermentationt is reached on our idealizemodel even with values of r which are small rthan the maximal values of r of the damaged 0even healthy tissue. The situation becomes emore critical whent due to high physical st .for example, an increas~ in the O 2 cunsumptioover 10 mIIIOO g. min occurs during the d 6cient supply.For a more refined consideration of thedelivery to vessel walls and tissue the innconvection of the red blood cells (intensificonvection and O 2 release with fast blood fland the hemodynamics (e.g. formationturbulences) must also be taken into a,CCC:>Wlt[173].
~mO,·~1normal function"........ full-sca!e furnorerI~'IIostructure -consemngturnoyer(large mhighlydiffertntiafed. (tlls )endofstructural integrityreyersible damagetirreYersible damoge•Moder;stit titnt inter·f'S for (mrsiblt and brain myocardliverkidneyskeletalrrtWrsilJle domaDe ium muscleCD symptom fret t,s~ paralysis 8-11 s~ reactiration a-10min swera! h 3-4h 3-t, h(at rest)~ IDlencyrriod tor 10minrecorer (+min slflll),hours~ recovery todo'ls sertmldOJs StYtraldo!s--serero! hFig.95 Behavior of cellular turnoverafter stop in 02 supply [32]. Brokenline: recovery of cellular turnoverafter early enough release of the stopin O 2 supply==-==",160~~~mmHg{a 140lungIJloodfissue120100 l'80po]60somlFig.96 Scheme of the oxygen distributionin the human body [174]. The 02is presented as fluid, the height ofwhich indicates the partial pressure inthe respective reservoir. The arterialblood in the pulmonary vein, the leftheart and in the arterial system, containsca. 280 mi. The venous blood stillincludes a mean of 600 ml (!). Themyoglobin binds approximately240 ml, whilst the lung on average containsanother ca. 370 ml1.4 Reactions in tissue to local oxygen deficiency1.4.1 Reversible and irreversible cell damageAfter a short symptom-free interval, in whichthe cell function remains in full, every total topin O supply cau es 2damage which is at firstreversible but which soon cau es the organ[unction to cease and the structure to disintegrate.If the O 2supply re-occurs befor thructural di integration, th organ functionurn, a in ig. 95. If thi tim point i ex-; · i Ie dama e occur .Figure 96 how a h m of th di tributi n fthe 02 cont nt in th b d . Th r ti all thwhol oxyg n wo~ld b 'n um d in ppr imat ly 5 min with a r ting O 2 n umpti nrat of 300 ml/min.In th appli ati n f th 02Md aling with a w ak n d 0with a ttl int rQlpti n. Ju tr u u 11uppi nd n tf w t f
aPI)Ii:lcati?n with a patially very limited inter-Ion In O2 upply (th occlu ion of certainblood v I form an exception to this). Whenth .0 ygen upply i weakened, the extent toWhl h the reaction mechanism discussed in thefollowing sub-paragrap e involved 'whole occurrence depends on the de eeduration of the reduction, the type of til'lIUeaffected, and other factors.1.4.2 Energy gain by means of glycolysis in oxygen deficiencyThe individual cell in the organism needs forthe maintenance of its structure and its r~adines and ability to perform its function aertain energy supply, which it mainly obt;insfrom the oxidative catabolism of nutrients,when the 02 offer is sufficient.When the oxygen is lacking (anaerobic condition)the required energy can simply be gainedby glycolysis. Under in vivo conditions theoxidative breakdown of 1 mol glucose delivers689 kcal (2885 kJ) and is connected to theformation of 38 mol ATP. With 270-380 kcal(1130-1590 kJ) these represent the (physiologically)utilizable free energy which correspondsto an energy yield of between 39 and55 %. By comparison, the transformation of1 mol glucose into 2 mol lactate is connectedwith a reaction energy of only 47 kcal (196 kJ),by which 2 mol ATP are formed. These correspondto only 16-20 kcal (67-84 kJ) and anenergy yield of 3.4-4.3 %. Thus the aerobicdecomposition of glucose supplies a totalamount of energy which is 15 times higher, andATP which is 19 times higher, than glycolysis[175, 176]. It is therefore not surprising thatthe end-product of the glycolysis, lactic acid,still contains a high amount of energy.Special relationships exist in the heart inasmuchas the heart muscle which is sufficiently suppliedwith oxygen, covers more than 50 % of itsenergy requirements from the oxidation offatty acids. Glucose contributes 18 % to t eenergy gain, lactate 17 %, pyruvate approximatelyI % and ketone bodies 5 % [177]. nconditions of hypoxia, however, the breakdoof fatty acids is reduced, and glucose uptakeand breakdown increase, as does the breakdoof glycogen reserves; thus lactate thereby accumulatesto a greater extent [178] and overacidificationoccurs. The joint use of the lac 'cacid as an energy substrate in the myocardi(and perhaps also in the brain with a contrib tion of glycolysis to metabolism of approximately19 %), can be strengthened by g~trophanthin[169, 179-182]. This effect is indicatedby an increase in the pH in 02-deficienareas of the myocardium, roughly 3 min afteradministration of g-strophllnthin. This increaseis found only with g-strophanthin, not withdigitalis preparations. This confrrms the oldconcepts (Sarre, Uhlenbruck 1953) that gstrophanthin, but not digitalis preparations, improvesthe O2 supply to the heart muscle. It hasbeen hardly considered that g-strophanthin (a cording to [148, 183], highly effective and withreproducible potency, even when applied perlingually),in addition to its main effect in theheart muscle, also triggers a peripheral effec .Due to its action on the vasculature the bloodflow is increased [185] and the O2 and gluco esupply is improved, particularly in tissue lyingon the other side of the blood brain barrier[186, 187].1.4.3 Target area in tissue for O 2 deficiency and 02MTThe calculations of the dependence of theoxygen partial pressure P02 on the distance rto the capillary axis in the single-capillarymodel (Fig. 92) referred to the P0 2 level (e.g.45 mmHg) existing in the centre of the capillary.In reality the P0 2 drops, under normalconditions, from the arterial to the venous endof the capillary from 93 to 63-23 mmHg,depending on the organ (cf. Fig. 9). For anexample roughly corresponding to skeletalmu cle, curve A in Fig. 97 shows the course ofthe P02 along the capillary, and cu~e B thecou e af the coaxial cylinder area of thdi tanc r = 30 IJm. he pre ntation howthat the tissue area most at risk from O 2 deficiencyis localized at the venous end of thecapillary and at a great distance r from thecapillary axis. Under normal ondition hrelative frequency i f < 2 % for P0 2•mmHg (change to ferm ntation m tab li mand f < 0.2 % for P0 2 < 1 mmH riti al Pof th mitochondria, irreve ibl 11 d ma can be roughl . n from th di tri u icurve in Fig. 98.Th ti u r a with h' hv nou nd of tha di u d form
trunJffmsotlunsof."""~~_.:.....- -=:::::~~~~~:=;clxJl1!Jf into fermentation1111111doma~IJim'------shifteD. to fir. left rtg/1fn~-~k~m:y In 0l HTwtlcol POl ......fl7:-0r---:~mifochonOnQ (fmm- Hg)hIgh-ask ftssuearea III Oz- deficietrJ (Ie/halcorner):- olll1e ~nousemofI~cuplllary- at ~qtltSlances I< from thelXIfJillory oxis.Fig. 97 P02 Topography in the tissue be·tween the arterial and \Jpnous ends of thenourishing capillaries. Example. Presentationof the target area for 02 deficiencyand 02MT at the venous end of the nour·ishing capillaries. 1 mmHg = 1.33.10 2 PadJrnIria t~~~)250/.Po-ren~tZOo10,0..I \I,H 15 I \,..\, \10 -,~ ;prop:v-tion \0fYlJPfYt10n IirYnarttria5I ~~Stnl \. tIKiofcoptllades, loroportKJllofCl!IIs 0 ,k v""j/rmlJl¥rfdbJO/f16i'i!ncJ':.... ........2030 4050 60P02 --""--~- 1-0_- ~70 80 90 100mmHgFig.98 Relative frequency H of the O2partial pressure in the cerebral cortex ofguinea-pigs under normal conditions.Modified according to measurements in[32]. 1 mmHg = 1.33.10 2 Pathe microspaces of the organism wher thedestruction of cells is initiated or oc ur , andwhere an energetic limit is set on gro th in theintercapillary space.In the brain, where no new nerve ell~ areformed and where an e tabli hed networkexists between the cells, thi patial relati n haa strongly definitive character. For thi fan,too, a di order in the form d mi f tru tUfhas greater con equence than in ther r n(concu ion).Here the c II 10. 0 cur bth body of th ag ing indi idual tri t d ptit If to th incr a. ing d t ri ration in thupply to it ti u (dr p in 'ardi ulm n Ip rforman with ag). t thi. 'it in th int f-capillary pac u h high rat f' II 1 ,finally d v lop in organ.' that d fi i n
are triggered. At the same site, howvr, there i al 0 a main effect area of the tissue connected with this (increase of 11 aand the increase of the O 2 transport 002MT . An improvement in the deficient situationin the venou upply area of the capillary cell destruction far back and often allow a reblood flow) after 02MT, shift the border ofby m an of rai ing the P0 2 - art is, however, filling of the areas put out of action after O2trictly limited, because this rise benefits the deficiency, by means of cell division and cellart rial area of the capillary more by far (cf. migration.Fig. 3). But the lasting drop in the P0 2 oven1.4.4 Change in the cell metabolism from respiration to fermentationIn increasing O 2 deficiency the cell is forced tocover its energy deficit by glycolysis (Paragraph1.4.2). Due to the energy yield of fermentationmetabolism being only 7 % compared with respiration,glycolysis increases very quicklybelow a certain POz level. It is therefore usualto speak of a sudden change in the cell metabolism.In [146]Po 2=5mmHg (0.6 kPa) is givenas a critical level for the change from respirationto fermentation. Because of the significanceof this figure for the over-acidification oftissue areas affected by O 2 deficiency, discussedin the following paragraph, it seemed worthdetermining directly the critical P0 2level in aspecially constructed Po 2 /pH in vitro measurementarrangement with high sensitivity [146].For this the hearts of I to 2-day-old, or adult,rats were homogenized in an ice-cold bicarbonate-freeKrebs-Ringer solution (KR) or inlactalbumin-yeast medium (LV), and incubatedin the named solutions containing 200-100 mgt100 ml glucose in vessels of the type describedin Fig. 100 [188,189], at T = 37°C; pH andP0 2 were continuously recorded, the startinglevels being adjusted to pH = 7 and POz =9-14 mmHg (1.2-19.7 kPa). The pH was continuouslyre-adjusted by adding 0.1 N aOH,the adjustment of the PO z achieved with z/O 2 mixtures having a defined composition.Before measurement was begun, the vessel wascompletely filled with the tissue suspension (noheadspace). For the measurement of the POzw~ used an electrode developed in our institute.The measurement of the drop in POz, caused bycell respiration of the myocardial tissue in theKrebs-Ringer solution is given in Fig. 101. Therespiration rate here falls from higher levels atP02 = 45 mmHg (6 kPa) to zero, when POz =1 mmHg (0.13 kPa) is reached. At the timepointt = 155 min oxygen was added again, somuch that the P0 2 level in the solution roseagain from I to 6 mmHg (0.8 kPa). Despite thepreceding deficiency condition of approximately20 min duration, the myocardiac cellsfIOl- eI~C'trode/"SSurt-comjlt'llSO!ingcopllorypH cOlI/podgloss electrodechorging connulo with tap...l..-J.l>-H-t-- stopptrolr-It!Jl!llld~:t:l~~;;;-- rent Yolre50m1f7Fig. 100 Incubation \IIssel for the measurementof respiration and acidification (glycol •sis) of myocardiac cells as a function of thePO z le\lll
Add/11MofOX/It'll Af1l J~t , CoIJ!roItPns:r-- goSSIIfl7J1oI-% O~Addilionof"fX)% ~lmx. 0 Am' { . ,J' mmlfk45r--t9"--+!...!!!!~+---l- iOllTlfJX· 'KIm rtsprOllOn ~ II t----i~rrIiIm: rutllf .;. Mil tiI:~v 78.0 sheep: 18\40r--t-=-=t=..+-+--+---+--t--+_---4_---l13Sr---t~~/:..:...:·~90----+--+-----,~__l__-_+_----:-+-___l\Tissue: Il1JOCOro'tiJmQfnewbornr~tsl1eo'1i1m: IfrtlJs-itilgerj wlthout IfCO J3 /62,5 e6lU. : 5'IO- J gmt ' (storlingleveIJo \ Cz : llfl0·Z (2gad !lf5ml/(RJ+------iT :J7°C25t---r--f/_·54.-=-,6-+__+-~/r....:.-· -pt._'.5SUfr.-t-:_~lJ_'IIII!II-t~~~~:....:.:'N;~'lO~= t-lrfi_'Illm._~:....»-+--_~PIb ~I \/49,020 r------r--+-r--+--+---+--I----+----+-~\.42.515 t----+---+--""','f----=---+--+---+--~--_+__-_l~9j.Jmm~10 1\,32P\ ~5assing. ,. \ 13Vti.-%O;ClKu¥intofernrn/ot/on metabolism,,' /18.7 1590A ~gl5mmHg5 f..IlJqil¥1~Qfstl7Jl{P"pH-nrIudkY1in .~'15,1 ---l--+----f".... ~K,...---'----4} (llflfdiono!; fir . '00,4. 6 ,03 " ṙvlm/Orso!l.IIl1!ed2 ~ ~ ~1r.gmml!J1~---+---+---+_---+---+-----iI____""-........---t___-t_1o ~~o ZO 40 60 80 100 120 140 160 mlflS oxygent .. cliimica/lyIxmJ.Fig. 101 Measurement of pH reduction (conditioned by cell respiration) of a Krebs-Ringer solution after additionof myocardiac tissue. Electrochemical P02... measureme~t usin~ th~ Clark electrode. Result: change into fermentationmetabolism at P02 '" 3.5 mmHg (0.46 kPal. Stop 10 respiration at P02 ~ 1mmHg (0.13 kPa) (critical Po formitochondrial 2OlJset offermelJtatlon"",Hg ,-----=:::r:-:--!--:-:-:-:=:::-:-=:===-==-=======-:---=--~-:-:-::==t.,6 ... •....-.0-·--S ......~.~..,4 ; -:tjf±!~~~~~~~~~~~~~~~J,--IFig. 102 Simultaneousregistration of pH andPO,. in Krebs-Ringer solutionafter addition ofmyocardiac tissue from24-48-h-old rats. Result:Change in fermentationmetabolism after reductionof the Po to3.5 mmHg (= a.46 Pal,cau. ed hv Ntl fA. ifAtinn
n respired again, the drop in respiration rateto the defici ncy phase being only approximately13 %. Th drop in the P02 level from6.5 to 1 mmHg (0.87 to 0.13 kPa) is directlyr f1 ted in the record in Fig. 102 below. In thearne figure above, the course of the pH in thebi arbonate-free Krebs-Ringer solution is reorded.The absolute values of respiration andfermentation of the myocardiac tissue arerelatively low, evidently as a result of celldamage due to the manipulations undertaken.De pite this, the remaining metabolism sufficesto allow us to see clearly in the solution, whichi kept buffer-free, the time-point of the pHreduction due to the start of ferm.mt.atiimetabolism. It can be seen from the recordi_in Fig. 102 that in the myocardiac t~'!IIUeamined, the sudden change to fermenta .metabolism occurs as soon as the P0 2 lew .the solution sinks to below 3.5 mmHg 0.46kPa). Roughly the same level is also fo d'other cell types. It can be deduced from thesudden transition to fermentation metabo'that even a relatively small improvement in eoxygen supply in the critical area of the tisis usually enough to bring about respirationmetabolism again, and thereby to eliminate thetissue over-acidification.1.4.5 Over-acidification of the tissueIn order to become better acquainted with theover-acidification by glycolysis (caused by 02deficiency), we chose as a model the myocardialtissue of the rat under simulation ofamyocardial infarction. The pH measurementswere implemented by P. G. Reitnauer in thesupply area of a coronary vessel, partiallyligated, with a movable pH glass electrode onthe beating rat heart [146].Wistar rats placed on a thermostatically controlledstage under ethyl urethane anesthesiawere tracheotomized, artificially respirated,thoracotomized and pericardiotomized. Theexposed, strongly beating heart seemed at firstto make measurement impossible, but wasbrought into a position as favorable as possiblefor the implementation of the ligature ormeasurement, by placing a nylon loop just alittle way below the surface of the outermostapex of the heart. A thread under a left ventricularcoronary branch was fed through themyocardium with a bent surgical needle, andmade into a loose loop, in order to trigger lateran experimental myocardial infarction. In orderto throttle the large vascular trunks, the hearthad to be turned upwards and the ligaturepositioned on its dorsal side. However, sinceit was difficult to manipulate the loop, nolying beneath the heart, during measurement,smaller vascular branches of the ventral side 0the left ventricle were also ligated according 0the individual shape of the coronaries. The"low-noise" pH measurement on the bearrat heart was made possible by very fmemicroelectrodes (Figs 103 and 104) [190 2which had been developed in our Institute formeasurements of the pH profIles of optimallover-acidified cancer micrometastases [189 192]. The largest diameter of the inserted part ofsuch an electrode was only approximatel200 JJ.m, so injuries critical to the heart fun tion were avoided. A miniaturized (Pt/Ag/AgCl/0.9 % NaCI in H 2 0) unit served as referenelectrode. For the measurement the referenand the indicator electrode were placed on theheart concentrically from both sides. fterfirm contact of the reference electrode with hsurface of the heart, there followed the in rtion of the tip of the pH electrode in the upplarea of the coronary vessel branch prepared f rthe ligature, approximately 1 mm deep in hmyocardium. The position of the heartstabilized by the three point of contact apeloop, reference and pH electrode enoughFig. 03 Sch matic cross~tctiona pH micro lectrode
A100pmI IBFig. 104 Tip of a pH microelectrode before (A) and after (B) isolation with silicone rubber (free length of thesensitive tip is a few 100 /oLm)make possible the measurement and recordingof the pH values. Figure lOS shows this experimentin the stage before a small coronary vesselbranch on the ventral side of the left ventriclewas ligated. For the simulation of a coronarymyocardial infarction, the loop used for thispurpose could, after stabilization of the pHstarting level, be more or less tightly pulledtogether using two pairs of tweezers andavoiding any further influence on the positionof the heart; the loop could also, if necessary,be loosened again at a desired moment, byinserting a fine needle between the thread andthe myocardium.Using the experimental set-up discussed (Fig.106) we could record the pH course in the O2deficient region of the myocardium of rats inthe course of an experimentally generated infarction.In all experiments there occurred avery ub tantial drop in the pH immediatelyf er the triggering of the 02 deficiency in theyocardium, a a re ult of a local incr~a e ,inic acid concentration. It can be seen In Ig.6 how the P02 ill the supply ar a of the r I •ve el ink by ApH = 1 within 2 min.immediately after the constriction of a coronaryvessel branch of the left ventri Ie. A aresult of the incomplete ligature and a remainingsupply from other sources (collateral ve sels, diffusion from the environment) thereoccurs a pH level of 6.2. The remaining upplycan be proven by the fact that when artifi ialrespiration of the animal i topped the pH immediatelydrops further and then reache a Ie elof 5.2 within 16 min. This al 0 how how f tand how low the pH in the myocardium mu tdrop and cause damage to the ti ue (mi rocirculationinhibition, va cular ·poro it increasein red cell aggregation relea and a ti ation of the Iy osomal enzyme tol ti hainreaction etc.) when, a can be e pe ted in lar rhearts (in humans for example) th inf r tmechani m proceeds in u h a wa that th r ino remaining upply from th nvir nm nt.The method of pH r gi tratitemporarily brought und r 2w 11 uit d to giv inf rm ti nth damag au d b n dand dur ti n f th impairm nt
Exholationtubeloop aroundcmebroncllalief/coronary~sselsfmf Itgntened)reference ~/eetrodewtfllpo/sIal !iaCisoluftOnas contactfluIdlefl venfriele of!leart10mm"--__/lifI§endotrachealtubemicro -electrodepH-glass(mserted in thetissue area suppliedby theligated tWigtllreads tosttiiize the---- position of theheartFig. 105 pH measurement in myocardium of the left ventricle of a rat, under conditions simulating an infarct.Tracheostomy, thoracotomy, pericardiostomy, artifical respiration. Measurements on the beating (fixed) heartusing a glass microelectrode having a pH-sensitive tip of 100 ~m length [146] were done as smoothly and tissueprotectivelyas possibleelectrode CIYOmJry vtsselinserted constricted54J21-1 l l17AartificialrespirationinterruPted79876541pHJ 26'987654J21or" = "'"~ "\\1'0..123'S6789~"~3U5M"8W~nnB~~UDM~t •...,;""'-.....Fig. 106 In vivo pH registration u ingglass micro~lectrodes in the myocardiumof the left ventricle of a rat after generationof O 2 deficiency by constriction ofcoronaries (pH minimum =6.25) and bcessation of artificial respiration (pHminimum =5.25); T =31°c (146)
Uf}Qturetift,d.':H-r-t-t+A~+-1+-H++-+++-++W-+-H-+-~~::::j:+=l=+=P+~Jf++++~~~j:tt:t:ii:!::tt±±±±±±j~l±±±±f:B~lli, rt;-H++-l-+-+-t==1--..k:k+-+-~-+-w-+-w+m=+=u=+=u=+=u=+=::r:=r::J5 rt-r-H-t-+-iH-+-H---+=P*..,J-~-+-W-+-w-+-..r..+-+-W-1-W-+-W-1-W-J4rt;-H++-l-+-+-H-+-l-+~k+-+-W-+-w.....vW-l-W-l-W-l-W-I-W--J~t=t=++~~:t=t::t:4=t=t:tti::et±~H±fu:EEEHE3jxEE,H-rt-i-+-HH-+-H-+-+-+-+-l-+-+-W-+-W-f.-W-f.-W-I-W-I-W-+.-W-l6 O~1-;2~3~'-:5~6-:7~8~9:-:f}=-::11-:!12:-:B~14-:1'5::-~:l:-lS-.J.:17~'8':-19.L2.J.'O....J21L22L.l2J-2,L25L126....J27L18L29.LJ~L31LJ2.LJ33L3'L~.LJ36L37L38..LJ39"'"t ..Fig. 107 pH course in the myocardium of the left ventricle of a rat, showing the reversibility of tissue impairmentdue to 02 deficiency: pH renormalization after lifting the vascular occlusion as indicator. In another experimentof this type the blockade was not lifted after t = 24 min, but only after t =50 min, and did not return to normalCirrewrsible tissue damage, stop in microcirculation)hie or irreversible nature (cf. Fig. 95 above).Figure 107 shows an example of this. In thisregistration the pH drops from 7.7 to 6.3 afterthe vascular constriction, i. e. by 1.4 pH units,and quickly rises again to a normal level (7.3)after the vessel narrowing is lifted 22 min later.This shows how irreversible damage can beprevented and the metabolism of the tissuerestored, by eliminating early enough the disturbanceof supply. The restoration of the pHin the affected tissue area after the removal ofthe disturbing factor can be regarded as anindicator of the still reversible nature of thedamage.The duration of the phase in which the damageis still of a reversible nature (e.g. 25 min inmyocardiac infarction) is, according to WHOstatistics, only in 5 % of all cases longer thanthe time until the start of emergency medicalcare. It necessarily follows from this that onlythe patient himself (informed, prepared andsupplied with fast-acting drugs and, if necessary,also equipment) can aid himself effectively.When risk factors exist, it is therefore one ofthe most pressing duties of the physician dealingwith the case to equip the high-risk patient80 that the danger of irreversible 02 deficiencydamage is minimized (e.g. with the emergencypackage of "Strodival special", Fig. 87, .and, ifnecessary, also with 0.5 g methylpredmsolonefor risk of myocardial infarction, or with anoxygen carrier bag device for risk of strokec.). When irreversible damage has already ocerred,the natural timepoint for particularlye ective counter-measures ha passed.2 deficiency can have the mo t varied cau e ..of he e cau e i an inadequate -an thetl-zing technique (intensity and duration). Themeasurement in Fig. 108 shows the fast, substantialdrop in the pH in the cerebral cortexduring the death of a rat, caused by an overdoseof ether l2, 191]. We are dealing here witha very complex process, occurring in a largerconfluent tissue area, a process in which notonly O2 deficiency in the nerve tissue, but alsothe deficient situation and thereby labilizationof the blood-brain barrier [192], must play arole (see also Paragraph 1.4.10).Connection between volume of the 02-deficienttissue and amount of over-acidification.In the experiment in Figs 105 and 106 thevolume of the 02-deficient region in the myocardiumis V l'l:I 10 mm 3 (supply area of thenarrowed coronary vessel) after 3-12 min. ThepH drops to approximately 6.25. After t = 12min, i. e. after termination of artificial respiration,the deficiency volume spreads over thewhole heart, and a further steep drop in pH canbe detected in the registration. This findingleads us to the question of the influence of thevolume of the tissue affected by O2 deficienon the size of the pH reduction.Because the lactic acid formed by fermentationis quickly drained off the cell, th intra llularpH of a single glycolyzing cell hardI dr pbelow the level of the environment [191]. Hever, overacidification increa e rapidl ith increasingvolume V of th c 11 ongl m rati na can b s en from m a ur m nt n mi r meta ta of diff r nt iz [191). Th r I ti n-hip b tw n pH drop and lum f mi r -m ta ta con i ting f 1m t 100 fglycolyzing tumor 11 at n t nt I dgluco I v I f 4· 10- 3 glml i i n th
[Xeftt of,t"". Respiratorv... standstill117, 1 ~pHl210'"fr-..."f11JiJ1lppt6rtJITttfiaIItlttionpoltnfiIJ/.s in EeGE*11M\,~ r.. 37·C,\ pHA-imlor~ ~ '~sfiIItJf• 6.40\\\,69,76~,l I-.-....- -I1etut tr:'tWR" ""t- 430 405 JIK) "60 30 ominoto 1 2 3 4 5 6 7 8 9 10 11 " 13 14 15mint ..~pH·5,87finilimum)Fig. 108 Recording of the pH incerebral cortex of a rat in the pre-fiand final stage of prolonged etheranesthesia at a normal blood glucoselewl. Result: a spontaneous, rapiddrop of cerebral pH leads to exituslethalis within ~ 6 min(eg. flI19iTapet:lrrir)~myrxrutIitr irfurctJ1ysoso11KJ/ qloIytic t:IKtincytolySismJt'lion1KJI1-anl/uenftrunsitiontrJI1f1uent Q/'eosmimi •I'/flllalt:rJrtrr' smtlll-focus necroses Il11it:rocJrculotionrlisturbedififlfJisfatJe i tfJ/1 -f:&N,focliS t.crosis tlifh Copi rtJr.l doma~.....--.........,.......---~I1 10 10 2 10 3 '2,0' 10 5 10 6 10 7 'n:Iir l'tIs6.----..,....L.----r-.L-----r-...L---..,......L----r-...L---r-~-~..:i....:;£=:::.;:=-=.::::..imasinrJo'inhib Hail 'Y'T4 b;::---+----+----+----+----+------l-------l-------l---~~2 :::-+-----+-----+-------+-------+-------+-~ ~ fCfivtIiionol71---+----+-+--"----"'Il~~~~--+_----+---__l__-----+-____l 'I:Y::f1:~p1 1 ~--+---+-----+---+--6~--+----+---+---+---+--=-,~---+----+---+---+---+---+--'6 L---~J,.o.--~....--~.-----:+-.,...---+,---,.J.,O--....,,~OO---,00...L.-O",,-...J..Fig. 109 Guidelines for the dependency of the tissue pH on the size of volume V with total 02 deficiency. Meurements on cancer micro-metastases as models for glycolyzing tissue, with glass micro-electrodes under CMT cditions [2, 191]; V ~ volume with 02 utilization deficit•solid line in Fig. 109. We must allow for a normalblood glucose concentration for ourproblem (except for badly stabilized diabetic,ee below). Different fermentation capacity andupply ituation of the cell a well a oth rm tabolic exchange rate con tant are al 0
1000S! p.!!.. levelsmeasurtd inlerctlfli/lari/]79872f~XiOtlity oferythrocytes1 CMT • tumor tissue under cancer multistep therapy(CMT) conditions..iJ. g. metlSlUtd fisSIle -pHin OIT 1inforcl-I IV /.~ V 1/~ ~~~ ~ 'IV ~R·50 151""65 2 4 6 8 6 2 4 6 8 7pHR •Fig. 111 The pH at the venous end of capillaries (pHcv)in tissues under glycolysing conditions as function ofthe tissue pH at a given capillary distance R. Approximationaccording to [140]very small and very large volumes of O2 deficiencyin the myocardium, which are includedin Fig. 109. These measurements gave us thep values for the upper and lower boundarylevel of the transition curve for normal cellswith fermentation metabolism.ccording to our model, the followin~ as es ment should not be very far from reahty: the67472811,8oFig. 110 The pH as function of the distancefrom the capillary axis r in the venous capillaryarea of tissue volumes lJ ;;;. 10 mm 3 , underglycolysing conditions (lactic acid formation)of different intensity; calculated accordingto [140]. The lactic acid accumulation occurringin strongly inhibited microcirculation(e.g. case IV) is neglected. It brings about asignificant pH reduction in capillary andcapillary vicinitylactic acid formation in the space of the narrowglycolytic zone (cf. Fig. 99) of a single intercapillaryarea is not enough to lead to a considerablereduction of the mean pH level in theinterstitium (and at the venous end of thecapillary wall). Only when the glycolytic zonesof many intercapillary areas come together(V > 0.2 mm 3 ) can the reduction of the meanpH in the tissue exceed 0.5 pH units. pH reductionsof more than 1 unit in the tissue (andsevere pH reductions also at the venous endof the capillary walls), which finally trigger theblood microcirculation inhibition and capillarydamage, do not occur until the volume of theOrdeficient area exceeds 10 mm 3 .The consequences of an O 2 deficit in thevarious organs and tissues of the human areoften determined by the relation presentedhere. The connection between the size of thevolume affected by O 2 deficiency, and the levelof the pH reduction which occurs, is thus oneof the elementary pathophysiological bases ofO 2 deficiency diseases and conditions. It annow be understood why critical con equen e(e.g. large-area necrosis after a myo ardial infarction,tissue degradation in inflammati nprocesses) only occur when the aff t d ti uarea exceeds a certain volume (e.g. _ 10mm 3 ).pH profiles in the intercapillary spaccan be expected for the venouglycolysing ti u r gionmention d minimum volum[140), can be n in Fig. 110.
ventieFig. 112 pH decrease between the arteriand venous ends of the capillaries in tiwith severe 02 deficiencyAn approximation of the connection betweenthe tissue pH measured at a certain capillarydistance r, and the pH level at the venous endof capillaries in glycolyzing tissue, also calculated according to [140], can be found .Fig. Ill.1.4.6 Reduction in the microcirculation of the bloodThe lowest pH level in the capillaries of thetissue area with O 2 deficiency always exists, ascan be seen from Figs 110 and 112, at theirvenous end, where the lactic acid formed byglycolysis in the intercapillary space flows away[140]. A further reduction of this lowered level,roughly over the whole length of the capillaries,occurs, according to the preceding paragraph, inlarger tissue areas affected by O 2 deficien(V = 10 mm 3 ). Then there exist conditiowhich result in a drastic deterioration in themicrocirculation of the blood in O 2 deficienttissue (cf. Figs 1 and 75), and thereby and a cumulation of lactic acid. The physiologicalfoundations for this have been given in detailabove, particularly in Paragraphs 1.1.1 and1.2.1.1.4.7 Triggering of the non-specific mesenchyme reaction02 deficiency is one of the sclerogenous noxaewhich trigger the non-specific mesenchymereaction discovered and described by Hauss[] 72, ] 94]. It can even be ascertained from ourinvestigations (Paragraph 1.] .8.2) that most ofthe sclerogenous noxae in Table 11 cause O 2deficiency (example Fig. 34) or contribute toit. The mesenchyme reaction must therefore beadded to the consequences of O 2 deficiency inthe organism which often intrude deep intohuman life, as it instigates the process ofarteriosclerosis, which has serious consequences,and, according to speculative ideas, thereaction co ld also be involved in the emergenceof ~lterations in the lung function parametersafter noxae and physical exertion, or02MT in the framework of the cellular vesselwall switching mechanism (swelling of the capillaryendothelial cells in O 2 deficiency, Fig. 2).The reactivity of the cells included under thenotion of me enchyme cells (e.g. endothelialcelis of the vascular intima, fibroblasts, fibrocyte, pericytes, smooth mu de cell of thva cular m dia etc.) exceed that of all oth r. cells of our organism in many respects.factors compiled in Table 11 lead to the amprocess, i. e. the mesenchyme reaction. In thaorta wall, as example Fig. 113 shows t'reaction can proceed within approximatel90 min after the impact of a strong sclerogenousnoxa. In the endothelial cells of thcapillaries (smaller volume involved) threaction rate should be near to 10 min ac ortiingto our findings with the 15 min O 2quick procedure. The incorporation of thmesenchyme, e.g. into the aorta wall i folIo ed by the incorporation of lipid but onl afa delay of approximately 6 h. The t nt. the triggered incorporation of the me n h minto the vessel wall, and the quantit f thinitially gradually gath ring d p iti n pr·ducts, depend on the tr ngth and durati nthe cl rogenou irritation. Thu th d r·mine wh th r or not th urring h n intructur hould b d m d a path 1Th tm tural hang in th 1 11 u u 11r gr aft r th 1 r nou influ nfad d away (r v ibl ph' . If howl~ve
of clerogenou noxae. 1 Di turbing factors which, according to W.H. Hauss, regularly trigger thenchyme reaction (172), detected by the increased rate of 3SS-sulfate incorporation into the sulfo-lPOly accharide of the ground substance of connective tissue in various organs (animal experiments)I of oxygen 2h pOtensiony rtension (Fig. 39)rationsinsi factionsnicotineforeign proteinallergic reactionso foreign substancesover4xertion2 mechanical stress13 interbrein stimulationemotional stimuli6 noise6 hormones17 influences of dietDisturbing factorshypobaric chamber with P0 2values < 150 mmHgblood pressure amplitude too low (e.g. < 25 mmHg)reduced kidney circulation; hypertension (systol. blood pressure> 200 mmHg)anesthesia etc.endotoxins, staphylococcus toxin, diphtheria toxinpasteurella multocida, staphylococciinhalation of cigarette smokealbumin injectionserum shock, Arthus' phenomenoncroton oil, plastic productsexcessive movement in the treadmilllaceration of muscle, dilatation of the aortathalamus stimulation by means of electric.currentbinding, restricted movementroaring, uniform random noiseadrenaline, testosterone, thyroxine, cortisone, glucagonsclerogenous diets1 Most of these noxae deteriorate the oxygen status2 Subnormal values of Po or '11; locally reduced 02 delivery to the vessel wall; mechanical irritation at ramificationsin the arterial systir:t rtsclerogenous irritation or O 2 deficiency lastsfor a long time (reduced clearance capacity dueto energy deficiency) and particularly if suchong-lasting conditions frequently recur, thenthe non-decomposable deposition productsfrom the metabolism (collagen fibre bundles,calcification etc.) accumulate in the way shownby the electron micrographs in [I 72]. Thedamage to the vessel wall caused by thesebreakdown products no longer recedes (irreversiblephase), as the increase of the diffusionength in both directions of the vessel wallradial, central) begins definitively to limit theetabolism there. A final stabilization of theypertrophic structure thus oc~urs. We ther~forebelieve that the pathologIcal changes Intructure of the vessel wall remain reversible fora long time. The important th~ng is. that thearteriosclerosis be combatted In thIS phase,fore the irreversible wall degeneration finallyes place. We have already seen [2, 8, 106]e reversal of the sclerogenous noxa "oxygenficiency" as a method of renormalization of'he velieI wall structure in the reversible phase,the 02MT in a highly intensive variant. ted to the part of the body in question.ct f ting discussed in Paragraph 5.3.9Ie 42) hould al 0 be mentioned as aIUf'tl'llfll!r method for the renormalization oftt8Jiosci rotically degenerated wall of arterieand arterioles, and of degenerated layers of thealveocapillary system of the lung.According to [172] the pathological changes inthe vessel wall structure caused by the nonspecificmesenchyme reaction affect mainlarterial vessels and their ramifications. Despitethis, this reaction could always re ult in adeterioration of the O 2 supply to the ti sue viacapillaries, above a certain intensity. Thideterioration should result from the reductionof the blood flow (cross-section narrowingreduction in vasomotoric adaptability and inthe air chamber effect) in sclerotically degeneratedarteries.A related reaction in the fine blood capillariecauses the vessel wall thickening di cos ed in1.1.1, and thereby a narrowing of the lumenand even a direct hampering of oxygen and ubstratediffusion to the intercapillar pa . Thbasal membrane thickening of the capillori sdue to protein depo its i a w ll-kno n ph nomenonin diabetic (mi ro)angi pathi andkidney di ea e. Th me pro an Ioccur in th m mbran f th m lin h(Paragraph 1.4.11) and th n I d t th n ur pathie of th diab ti . In nn ti nih hiwe hould mention that th patho ni b Imembran thi k nin n b br n dtri t fa ting ( nd I
BIncorporation ofJ5s-slI"ate intofhe sU/Ftll1NItfIptllysotrhorldeso( the Dorta wollos flitprimorymtfobolit: tvtnfC!!I!i!!..cona:nlrationiloa-taNOll1It-e..~ ~ .tJ
ntlu Ion to the damage to neighbouringr foreign cells, a 000 a the enzyme reachth extracellular space a a result of autoytolyi or exocyto is. Because of the pHdependence of the activity of the decisivenzy~e, this contribution is particularlygr at In over-acidified tissue [2, 141];Dige tion of foreign substances, which aretaken up by the cell by endocytosis, in thesecondary lysosomes, which are formed bythe fusion of primary lysosomes with theforeign substance entrapped in intracellularvacuoles;4. Digestion of the cell's own waste products inthe secondary lysosomes.Functions 1 and 2 are of particular interest inthe framework of the theme of this book. It isodd that very little space has hitherto beenaccorded to these two functions in the greatlyexpanding lysosome literature [195].The lysosome content of the cells and thespectrum of the enzymes contained in the ly 0somes vary greatly according to ce)) type [196].But even for a given cell type, the mean lysosomecontent is not a constant value but, as thefollowing comparison shows, a value which candepend on the situation of the cell in the intercapillaryspace: it is known that heart musclecells in the healthy myocardium contain few orno lysosomes. The electron micrograph, in Fig.114, of a healthy, well-supplied heart muscleshould be looked at here [81]. There is a veryhigh lysosome content in the myocardiac cellsof the hypertrophic heart muscle, however.The electron micrograph in Fig. 115 provesthis, as it shows a very high density of lysosomes(197]. From the theory of substrate diffusionin the intercapillary space of the myocardium[198] it follows for the case of thehypertrophic heart muscl~ that the P02 level. sinks to values below 10 mmHg (1.3 kPa) at1pmJ-........----t~MIg.114 Electron micrograph of a tissue sample .of healthy, vve~l~uPPlied myocardiu~; n~xt to .the muscle fibers,inS of mitochondria (as also in Fig. 115); no I~gns of 02 deficiency, no Iysosomes In thl section
~LFig. 115 Electron micrograph of hypertrophic myocardium; O 2 deficiency in parts of the intercapillary space,high density of Iysosomes L in this specimen [197]the site of the greatest capillary distances. TheO 2 metabolism of the myocardiac cells isthereby unsaturated (supply deficiency), andthere finally follows the sudden change of themetabolism of the myocardiac cells to fermentation(lactic acid formation) at P02 ~ 3.5mmHg (0.46 kPa). The spontaneous lysosomeformation evidently begins as soon as the cell isonly deficiently supplied with 02, and gl _colysis looms [199]. Thi should be een aprocess occurring in the living organi m hi hdeserve great attention due to it pr babIuniver al character.By Iy 0 ome formation and b thchange to ferm ntation m tab Ii mstrong pH reduction a a r uIt, aturudd nithm
dislloblti(Jln (dige tion)ma,terial. ........... a becomed ration of 02drawn intocf. ig. 109) then,~lJralrall~h 1.4.5, he red ction canreach level near pH = 6.0 63, at which hemembrane of the ly 0 orne b come permeable,the ly 0 omal enzyme are relea ed, andat which, furthermore, a trong acti ation ofthe pH dependent enzyme occur. he finalstage is the dissoluti()n of the ce necro is .Irna cytolysi and cytolytic chain reactionautocytolysis. The death of cells isn d to several as yet unsolved problems.o currence of cell death can be defined ast' epoint at which the outer cell membrane, .. g the intracellular space becomes irre'b y permeable and the cell interior therebyomes stainable (e.g, trypan blue test [2].e activity of the hydrolytic enzymes existing, a single cell (and stored there initially in theomes) is usually enough, after intracellulare e and a certain reaction time in O 2 defi-'ency, to damage the outer cell membraneirreversibly, even at almost neutral cellular pH,,e. to kill the cell. Autocytolysis does notOCCUl, however, as experiments show, if theouter noxae (e.g. extreme O 2 deficiency, overacidification,hyperthermia) cease soon aftere intracellular release of enzymes, as is shownin Fig, 116, left. In such a case, the releasedysosomal enzymes are evidently quickly re-entrapped in newly-formed lyso omes. Such acompartmentalization demands energy, henceoxygen, for thermodynamic reasons. Th ,inthis aspect, too, O 2 deficiency should stronglypromote autocytolysis. The site where celldecline occurs mainly as a result of auto.cytolysis can be considered to be the lethalcomer" at the venous end of the intercapillaryspace. We understand this, for example, for theelementary process of the ageing organism'sadaption to the drop in the 02 supply capaciin older age.Lysosomal cytolytic chain reaction. e dermethe lysosomal cytolytic chain reaction [2] as amechanism of cell damage, by hich I so omalenzymes entering the extracellular space from adying cell contribute to the death of neighboringcells. The extracellular appearance of theenzymes only occurs (Fig. 116) after a certaint•% A" - ........9tJ\• I1rI...... .,'J ~~1,,'·A~~14· tJHI/I1H§ f--'JIJ~/l......o-'~pH. 6.3'---2D ~"'"' T -31°'10"- J,.•1-0', I I I'IIZJ3DIA5060708090fJOWJ12O 13D UO 50 1fIJ 11rJ • .,n·t -"V/l.oo"'""",.lfF61 ~~~ V 11IJfJf.'fIi*al3!1J• ~..1 "'~' -.dIJ? [17 Ce#u·s·"..gmr'V(z • 5·f(J-JI--flO'Yo90tIJ~60solI"'13D201)o8JOofly onnllenzYn11Sof p = ,0 i xtnlDOf n If • _en(jl8nt
12111098V ~ .-"~"' .....b""", ".1TtrJrmol pH1I acidp?osphaloses (pota/oes)II P-fiucuronirint (oorine liver)1:AApll# 43., ~\,"r\'. -''',\~~1\ ,~215 24 6 8~6 2 4 6 8 7 2 4 6pt------8 8Fig. 117 Increasing activity of two Ivsosomalenzymes (examples) at T =37°Cin the transition from normal pH inhealthy tissue to the mean pH of tissuewith severe O 2 deficiency [141 )time span (autocytolysis time, e.g. 120 min).The cytolytic chain reaction is thus a slowprocess lasting many hours (e.g. 4-23 h, accordingto number of reaction steps and conditions).In connection with this we should thinkof the acute phase of the myocardiac infarction[200], which occurs in roughly'such time spans,for which we assume a lysosomal cytolyticchain reaction [2, 144, 171].The cell-damaging chain reaction can only reachgreat intensity in highly overacidified tissue,and even there remains in its "subcritical"range, i. e. it will only have effect-strengtheningproperties. That a cytolytic chain reaction mustoccur in highly overacidified tissue can be seenfrom the pH activation of the lysosomesalready described in [201], and just as clearlyfrom the typical courses of the pH/activitycurves of lysosomal hydrolases shown in Fig.117. The activity of such enzymes increasesnearly tenfold between the normal pH of thetissue and a pH level ~ 6.0. A severely damagingeffect on the adjacent cells must result inthe acidic milieu of such enzymes reaching theextracellular space.Added to this is the fact that the drainage ofthese enzymes is made much more difficult bythe inhibited microcirculation which prevailsin severely overacidified tissue. This must leadto an increased concentration of lysosomalenzymes in the intercapillary spa~e, and ~hus toa further strengthening of the cham reachon.The stop in O 2 supply when death occurs canbe regarded as a border case of ~2 defi~iency,both as regards its intensity and Its ~pat~al e.xtenion. As suggested in the presentatIOn m FIg.118, lysosomal cytolysis and cytolytic. chain. .living organism, in order to initiate its generaldisintegration immediately after death [202].The lysosomal cytolytic chain reaction has beenthe object of several investigations carried outsince 1965, which are summarized comprehensivelyin [2, 141, 171]. In a series of in vitroand in vivo experiments, experimental indicesfor the in vivo existence of the cytolytic chainreaction in highly overacidified tissue werefound:1. Damage of cancer cells by addition of cylysedcells [203];"2. Damage of cancer cells by isolated lysosomesor lysosomal enzymes [204];3. Release of lysosomal enzymes in and fromcancer cells at pH = 6.2 and 40°C hyperthermia[205, 206];4. pH-dependent strengthening of cell damagein the human skin [207];5. Considerable increase of cell damage by afactor of 20 in a cell uspension with increasingcell den ity; fa t ad orption ofextracellular indicator enzyme to urroundingcells [208].An expansion of lysosomal cytolysis to a cytolyticchain reaction must always be expectedin deficient O 2 supply in tissue, when th re is amarked drop in the tissue pH, i. e. accordin toFig. 109, when the tissue area affect d b 0deficiency has a volume of V 10-100 mmor more (exampl : myocardial infar tion inflammation).The chain rea tion pr d up tthe geometrical limit of th ov ra idifi ati nand th rca wh n it r ache uffi intiuppli d ti u parti ularl h n it r a hI r I v I
pH
,,,;tt cola;, ofH1e 88JIJitKIJIIl " toe.4J117, -~7 I\., ,5 1\4\3 I\.z "-,pH"6 " ""-, , 10........~7, ~ sItidJ/iI....~ to-- -r-pl/-5543zheart ktpenCJ:, r- 384 450 H 435 - I- 480 - llgemino/ rlrJH1m fl5mitr'- 051 I I , • I , -, I Io 1 2 3 4 5 6 7 8 9 10 11 12 13 14 15 16 17 18 19 20 21 22 23".,t ..Fig. 119 pH registration in the cerebral cortex of a rat under ~vere hyperglycemia ending in irrewrsible hyper-.glycemic coma. At very high blood glucose concentrations, ether anesthesia contributes to labilization and brea through of the blood-brain barrierhave a considerable aerobic glycolysis, whichleads in vivo in the nerve fibres to a pH of approximately6.8-7 (unexcited state) [215).The known experiences with diabetics having a .temporarily severely increased blood glucoseconcentration suggest that, for the peripheralnerves too, the glucose concentration must leveloff to a constant value largely independent ofthe blood glucose concentration. The existenceof a blood-nerve barrier (BNB) [210] whichlimits the passage of glucose can be seen experimentallyin that no nerve pains are observed insuch cases. This observation means that, dueto the high sensitivity of the nerves to overacidification[32], no significant reduction ofthe neural pH occurs.ew results of electron microscopic tissueresearch show that the structure of the B B ismainly represented either by a multi-layeredcover of the nerve fibres (myelin sheath of elarger fibres) or by an oligo-layered coat onplasma membrane of the Schwann cells. Thstructures can be clearly seen on the elec romicrograph in Fig. 120 from (81).In connection with this we should refer tooutdated formulation [32 p. 5] on the ign. cance of the myelin sheaths or glia cells: I .unclear whether the glia cells play a role in hmetabolism of neurons. The knowledge of thexistence of the B B should lead to neaspects in the explanation and therap 0various complaints and disease of the peripheralnervous system (action of ertain netoxins, atrophy of the m elin heath dia e .neuropathie with welling of the basal membranes,partial pare e multiple lero .neuralgia etc.).
smol/tr~ftm_~7"r fslON(fJIltfudiJn)BG--connedivt fissllamorphous" bosol-mnlJt1R. (lJorttr toconntdivt• tissue)Fig. 120 The blood-nerve barrier (BNB) in the electron microscopic picture 1 . The discovered BNB [210] limits thetraverse of glucose to the peripheral nerves and causes the amount to be virtually independent of the glucose concentrationin the blood circulation. In this way the BNB keeps the proportion of aerobic glycolysis of the nervecells constant, and at a level that leads to a pH value that is somewhat lower than in normal tissue, and is necessaryfor the nerve function (pH::::: 6.8; unexcited condition). The wrapping of the nerve fibres therefore in no way servesisolation alone1 Object: skin of laboratory mouse1.4.11 Pain and blood-nerve barrierThe extreme overacidification of the nerves occurringafter injury to the BND (multipliedgluco e offer to the nerve cell with normallyonly a 9 % glycolysi contribution to.metabolim' reduction of the pH from approXimately7.0-6.0) can be seen as representing the maincontribution to the primary process in the trigringof pain stimuli. It follow from thi thattrength of sensation of pain and the levelof glucose concentration in th blood circulationcorrelate with each other. a kn nperimental ob r ati n in diab ti .It ean be eon Iud d from th imil rit f thglueo off r through th bl od ir ulati n ndfrom th id ntit f th m t b li h i r fth e 11 f th p riph ral n rv t m nd fthe brain 11 that a pH ur imil r t th t
"-1r-180 I'\112007(J)Jr' '- jwry¥Iyears,Ir-- age 75senile diabetes,~. )Udietetic confrril• •eased pain'20bmJHfrJjt f- dJillN coHte incr1~rsomesweds /rsemifiv. dy/tJW-II I~A / \t' "" "~--~.to,"",)"/' .......-,,' ogt'25"tJG 8, ~' " '...~\80".''-.-" .....l1ea60 ~-- __"EfX'OX ~wesf_ confrollabl!..JlluCQs.! --- ------ --- -,4020increasil!:i!TJ1./2!11!16 8 10 12 14 16 18 20 22 24 2 4 6timtddoy ..Fig. 121 Correlation between pain and blood glucose concentration. Typical course of blood glucose concentrationin the 24-hour cycle of a senile diabetic (AI and a healthy person (Blin Fig. 119 occurs when the BNB is breached.The overacidification of the nerve fibres thenleads to the strong sensation of pain. In this itis, in principle, of little importance whether thedamage to the myelin sheath occurs by injuries,by mechanical pressure, by the unrestrainedgrowth of a tumor, or by some other means.Depending on the momentary blood glucoselevel and the extent of the injury, the damageleads to an increased traversing of glucose tothe nerve fiber (this increase is sometimes more,sometimes less, but always great), and therebyto the pH reduction and triggering of pain.When the damage is very extensive (e.g. cancerin its advanced stage, burns etc.), very great pHreductions are to be expected, and particularlysevere pain does indeed occur.It is well known that the blood glucose concentrationfluctuates considerably in the 24-hcycle. The typical courses of these fluctuationswhen the food intake is spread over 4 meals areshown in Fig. 121. Particularly strong fluctuationsoccur in diabetics (solid line). Accordingto the discussed ideas about generation of painevery type should exhibit a corresponding circadianprofile with highs and lows. We questionednumerous patients with chronic pain. The re ult(Fig. 121, above) confirms in accordance withour hypothesis, that pain sensation is al 0 ubjectto very great fluctuation in the cir adiancycle and that, in good approximation the painmaxima and minima corre pond to the bloodglucose profile. Because of the drop in glu 0concentration in the nerve ti ue a a re ult ofthe occurring fermentation, a not in on iderabledrop in concentration to th bl od ir ulationmust be assumed for the pain-free ondition,in the case of damage of th B B tWe estimate that, for moderat B B injuri .a blood glucose concentration ofapproximat I40-60.10- 5 gil for freedom of pain mu t ballowed for. Further re earch hould b und Ttaken for th accurate quantitativ d t rminationof thi blood gluco thr h Id I 1freedom from pain and it ariati n, d p nd nton th t nt of th .B B damag, 1 1 hi h
61w:o.seII6W tissutconantmltOn-i1:blood1O-/gI-117016015011,()RemarKS1~glv.r:: ' .... '20~IlYma/ /_K!.{j.,..!}% ~nlalianpH-ii!}(napain)1~:: ]'00 normo/90 increasing poin80 IUGluslight fJ!J1il70 I60 ..pain thresholdI!nopaintfangerofsliJcIr!painIPlief by opproochirytl7eb/oaiglucose leve/topaifl tl1resholdcnrpnic polyarlhnfis/Kl/fl !KJj tfisopfll'aredFig. 122 Relief of physical pain by approachingthe blood glucose level to theobserved "pain threshold"i of uch importance for pain theory. To supportour estimation we include a finding ofCa per (Deutsches Zentrum flir SauerstoffMehr chritt-Therapie, Bad Fussing, FRG), onthe complete disappearance ofvery severe polyarthriticpains when the blood glucose level wasreduced to 60· ]0 -5 gil.The above considerations lead to a basic recognitionof the combat of physical pain byreducing the blood glucose: the pain does notdi 'appear only when a zero blood glucose leveli reached, which could never be attained dueto the known reasons of hypoglycemic shock,but much sooner, by reduction to levels ofaround 40-60·] 0- 5 gil. Thus there exists apain threshold of blood glucose concentration.The finding of the pain thre hold means thatwe must try to come as close as pas ible to thisthre hold in the combat of pain, by mean ofthe manipulated (and monitored!) reductionan the blood gluco e. Since this threshold existsand, furthermore at glucose levels which aretill more or Ie. tolerable, it seems that ourpath to the combat of pain can be practicallytrodden. The overview in Fig. 122the above findings.ummanzeThe further guidelines which follow re uIt fromour ideas on the combat of chronic pain: onprinciple, the aim of all measures mu t be toreduce the blood glucose to a level which is aslow and as undeviating as possible. The eatingof sweets must be cut to a minimum. In orderto reduce the deviation (Fig. 121) we recommendthat the normal rule for diabeti bestrictly observed, such a adherence to the dietregulations to keep the blood gluco e at a lowlevel, and the distributions of food intake overa larger number ofmeals.It is to be expected from the nergeti nsideration at the beginning of thi paragraphthat a longer ]a. ting O2 utilizati n defi it in tharea of BBB and B B ha parti ularl . rpathological can qu nee and that. in r Ithe measure f th 02MT an al h lp ignificantlyin the. fi Id . H w v r, m r thanp ctation and motivat d hop hould n ten in th word, as m di al r . aT h h rtill in it arl infan .