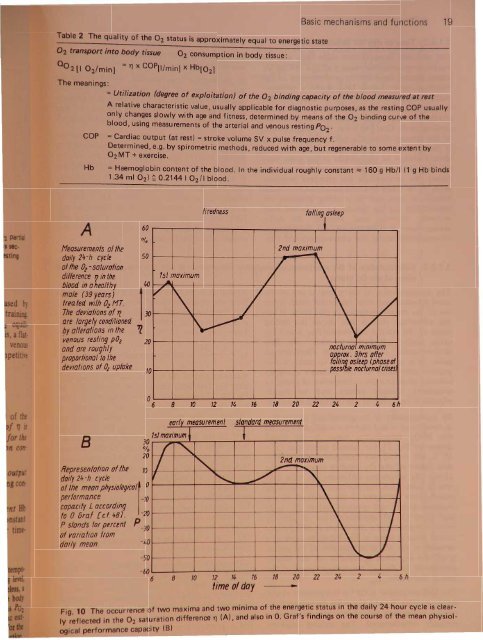
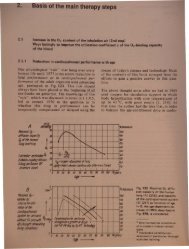
Table 2 The quality of the 02 status is approximately equal to energetic state02 transport into body tissue 02 consumption in body tissue:00 2 [I 02/min ] = 11 x COP[llminl x Hb[021The meanings:Basic mechanisms and functions 19=Utilization (degree of exploitation) of the 02 binding capacity of the blood measured at restA relative characteristic value, usually applicable for diagnostic purposes, as the resting COP usuallyonly changes slowly with age and fitness, determined by means of the 02 binding curve of theblood, using measurements of the arterial and venous resting P02'COP =Cardiac output (at rest) =stroke volume SV x pulse frequency f.Determined, e.g. by spirometric methods, reduced with age, but regenerable to some extent by02MT + exercise.Hb= Haemoglobin content of the blood. In the individual roughly constant ~ 160 g Hb/I (1 g Hb binds1.34 ml O2) ~ 0.2144 I 02/1 blood.A60Measurements of thedoily 2+-h cycle 50of the 02 -saturationdifference Vin theblood in aheallhymole (39 years)frea ted with O 2 Hr.The deYiafions of'lare largely cond/1ionedby alterations in the '1venous resting pOz 20and are roughlyproportional to thedeyiations of 0/ up/oke10/1st maximum....tirednessIfalling asleep.~-I2nd maximum/1\J ,1\VJ 1\ /i'v ~~ I \Vnoclurno minimumap~rox. 3hrs afterfa li~asleep (phose of- poss 't nocturnalcnmJo 681012 141618 20 22 24I2I4 6hB30%20Representation of the 70doily 24-h cycleof the mean PhySiOIOgiCal1 0performance -70capacity L accordingto 0. Bra! [el 481. -20P stands for percent P-30of yoria/ion fromdoily mean.-50earN I measuremenf san f dar, d meosurement1sfmaximum ~lI "- I -2nd maximum/ f'.I-- ,"- ...V\\~J~ I\ I\ 1/-60681012 14 16time of day18 20 22 2426h. and two minima of the energetic status in the daily 24 hour cycle is clear-Fig. 10 The occurrence of t~o md~;;::nce '1"1 (A) and also in O. Graf's findings on the course of the mean physiol-Iy reflected in the 02 saturation I r " ,ogical performance capacity (B)
y r na onabS,olu'te clla.ra~t ri tic value Q0 2 and thereillti"e r t t value '11 of the resting O 2ignificantly in the course of theCU'lcadian cy 1 . Figure 10 A shows a measure~~~~lln eJtamlP:l of 11 for this. In Fig. 10 B ourme:asluement i compared with the circadianm of the mean disposition to work ac·n to O. Graf [48]. For the establish~enttherapy effect, the resting Q0 2or resting'11 me ur ments before and after treatmentould always be undertaken at the same timey (and under the same external condiion). We recommend the standard measurementto be taken at 15.00 hours (14.00-16.00hours), at rest and in a sitting position reprentative for the approximate minimal ievelbetween morning and evening. An earlymeasurement at 9.30 hours (7.00-9.30 hours),accomplished under the above-mentioned conditions,seems to be representa ive for e ma mal level between morning and eve . g.If the unique opportunities, which lie in edetermination of the resting O 2 tat fordiagnostic purposes, are to be used, it i particularlyimportant to standardize the time of dayfor the determination (e.g. 14.00-16.00 hours).The deep minimum of the O 2 status approximately3 h after falling asleep is noteworthy inFig. 10. It is the time point at which circulatorydisorders, cardiac arrest, myocardiac infarctionin risk patients occur with greater frequency.The low level of this nightly minimum canusually be somewhat countered by a cup ofstrong coffee immediately before falling asleep[49], and strongly countered by a lasting improvementin the O 2 status with the aid of theoxygen multistep therapy.·1.5.3 Determination of the arteriovenous saturation difference 11 at rest as a relative characteristicvalue of the O 2 statusThe determination of the 11 level is one of themost frequent and most important tasks in theuse of the results compiled in this book. It hasthe advantage that it also shows the restinglevels of the arterial and venous P02' which areoften highly meaningful on their own. Thedetermination of the relative characteristicvalue 11 is usually sufficient to make a diagnosticassessment of the patient's energeticreserves, to record the consequence of stress, todocument therapy results and to decidewhether a repetition of the therapy is necessary.By measurement of the arterial and venous P0 2in conditions of rest, the two working points onthe Hb0 2 dissociation curve of the bloodown in Fig. 11 for normal conditions (T =37°C, pH = 7.4), are determined. The utilizationfactor of the O 2 binding capacity of theblood (0 2 saturation difference) in each casecan be seen from the position of the workingpo·nt. ive examples of the positions of theor ing points and l1-values before (0, I, 2)a dafter (3, 4) implementation of the O2ult" tep procedures are shown in this presena·on. elp is given in Fig. 12 in the form of anomogram for the determination of the factor'11 of the 02 binding capacity of the blood,del)endelu 0 P0 2 - art for various level of thed nt I Po 2 -ven.. C 0 put ( 0 ) i the product of thestrc)ke v I V. n th pul frequency f. Inro volum remainunjintl.uelrlced. h naturel counter-vir:tnJllllyregulation in l1-changes almost exclusively takesthe form of adaptation of the pulse frequency.It is therefore usually sufficient for the stricterassessment of the relative O 2 transportation, toknow the value of the relative pulse changef + ~fkf = f in the corresponding change of 11.Measurements of the l1/pulse counter-regulationafter O 2 multistep therapy are summarized inFig. 13. The measured relative drop in the pulseonly reaches a level of kf = 0.91, even after atripling of the l1-value. The 11.value thereforelargely determines the volume of the O 2 transportto the body tissue under normal conditions.With this approximation, further discussionmay be limited, as a rule, to the considerationof the 11 value and its dynamics. Only inconditions of weakness with very (too) lowl1-values « 15 %) is it necessary to take intoaccount the fact that the organism then reactsfor a limited time with a significant increase inthe cardiac output (increase in pulse frequen )in order to ensure a level of O 2 transportationQ0 2 that is just adequate. Examples of thi arcases 8 and 10 shown in Fig. 1S.Although the method and technique of d terminingthe arterial and venou Po ar dicued in depth later in th boo it mnece sary to m ntion at thi t g th hith rtoapparent prin ipl diffi ulti . Th uffi i ntlaccur t m ur m nt of th r ti ~ itoday probl m fr u ually m d fr m
- Page 1 and 2: sand functl ni ove d cellular capil
- Page 3: 8 1. Physiological fou~dationsmmHga
- Page 6 and 7: Basic mechanisms and functions 11e
- Page 8 and 9: Basic mechanisms and functions 13pr
- Page 11 and 12: 500r-T_-+5__r-_-+1O__,....-_~15.1O-
- Page 13: ~IUI1!J ~atpWorMs---~~·tIIlDkeJ \I
- Page 17 and 18: 100907065"I 4y iological foundation
- Page 19 and 20: 1. hy lologlcal foundations70"''''J
- Page 21 and 22: CII'Cli8LC outl)ut VAr;lllil i e re
- Page 23 and 24: -'0 y 101091cai oundatlons80%6050l~
- Page 25 and 26: ,..._........,.--~"'!""!!'!~~----_.
- Page 27 and 28: hi v d in h arrangement shown above
- Page 29 and 30: 34 1. Physiological foundations70%6
- Page 31 and 32: logical foundationsu .on in the opt
- Page 33 and 34: 1. Physiological foundations. ~ la~
- Page 35 and 36: II foundationsI tem IBPtrsons with
- Page 37: 1. Physiological foundationsAirdosi
- Page 40 and 41: 110N.ttJJOt~1. Physiological founda
- Page 42 and 43: 1. Phy iological foundationsAnoO;HT
- Page 44 and 45: hysiological foundations...fJJHT(JI
- Page 46 and 47: 1. Physiological foundationsCOCOM I
- Page 48 and 49: g r d, whi h con iderably contribut
- Page 50 and 51: logical foundations13IrPtz12.......
- Page 52 and 53: ,. Physiological foundationsIf-RoN
- Page 54 and 55: 1. Physiological foundationsAll"i1t
- Page 56 and 57: ~~itItINitIIJq/s N 31 54 52~IBIP~-.
- Page 58 and 59: BDuring OzMTprocedurecAfter OzMTpro
- Page 60 and 61: A Bi3lrfss 1'1oafofmovement 8 0pl'r
- Page 62 and 63: Table 6 PO b measurements of unsele
- Page 64 and 65:
serert~ hyperoxia pure 0 } .distres
- Page 66 and 67:
IIstress qirI/iII mn wryhJI1IJSISLo
- Page 68 and 69:
A/JtfJtnk«P~1Mtrr'ttriIWIItJfIS~.~
- Page 70 and 71:
Table 7 The change in the architect
- Page 72 and 73:
nsMslor rotd'1uI.-Jl!Jg1"/11(J(Jrfr
- Page 74 and 75:
IonsFig. 74 Histological pictures s
- Page 76 and 77:
IonseM' Selecfofherm equipment-_s1S
- Page 78 and 79:
.....-------................',..,-n
- Page 80 and 81:
eM/rot gro"/!.Histologicallyconfirm
- Page 82 and 83:
A1er tnit,almonipulotionsand III«l
- Page 84 and 85:
Q'CSlNltftning1A. QfQ/-fJlf1inguQ
- Page 86 and 87:
otllm'lv.2 h th ju tifi d pro p ct
- Page 88 and 89:
t48xlD J WsEhmmahooofMe ~crdieal, c
- Page 90 and 91:
old°z-/ImitMW mode of calcu/aflonC
- Page 92 and 93:
he cylindr'cal area upplied by the'
- Page 94 and 95:
Tn-T-~-----1~--~--~JaluralttJtranSi
- Page 96 and 97:
aPI)Ii:lcati?n with a patially very
- Page 98 and 99:
are triggered. At the same site, ho
- Page 100 and 101:
n respired again, the drop in respi
- Page 102 and 103:
Exholationtubeloop aroundcmebroncll
- Page 104 and 105:
[Xeftt of,t"". Respiratorv... stand
- Page 106 and 107:
ventieFig. 112 pH decrease between
- Page 108 and 109:
BIncorporation ofJ5s-slI"ate intofh
- Page 110 and 111:
~LFig. 115 Electron micrograph of h
- Page 112 and 113:
12111098V ~ .-"~"' .....b""", ".1Tt
- Page 114 and 115:
,,,;tt cola;, ofH1e 88JIJitKIJIIl "
- Page 116 and 117:
"-1r-180 I'\112007(J)Jr' '- jwry¥I