1.2 Purpose of this waste assessment - Waikato District Council
1.2 Purpose of this waste assessment - Waikato District Council
1.2 Purpose of this waste assessment - Waikato District Council
- No tags were found...

Create successful ePaper yourself
Turn your PDF publications into a flip-book with our unique Google optimized e-Paper software.
2011<strong>Waikato</strong> <strong>District</strong> <strong>Council</strong>WASTEASSESSMENT
Prepared by Waste Not Consulting Ltd and Eunomia Research & Consulting Ltd in 2011.
Contents1.0 Introduction 61.1 Legislative context 6<strong>1.2</strong> <strong>Purpose</strong> <strong>of</strong> <strong>this</strong> <strong>waste</strong> <strong>assessment</strong> 61.3 Scope 61.3.1 General 61.3.2 Consideration <strong>of</strong> solid, liquid and gaseous <strong>waste</strong>s 71.3.3 Public health issues 71.3.4 Health Act 1956 71.3.5 The Hazardous Substances and New Organisms Act 1996 (the HSNO Act) 81.3.6 Resource Management Act (1991) (RMA) 81.3.7 Key <strong>waste</strong> management public health issues 81.3.8 Management <strong>of</strong> public health issues 81.4 <strong>Waikato</strong> district 91.5 Summary <strong>of</strong> <strong>waste</strong> management in the district 111.6 Available documentation 112.0 Waste infrastructure 122.1 Residual <strong>waste</strong> disposal 122.1.1 Landfill disposal facilities 122.<strong>1.2</strong> Closed landfills 132.1.3 Cleanfills 132.1.4 Assessment <strong>of</strong> residual <strong>waste</strong> disposal infrastructure 152.2 Transfer stations and recycling depots 162.2.1 Raglan Xtreme Waste recycling depot 172.2.2 Assessment <strong>of</strong> transfer station infrastructure and operation 172.3 Recycling and reprocessing facilities 172.3.1 Assessment <strong>of</strong> recycling and reprocessing facilities 183.0 Waste management in <strong>Waikato</strong> district 193.1 <strong>Council</strong>-contracted services 193.1.1 Funding 193.<strong>1.2</strong> Services 203.1.3 Kerbside collections 213.1.4 Other council services 22<strong>Waikato</strong> <strong>District</strong> <strong>Council</strong> <strong>waste</strong> <strong>assessment</strong> 20111
3.1.5 Assessment <strong>of</strong> council services 223.2 Non-council services 223.2.1 Assessment <strong>of</strong> non-council services 223.3 Solid <strong>waste</strong> bylaw 223.3.1 Assessment <strong>of</strong> solid <strong>waste</strong> bylaw 233.4 Waste education and minimisation programmes 234.0 Waste within <strong>Waikato</strong> district 244.1 Introduction 244.2 Waste flows in <strong>Waikato</strong> district 244.2.1 Landfilled <strong>waste</strong> quantities for <strong>Waikato</strong> district 254.2.2 Diverted materials quantities for <strong>Waikato</strong> district 264.2.3 Waste composition in <strong>Waikato</strong> district 274.3 Comparisons with other districts 284.3.1 <strong>Council</strong> market share <strong>of</strong> kerbside refuse services 284.3.2 Kerbside refuse as a proportion <strong>of</strong> <strong>waste</strong> to landfill 284.3.3 Per capita <strong>waste</strong> to landfill 294.3.4 Per capita diverted materials 294.3.5 Comparisons with other districts – <strong>waste</strong> to landfill 304.4 Methodology for estimating <strong>waste</strong> tonnages and composition 314.4.1 Kerbside refuse collections 314.5 Kerbside recycling collections 334.6 Service user feedback 344.7 Summary and conclusions 344.7.1 Potential for further diversion 345.0 Waste flows in and out <strong>of</strong> <strong>Waikato</strong> district 356.0 Future demand and gap analysis 376.1 Future demand 376.1.1 Demographic factors 376.<strong>1.2</strong> Commercial activity 386.1.3 Innovative community <strong>waste</strong> management 396.2 Future demand – gap analysis 396.2.1 Data and monitoring 396.2.2 Regulation 396.2.3 Waste streams 396.2.4 Charging mechanisms 402
6.2.5 Economic development 406.2.6 Rural <strong>waste</strong> sources 406.2.7 Communication and education 417.0 Statement <strong>of</strong> options 427.1 Addressing demand 427.1.1 Data and monitoring 427.<strong>1.2</strong> Regulation 427.1.3 Waste streams 427.1.4 Charging mechanisms 437.1.5 Economic development 437.1.6 Rural <strong>waste</strong> sources 437.1.7 Communication and education 437.2 Other <strong>waste</strong> management and minimisation issues 447.2.1 Collection services 447.2.2 Recovery and treatment services and facilities 447.2.3 Hazardous and special <strong>waste</strong>s 447.2.4 Disposal 447.2.5 Producer responsibility 448.0 Statement <strong>of</strong> the council’s intended role 458.1 Statutory obligations 458.2 Overall strategic direction and role 459.0 Statement <strong>of</strong> proposals 479.1 Communication, education and consultation 479.1.1 Community partnerships 479.<strong>1.2</strong> Communication and consultation 479.1.3 Education 479.1.4 Regional partnerships 479.2 Taking direct action, fostering new ideas 479.2.1 Waste Management Sector Working Group 479.3 Changing the rules, monitoring and feedback 479.3.1 Waste bylaw 479.3.2 Review <strong>waste</strong> charges 479.3.3 Enforcement 489.3.4 Solid <strong>waste</strong> analysis surveys 489.3.5 Monitor <strong>waste</strong> flows 48<strong>Waikato</strong> <strong>District</strong> <strong>Council</strong> <strong>waste</strong> <strong>assessment</strong> 20113
9.4 Recyclable commodities 489.4.1 Maintain/expand kerbside collection 489.4.2 Commercial recycling collection 489.4.3 Drop-<strong>of</strong>f facilities 489.4.4 RTS facilities 489.4.5 Transport 499.5 Food and garden <strong>waste</strong> 499.5.1 Food <strong>waste</strong> collection 499.5.2 Garden <strong>waste</strong> collection 499.6 Inorganic/C&D/litter 499.6.1 C&D <strong>waste</strong> 499.6.2 Inorganic <strong>waste</strong> 499.6.3 Litter bins and collection 499.6.4 Illegal dumping 499.7 Hazardous/liquid/gaseous <strong>waste</strong>s 499.7.1 Biosolids 499.7.2 Hazardous <strong>waste</strong>s 499.8 Residual <strong>waste</strong> 509.8.1 Residual <strong>waste</strong> collections 509.8.2 Transfer and disposal 50A.1.0 Medical <strong>of</strong>ficer <strong>of</strong> health statement 51A.2.0 Factors affecting future demand 53A.2.1 Population and household growth 53A.2.2 Economic growth 54A.2.3 Recycling markets 54A.2.4 Central government policy & legislation 55A.2.5 Changes in lifestyles and consumption 59A.3.0 <strong>Council</strong>lor workshop 61A.3.1 Introduction 61A.3.1.1 Date & time 61A.3.<strong>1.2</strong> <strong>Purpose</strong> 61A.3.2 Agenda 61A.3.3 Plenary session 62A.3.3.1 Current services 62A.3.3.2 Facility and processing options 624
Introduction1.1 Legislative contextThe principal solid <strong>waste</strong> legislation in New Zealand is the Waste Minimisation Act 2008 (WMA). The statedpurpose <strong>of</strong> the WMA is to:“encourage <strong>waste</strong> minimisation and a decrease in <strong>waste</strong> disposal in order to(a) protect the environment from harm and(b) provide environmental, social, economic, and cultural benefits.To further its aims, the WMA requires territorial authorities to promote effective and efficient <strong>waste</strong>management and minimisation within their district. To achieve <strong>this</strong>, all territorial authorities (TAs) are requiredby the legislation to adopt a <strong>waste</strong> management and minimisation plan (WMMP). This requirement was firstintroduced in the Local Government Acts 1974 and 2002, and most TAs had adopted a plan prior to the 2008legislation.The WMA requires every TA to complete a formal review <strong>of</strong> its existing <strong>waste</strong> management plan by 1 July2012. The review must be consistent with WMA sections 50 and 51. Prior to reviewing its existing plan,Section 50 <strong>of</strong> the WMA also requires all TAs to prepare a ‘<strong>waste</strong> <strong>assessment</strong>’. This document has beenprepared in fulfilment <strong>of</strong> that requirement.An evaluation <strong>of</strong> the <strong>Waikato</strong> <strong>District</strong> <strong>Council</strong>’s (the council) existing Waste Management Plan, which wasadopted in 2002, shows that many objectives and projects outlined in the plan have been superseded and theexisting plan does not appear to fulfil the requirements <strong>of</strong> the WMA. As a result <strong>of</strong> these issues, the councilhas decided to revoke the existing plan and prepare a new WMMP.In addition, the boundary changes to the <strong>Waikato</strong> district resulting from the amalgamation <strong>of</strong> councils in theAuckland region raise many questions around <strong>waste</strong> management that the council now needs to resolve andincorporate into its <strong>waste</strong> management planning.<strong>1.2</strong> <strong>Purpose</strong> <strong>of</strong> <strong>this</strong> <strong>waste</strong> <strong>assessment</strong>This <strong>waste</strong> <strong>assessment</strong> is intended to provide an initial step to the development <strong>of</strong> a <strong>waste</strong> management andminimisation plan (WMMP), and should provide the information necessary to identify the key issues and priorityactions that will be included in the draft WMMP.Section 51 <strong>of</strong> the WMA outlines the requirements <strong>of</strong> a <strong>waste</strong> <strong>assessment</strong>, which must include:1. A description <strong>of</strong> the collection, recycling, recovery, treatment, and disposal services provided withinthe territorial authority’s district2. A forecast <strong>of</strong> future demands3. Astatement <strong>of</strong> options4. A statement <strong>of</strong> the territorial authority’s intended role in meeting demands5. A statement <strong>of</strong> the territorial authority’s proposals for meeting the forecast demands6. A statement about the extent to which the proposals will protect public health, and promote effectiveand efficient <strong>waste</strong> management and minimisation1.3 Scope1.3.1 GeneralAs well as fulfilling the statutory requirements <strong>of</strong> the WMA, <strong>this</strong> <strong>waste</strong> <strong>assessment</strong> will build a solid foundation6
that will enable the council to develop its WMMP in an informed and effective manner. In preparing<strong>this</strong> document, reference has been made to the Ministry for the Environment’s ‘Waste Management andMinimisation Planning: Guidance for Territorial Authorities’ 1 .A key issue for <strong>this</strong> <strong>waste</strong> <strong>assessment</strong> will be forming a clear picture <strong>of</strong> <strong>waste</strong> flows and management options inthe district. The WMA requires that a <strong>waste</strong> <strong>assessment</strong> must contain:“A description <strong>of</strong> the collection, recycling, recovery, treatment, and disposal services provided within theterritorial authority’s district (whether by the territorial authority or otherwise)”.This means that the <strong>waste</strong> <strong>assessment</strong> must take into consideration all <strong>waste</strong> and recycling services carried outby private <strong>waste</strong> operators as well as its own services. While the council has reliable data on the <strong>waste</strong> flowsthat it controls, data on those services provided by private industry is very limited. Reliable, regular data on<strong>waste</strong> flows is important if the council chooses to include <strong>waste</strong> reduction targets in the WMMP. Withoutdata, any targets can not be measured.The NZ Waste Strategy 2010 also makes clear that territorial authorities have a statutory authority (under theWMA) to promote effective and efficient <strong>waste</strong> management and minimisation in their district. This applies toall <strong>waste</strong> and materials flows in the district, not just those controlled by the council.1.3.2 Consideration <strong>of</strong> solid, liquid and gaseous <strong>waste</strong>sIn line with the council’s previous <strong>waste</strong> management strategies, <strong>this</strong> <strong>assessment</strong> is focused on solid <strong>waste</strong>.The guidance provided by the Ministry for the Environment on preparing Waste Management and MinimisationPlans states that:“<strong>Council</strong>s need to determine the scope <strong>of</strong> their WMMP in terms <strong>of</strong> which <strong>waste</strong>s and diverted materials are tobe considered within the plan”.The guidance goes on to suggest that liquid or gaseous <strong>waste</strong>s which are directly managed by the council, orare disposed <strong>of</strong> to landfill, should be seriously considered for inclusion in a WMMP.The council manages most liquid and gaseous <strong>waste</strong>s through other strategies, including <strong>assessment</strong>s <strong>of</strong> services.The council’s Water and Sanitary Services Assessment was completed in 2006 and was updated in the 2009LTCCP. The Water and Sanitary Services Assessment covers management <strong>of</strong> biosolids from the council’s<strong>waste</strong>water treatment plants at Te Kauwhata, Huntly, and Tuakau.Other <strong>waste</strong>s that could potentially be within the scope <strong>of</strong> the WMMP include gas from landfills and someliquid hazardous <strong>waste</strong>s. Although there is a large landfill located within the council’s boundary, the council isnot involved in the ownership or operation <strong>of</strong> <strong>this</strong> facility and <strong>waste</strong> disposed <strong>of</strong> at the landfill originates from alarge area well beyond the boundaries <strong>of</strong> the <strong>Waikato</strong> district.Therefore, apart from some liquid hazardous <strong>waste</strong>s, <strong>this</strong> <strong>waste</strong> <strong>assessment</strong> and the subsequent WMMP willfocus primarily on solid <strong>waste</strong>.1.3.3 Public health issuesProtecting public health is one <strong>of</strong> the original reasons for local authority involvement in <strong>waste</strong> management. Thiswas set out in the Health Act 1956 - although these requirements have now been repealed 2 . The NZ WasteStrategy (2010) contains the twin high level goals <strong>of</strong> “Reducing the harmful effects <strong>of</strong> <strong>waste</strong>”, and “Improvingthe efficiency <strong>of</strong> resource use”. In terms <strong>of</strong> addressing <strong>waste</strong> management in a strategic context, protection <strong>of</strong>public health can be considered one <strong>of</strong> the components entailed in ‘reducing harm’.Protection <strong>of</strong> public health is currently addressed by a number <strong>of</strong> different pieces <strong>of</strong> legislation:1.3.4 Health Act 1956The Health Act 1956 places obligations on TAs (if required by the Minister <strong>of</strong> Health) to provide sanitary worksfor the collection and disposal <strong>of</strong> refuse, for the purpose <strong>of</strong> public health protection (Part 2 – Powers andduties <strong>of</strong> local authorities, s 25). It specifically identifies certain <strong>waste</strong> management practices as nuisances (s 29)1 Ministry for the Environment (2009), Waste Management and Minimisation Planning: Guidance for TerritorialAuthorities. Wellington. Available on www.mfe.govt.nz.2 Refer: MfE 2009: Waste Management and Minimisation Planning, Guidance for Territorial Authorities.<strong>Waikato</strong> <strong>District</strong> <strong>Council</strong> <strong>waste</strong> <strong>assessment</strong> 20117
and <strong>of</strong>fensive trades (Third Schedule). The Health Act enables TAs to raise loans for certain sanitary works and/or to receive government grants and subsidies, where available. 31.3.5 The Hazardous Substances and New Organisms Act 1996(the HSNO Act)The HSNO Act addresses the management <strong>of</strong> substances (including their disposal) that pose a significant risk tothe environment and/or human health. The Act relates to <strong>waste</strong> management primarily through controls on theimport or manufacture <strong>of</strong> new hazardous materials and the handling and disposal <strong>of</strong> hazardous substances.Depending on the amount <strong>of</strong> a hazardous substance on site, the HSNO Act sets out requirements for materialstorage, staff training and certification. These requirements would need to be addressed within operational andhealth and safety plans for <strong>waste</strong> facilities. Hazardous substances commonly managed by TAs include used oil,household chemicals, asbestos, agrichemicals, LPG and batteries.The HSNO Act provides minimum national standards that may apply to the disposal <strong>of</strong> a hazardous substance.However, under the RMA a regional council or TA may set more stringent controls relating to the use <strong>of</strong> landfor storing, using, disposing <strong>of</strong> or transporting hazardous substances. 41.3.6 Resource Management Act (1991) (RMA)Although the RMA focuses on the environmental effects <strong>of</strong> activities, in practice there is a significant crossoverbetween environmental impacts and human health impacts. Therefore many <strong>waste</strong> management activities thatare likely to have public health impacts are controlled through the RMA. This may include site discharges suchas odour, groundwater contamination, particulates and other aerosols, presence <strong>of</strong> vermin etc.1.3.7 Key <strong>waste</strong> management public health issuesKey issues that are likely to be <strong>of</strong> concern in terms <strong>of</strong> public health include the following:• Management <strong>of</strong> putrescible <strong>waste</strong>s• Management <strong>of</strong> nappy and sanitary <strong>waste</strong>s Management <strong>of</strong> putrescible <strong>waste</strong>s• Management <strong>of</strong> nappy and sanitary <strong>waste</strong>s• Potential for dog/seagull/ vermin strike• Timely collection <strong>of</strong> material• Management <strong>of</strong> spillage• Litter and illegal dumping• Medical <strong>waste</strong> from households and healthcare operators• Storage <strong>of</strong> <strong>waste</strong>s• Management <strong>of</strong> hazardous <strong>waste</strong>s• Private on-site management <strong>of</strong> <strong>waste</strong>s (burning, burying, rural <strong>waste</strong> management etc).1.3.8 Management <strong>of</strong> public health issuesBroadly speaking, <strong>waste</strong> management related public health issues are likely to relate more to how specificprocesses are managed than to processes themselves. From a strategic perspective the above issues are likelyto apply to a greater or lesser extent to virtually all options under consideration. For example illegal dumpingtends to take place ubiquitously, irrespective <strong>of</strong> whatever <strong>waste</strong> collection and transfer station systems are inplace. Some systems may exacerbate the problem (infrequent collection, user charges, inconveniently locatedfacilities etc.), but by the same token the issues can be managed through methods such as enforcement,education, providing convenient facilities etc.In considering how public health issues should be addressed in the context <strong>of</strong> <strong>this</strong> <strong>waste</strong> <strong>assessment</strong> the viewis taken that public health issues are likely to present at least some level <strong>of</strong> risk across all options. Public health3 From: MfE 2009: Waste Management and Minimisation Planning, Guidance for Territorial Authorities.4 From: MfE 2009: Waste Management and Minimisation Planning, Guidance for Territorial Authorities.8
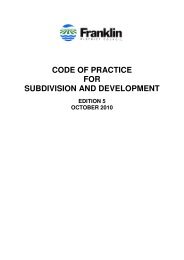
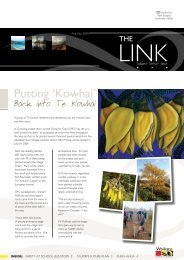
issues should not therefore drive strategic decisions but should be evaluated across all options, and issuesflagged where the level <strong>of</strong> risk is likely to require specific management controls or interventions, or where therisks are so great as to override other considerations.In most cases public health issues will be able to be addressed through setting appropriate performancestandards for <strong>waste</strong> service contracts and ensuring performance is monitored and reported on, and that thereare appropriate structures within the contracts for addressing issues that arise.1.4 The <strong>Waikato</strong> districtThe <strong>Waikato</strong> district is situated between Auckland, New Zealand’s largest urban centre, to the north, andHamilton, the fourth largest urban centre, to the south – nearly 40 per cent <strong>of</strong> New Zealand’s population livewithin 150km <strong>of</strong> the district. The main transport routes between these centres, State Highway 1 and the maintrunk rail line bisect the <strong>Waikato</strong> district. As a result <strong>of</strong> <strong>this</strong> proximity to major population centres and majortransport corridors, several major <strong>waste</strong> processing and disposal facilities that serve the wider Auckland and<strong>Waikato</strong> regions are located within the <strong>Waikato</strong> district.The major towns in the district include Huntly, Ngaruawahia, Raglan, Te Kauwhata and Tuakau.In November 2010, the <strong>Waikato</strong> district expanded by approximately 100,000 hectares as a result <strong>of</strong> boundarychanges when the Auckland <strong>Council</strong> was formed. The <strong>Waikato</strong> district absorbed a large part <strong>of</strong> the formerFranklin district area. The district’s southern boundary with Hamilton City was adjusted in May 2011, with parts<strong>of</strong> Ruakura and Te Rapa formerly in the <strong>Waikato</strong> district becoming part <strong>of</strong> Hamilton City.The population is 69 per cent European and 26 per cent Maori, with Pacific and Asian ethnic groups accountingfor the remainder. The median income in the district is $25,700, slightly over the national average ($24,400).Over half <strong>of</strong> permanent <strong>Waikato</strong> residents own their own home – 55.2 per cent, compared to 54.5 per centnationally.The <strong>Waikato</strong> district has a scenic back-drop <strong>of</strong> native bush, farmland and west coast beaches. The <strong>Waikato</strong>River flows through the district and is <strong>of</strong> great significance to the area – a significance which has been formalisedthrough a Joint Management Agreement between the council and <strong>Waikato</strong>-Tainui.The dairy industry is significant to the local economy in the area, with one <strong>of</strong> Fonterra’s largest sites beinglocated at Te Rapa (<strong>this</strong> site is now within the boundaries <strong>of</strong> Hamilton City). The second most importantindustry is mining – with both coal mining and aggregate and sand extraction being significant industries in thedistrict. In addition the district relies on industry, education, adventure tourism and events.<strong>Waikato</strong> <strong>District</strong> <strong>Council</strong> <strong>waste</strong> <strong>assessment</strong> 20119
Figure 1: <strong>Waikato</strong> districtSource: <strong>Waikato</strong> <strong>District</strong> <strong>Council</strong> (website)10
1.5 Summary <strong>of</strong> <strong>waste</strong> management in the districtUnder the current Waste Management Plan (adopted in 2002) the <strong>Waikato</strong> district has a zero <strong>waste</strong> policy.This policy includes a target <strong>of</strong> zero <strong>waste</strong> to landfill by 2020. As the <strong>Waikato</strong> district now incorporates part<strong>of</strong> the Franklin district, the Waste Management Plan adopted in 2006 by the Franklin <strong>District</strong> <strong>Council</strong> is alsorelevant.<strong>Council</strong> provides a range <strong>of</strong> <strong>waste</strong> management services to its residents, including a weekly kerbside refuseand recycling collection. Throughout most <strong>of</strong> the pre-amalgamation boundaries <strong>of</strong> the district, the kerbsidecollection services are provided by Metro<strong>waste</strong> <strong>Waikato</strong> Ltd on behalf <strong>of</strong> the council. In Raglan, Xtreme Wasteis the contractor. In addition to the council’s weekly kerbside collection <strong>of</strong> refuse and recycling, there is anannual inorganic rubbish collection that is contracted to Metro<strong>waste</strong> <strong>Waikato</strong> Ltd.In the area <strong>of</strong> <strong>Waikato</strong> that was formerly in the Franklin district, Auckland <strong>Council</strong> continues to manage thekerbside refuse and recycling contracts. These services are contracted to EnviroWaste Services Ltd.The council also provides three recycling depots and transfer stations. These are located in Raglan, Huntly, andTe Kauwhata. Further details regarding council-contracted <strong>waste</strong> services are presented in Section 3.0.As well as the council services, private <strong>waste</strong> operators also <strong>of</strong>fer a range <strong>of</strong> refuse and recycling services. Alarge proportion <strong>of</strong> commercial and industrial <strong>waste</strong> is handled by the private operators.1.6 Available documentationThe following documents have provided useful background information and are referenced throughout <strong>this</strong><strong>waste</strong> <strong>assessment</strong>:• <strong>Waikato</strong> <strong>District</strong> <strong>Council</strong>’s Long Term <strong>Council</strong> Community Plan 2009-19, Adopted June 2009• <strong>Waikato</strong> <strong>District</strong> <strong>Council</strong> Draft Annual Plan 2010/11• <strong>Waikato</strong> <strong>District</strong> <strong>Council</strong> Waste Management Plan 2002• <strong>Waikato</strong> <strong>District</strong> <strong>Council</strong> Satisfaction Survey 2009• <strong>Waikato</strong> <strong>District</strong> <strong>Council</strong> State <strong>of</strong> the Environment Report 2009• Franklin <strong>District</strong> <strong>Council</strong> Waste Management Plan • Waste Not Consulting (2010) Waste to Landfill from <strong>Waikato</strong> <strong>District</strong> – A Desk-top Analysis, Report to<strong>Waikato</strong> <strong>District</strong> <strong>Council</strong>, May 2010.<strong>Waikato</strong> <strong>District</strong> <strong>Council</strong> <strong>waste</strong> <strong>assessment</strong> 201111
2.0 WasteinfrastructureThis section provides a summary <strong>of</strong> key strategic <strong>waste</strong> facilities that currently service households andbusinesses in the <strong>Waikato</strong> district.2.1 Residual <strong>waste</strong> disposal2.1.1 Landfill disposal facilitiesThe Waste Minimisation Act 2008, in Section 7, defines a ‘disposal facility’ as:(a) a facility, including a landfill,—(i) at which <strong>waste</strong> is disposed <strong>of</strong>; and(ii) at which the <strong>waste</strong> disposed <strong>of</strong> includes household <strong>waste</strong>; and(iii) that operates, at least in part, as a business to dispose <strong>of</strong> <strong>waste</strong>; and(b) any other facility or class <strong>of</strong> facility at which <strong>waste</strong> is disposed <strong>of</strong> that is prescribed as a disposal facility.(2) In subsection (1)(a)(ii), household <strong>waste</strong> means <strong>waste</strong> from a household that is not entirely fromconstruction, renovation, or demolition <strong>of</strong> the house.With <strong>this</strong> definition, the Act has created a distinct class <strong>of</strong> landfill, the ‘disposal facility’, for those facilities thataccept household <strong>waste</strong>.In the past, landfills were lightly regulated and little engineering work was undertaken to reduce theenvironmental impact from leachate and gaseous emissions. As a result, most urban areas had their ownlandfill.Since the introduction <strong>of</strong> the Resource Management Act in 1992, most small landfills have been required toclose as they are unable to meet the necessary requirements to reduce their environmental impact. This hasled to a regionalisation <strong>of</strong> landfills, with new facilities being much more expensive to establish and operate thanpreviously.There is one landfill disposal facility within the <strong>Waikato</strong> district – North <strong>Waikato</strong> Regional Landfill (HamptonDowns landfill). This landfill receives a high proportion <strong>of</strong> <strong>waste</strong> generated within the <strong>Waikato</strong> district.Minor quantities <strong>of</strong> <strong>waste</strong> from the <strong>Waikato</strong> district may also go to other landfill disposal facilities. All <strong>of</strong> therelevant facilities are listed below.Table 1: Landfill disposal facilitiesName/operator Type Key services/<strong>waste</strong>streamsNorth <strong>Waikato</strong> RegionalLandfill (EnviroWasteServices Ltd)MunicipalLandfillNon-hazardousresidential, commercialand industrial solid <strong>waste</strong>,primarily from Aucklandand <strong>Waikato</strong>LocationHamptonDownsCapacity & estimatedoperational lifeConsented to 2030.Capacity to at least 2045.Estimated at 478,782tonnes per annum inAuckland <strong>Council</strong>’s <strong>waste</strong><strong>assessment</strong> 201112
Name/operator Type Key services/<strong>waste</strong>streamsWhitford Landfill,Waste Disposal Services(joint venture betweenAuckland <strong>Council</strong> andTranspacific IndustriesGroup (NZ) LtdTirohia Landfill, H GLeachMunicipalLandfillMunicipalLandfillNon-hazardousresidential, commercialand industrial solid <strong>waste</strong>,primarily from southAucklandNon-hazardousresidential, commercialand industrial solid <strong>waste</strong>,including special <strong>waste</strong>s.Receives <strong>waste</strong> from<strong>Waikato</strong>, Bay <strong>of</strong> Plentyand GisborneLocationWhitford,south-eastAucklandTirohia,PaeroaCapacity & estimatedoperational lifeRemaining capacity 6.5Mtonnes, Resource consentallows no more than200,000 tpaConsented to approx2035. Annual tonnagecommercially sensitiveConsidering travelling distances to Whitford and Tirohia Landfills compared to Hampton Downs, it is likely thatthe vast majority <strong>of</strong> <strong>waste</strong> disposed <strong>of</strong> to landfill is transported to Hampton Downs and <strong>this</strong> is considered themost economic disposal option for the district’s <strong>waste</strong>.2.<strong>1.2</strong> Closed landfillsThere are a number <strong>of</strong> closed landfills for which the council has ongoing management and monitoringresponsibility. These closed landfills are in Huntly, Ngaruawahia, Raglan, Te Kauwhata and Horotiu. Thecouncil carries out regular monitoring and inspection <strong>of</strong> closed landfills to ensure that they are remediated andmanaged according to the requirements <strong>of</strong> their resource consents.Hamilton City <strong>Council</strong> also has a closed landfill near Horotiu.There are also two closed landfills in the district under private ownership – a Department <strong>of</strong> Corrections facilityat Waikeria, and a timber <strong>waste</strong> landfill in Pokeno.2.1.3 CleanfillsThe Ministry for the Environment’s Cleanfill Guidelines define cleanfill material and cleanfills as follows:“Cleanfill materialMaterial that when buried will have no adverse effect on people or the environment. Cleanfill material includesvirgin natural materials such as clay, soil and rock, and other inert materials such as concrete or brick that arefree <strong>of</strong>:• combustible, putrescible, degradable or leachable components• hazardous substances• products or materials derived from hazardous <strong>waste</strong> treatment, hazardous <strong>waste</strong> stabilisation orhazardous <strong>waste</strong> disposal practices• materials that may present a risk to human or animal health such as medical and veterinary <strong>waste</strong>,asbestos or radioactive substances• liquid <strong>waste</strong>.CleanfillA cleanfill is any landfill that accepts only cleanfill material as defined above. 5 ”The council’s policy on cleanfills is the same as that <strong>of</strong> the regional council – up to 2,500 m3 per annum is apermitted activity. Resource consent is required for any cleanfill exceeding <strong>this</strong> volume, and any fill that intendsto accept material other than clean fill. The <strong>Waikato</strong> <strong>District</strong> Plan defines cleanfill as meaning:5 Ministry for the Environment (2002) ‘A Guide to the Management <strong>of</strong> Cleanfill’s. Wellington, available onwww.mfe.govt.nz<strong>Waikato</strong> <strong>District</strong> <strong>Council</strong> <strong>waste</strong> <strong>assessment</strong> 201113
“…material that when discharged to the environment will have no adverse effect on people or the environment. Thisincludes natural materials such as clay, soil and rock, and other inert materials such as broken concrete and brick, ormixtures <strong>of</strong> any <strong>of</strong> the above, and excludes:(a) material that has combustible, putrescible or degradable components, and(b) materials likely to create leachate by biological or chemical breakdown, and(c) products or materials derived from hazardous <strong>waste</strong> treatment, hazardous <strong>waste</strong> stabilisation or hazardous<strong>waste</strong> disposal practices, and(d) materials such as medical and veterinary <strong>waste</strong>, asbestos, or radioactive substances that may present a risk tohuman health, and(e) materials contaminated with hazardous substances or pathogens, and(f) hazardous substances.This definition is very similar to, but not exactly the same as, the Cleanfill Guidelines definition quoted above(for example liquid <strong>waste</strong> is not mentioned).For some types <strong>of</strong> <strong>waste</strong>, cleanfills are competing directly with landfills. However, cleanfills are much less costlythan landfills to establish and require much lower levels <strong>of</strong> engineering investment to prevent discharges intothe environment. Cleanfills also have much lower compliance costs than landfills. Because <strong>of</strong> these differingcost structures, cleanfills charge markedly less for disposal than landfills, <strong>of</strong>ten on the order <strong>of</strong> 10 per cent <strong>of</strong>landfills’ gate charges.There are several consented cleanfill operations in the <strong>Waikato</strong> district.Table 2: Cleanfill facilitiesName/operatorBombayQuarry,HolcimKey services/<strong>waste</strong> streams Location Capacity & estimatedoperational lifeCleanfill disposal, for quarry customers onlyRidge Road,BombayUp to 500,000 m3 from late2011, consented to 2025PerryResourcesLtdCleanfill disposal for public (topsoil, clay,spoil); $5 plus GST per tonne, if takingsand $4.50 plus GST, topsoil is free (laterscreened and sold)HutchinsonRd, HorotiuConsented to 2030Wedding IH& Sons LtdCleanfill, construction and demolition<strong>waste</strong>, sand, subsoil, clay and compostBedfordRoad, TeKowhaiUp to 109,500 m3 per annum<strong>of</strong> cleanfill and C&D <strong>waste</strong>Te KowhaiSandsCleanfill (preferably topsoil forrehabilitation)SH39, TeKowhaiConsented till 2021, but willlikely be at capacity by end <strong>of</strong>2011Envir<strong>of</strong>ertCleanfill (clay, soil, rock, concrete, brick,demolition products)(Take other materials such as plasterboardbut these are reprocessed)GeraghtysRoad,TuakauCurrently consented to 2019,but intend to extend consentsS D WatsonLtdCleanfill (concrete, clay and topsoil) forland contouringBucklandRd, Tuakau35,000 m3 per dayWhangarataQuarry,Ridge RoadQuarry LtdCleanfill and quarryRidge Road,BombayUp to 700,000 m314
Name/operatorRX PlasticsLtdCharbertHoldings LtdEnviroLandfill(Pukemiromine)Ridge RoadQuarry Ltd(WhangarataQuarry)Key services/<strong>waste</strong> streams Location Capacity & estimatedoperational lifeCleanfill (only clay, sand for siteremediation)CleanfillCoal mine, cleanfill, end <strong>of</strong> life tyres,construction and demolition <strong>waste</strong>CleanfillHorotiuRoad,HorotiuBucklandRoad,PukekoheHangapipiRoad,Huntly/PukemiroRidge Road,Bombay78,800 capacity, consentedto 2022. Nearly to capacityand only accepting good basematerialUp to 12,000 m3 per annum130,000 m3 per annum700,000 m3 capacity.consented to 2019There are a number <strong>of</strong> other current cleanfill consents, but these are generally secondary to another activity(e.g. civil construction projects, housing or other <strong>waste</strong> management operations) and have not been includedhere as they are short term and/or do not accept <strong>waste</strong> from external sources.Two <strong>of</strong> the cleanfill facilities, Enviro Landfill and Wedding, have specific consents to dispose <strong>of</strong> construction anddemolition <strong>waste</strong>, with the Enviro Landfill also having permission to dispose <strong>of</strong> ‘end <strong>of</strong> life’ tyres. Some <strong>of</strong> thesematerials arguably do not fit the regional or district council definitions <strong>of</strong> cleanfill given above; however theregional council has awarded consents enabling these facilities to dispose <strong>of</strong> these materials.2.1.4 Assessment <strong>of</strong> residual <strong>waste</strong> disposal infrastructureThe most significant facilities in the area are the Hampton Downs landfill, and the various cleanfill facilitiesaround the district. A review <strong>of</strong> these facilities suggests that there is sufficient capacity to accommodateresidual and cleanfill <strong>waste</strong> streams over the next 20-30 years. However there are some potential issues fromoperational and management perspectives.Any potential negative environmental effects <strong>of</strong> the Hampton Downs landfill are strictly controlled throughtheir resource consents and monitoring. However the operators are not required to provide any informationto district or regional councils regarding the tonnage, composition, or source <strong>of</strong> the <strong>waste</strong> they accept. Underthe landfill levy scheme, they do have to report to MfE on the total amount <strong>of</strong> <strong>waste</strong> disposed <strong>of</strong> per annum;however MfE only releases aggregated data.Cleanfills over a certain size are able to be identified as they require resource consents to operate. Facilitiesunder <strong>this</strong> size (2,500 m3 per annum) are permitted activities and as such are not readily identifiable. Basedon the definition <strong>of</strong> cleanfill given by both MfE and the council, it is questionable whether cleanfills are anappropriate method <strong>of</strong> disposal for some construction and demolition materials, and for tyres. For example,the MfE website states ”the disposal and storage <strong>of</strong> old and unwanted (end-<strong>of</strong>-life) tyres has a number <strong>of</strong>potential adverse environmental and health impacts”.The regional council records at the time these consent decisions were made suggest that a future ‘end-<strong>of</strong>-lifetyre’ stewardship programme would soon be in place, implying that disposal was seen a stop-gap measure.The operators <strong>of</strong> the Enviro Landfill site also had inherited a significant historic stockpile <strong>of</strong> <strong>this</strong> material whichrequired a solution. Identifying alternative management options for construction and demolition <strong>waste</strong>, andend-<strong>of</strong>-life tyres, is an issue for the district.<strong>Waikato</strong> <strong>District</strong> <strong>Council</strong> <strong>waste</strong> <strong>assessment</strong> 201115
2.2 Transfer stations and recycling depotsThere are three refuse transfer stations located in the <strong>Waikato</strong> district, all <strong>of</strong> which are council-owned. All <strong>of</strong>the facilities include public recycling drop-<strong>of</strong>f points. Locations and operating contractors are shown in Table 3.Table 3: Transfer stations and recycling depotsTown Location Managing contractorRaglan Te Hutewai Road Xtreme Waste IncHuntly McVie Road Metro<strong>waste</strong> <strong>Waikato</strong> LtdTe Kauwhata Rata Street Metro<strong>waste</strong> <strong>Waikato</strong> LtdThe following Table 4 shows the opening hours for each <strong>of</strong> the council facilities. All <strong>of</strong> the depots are closed onGood Friday, Anzac Day, Christmas Day, Boxing Day and New Years Day.Table 4: Recycling depot opening hoursTown Raglan Huntly Te KauwhataMonday 8.30am - 4.30pm 7.30am - 4.30pm CLOSEDTuesday CLOSED 7.30am - 4.30pm CLOSEDWednesday 8.30am - 4.30pm 7.30am - 4.30pm CLOSEDThursday CLOSED 7.30am - 4.30pm 11.30am - 4pmFriday 8.30am - 4.30pm 7.30am - 4.30pm 11.30am - 4pmSaturday 1.30pm - 4.30pm 10am - 4pm 10am - 4pmSunday 8.30am - 4.30pm 10am - 4pm 10am - 4pmThe materials accepted, and associated charges, are shown in Table 5 for Raglan and for all other depots.Table 5: Materials accepted and associated charges 6Material Raglan All Other 6Refuse to landfill $41/m3 Ranges between $4 per bag, to $150 per tonne for bulk loads.Green <strong>waste</strong> $10/ m3 Ranges between $4 per bag, to $110 per tonne for bulk loadsGrass clippings Free See aboveSorted glass Free Free for householdersMetals Free Free for householdersPaper Free Free for householdersCardboard Free Free for householdersPlastics coded 1,2 and 5 Free Free for householdersAluminium and steel cans Free Free for householdersPlastic supermarket bags Free NA6 As the Te Kauwhata transfer station doesn’t have a weighbridge, loads are estimated. Truck loads are re-directedto the Huntly transfer station.16
Material Raglan All Other 6Car bodies Free NAHazardous <strong>waste</strong>(including farm chemicals,garden chemicals,fertilisers, chlorine,organophosphates,drenches)Used oilFreeFree (for small amounts only ie those from householders)$1 per litreInk toners and cartridges Free NABatteries Free FreeCar batteries Free FreeCFL (small) Free Free (householders)CFL (long tube) $1/tube Free (householders)Tyres Car tyres - $10 Truck tyres - $20Cleanfill$110 per tonneWhiteware TBA $10 per itemGas bottles TBA $5Asbestos NA $500 per tonne, $.50 per kgPolystyrene NA $1600 per tonne, $1.60 per kg2.2.1 Raglan Xtreme Waste recycling depot• Garden <strong>waste</strong> which is deposited at the site is composted and re-sold back to the community.• Untreated wood is sold as fire wood, and any re-usable wood is also available for re-sale2.2.2 Assessment <strong>of</strong> transfer station infrastructure and operationIn general the district has a good transfer station network. The main exception is the north <strong>of</strong> the district,significantly Tuakau, where residents are likely to use the Pukekohe Transfer Station (within the Auckland<strong>Council</strong>’s boundaries but only 10km away) rather than travelling to the Te Kauwhata Transfer Station (33 kmaway). This reduces the ability <strong>of</strong> the council to influence <strong>waste</strong> management in Tuakau beyond kerbsidecollection provision.While the Raglan facility has a strong focus on resource recovery, options for reuse, recovery and recycling aremore limited at other transfer stations potentially leading to landfill disposal <strong>of</strong> materials that are recovered atRaglan. As these transfer stations are provided under contract to the council, <strong>this</strong> is well within their ability toinfluence.2.3 Recycling and reprocessing facilitiesThere are a number <strong>of</strong> <strong>waste</strong> processing and recycling facilities that handle materials collected in the <strong>Waikato</strong>district. There are also several major facilities in the <strong>Waikato</strong> district that process <strong>waste</strong> materials from outsidethe district. These are listed overleaf.<strong>Waikato</strong> <strong>District</strong> <strong>Council</strong> <strong>waste</strong> <strong>assessment</strong> 201117
Table 6: Details <strong>of</strong> facilitiesName/operator Type Key services/<strong>waste</strong>streamsMetro<strong>waste</strong><strong>Waikato</strong> LtdXtreme <strong>waste</strong>LoweCorporationEnvir<strong>of</strong>ertNikauContractorsVisyInitialprocessingand balingInitialprocessingand balingRenderingCompostingFacilityCleanfillProcessingand recyclingMaterialsRecyclingFacilityKerbside recyclablesfrom <strong>Waikato</strong> districtKerbside recyclablesfrom Raglan areaHigh-protein putrescible<strong>waste</strong>s from throughoutAuckland and <strong>Waikato</strong>Green <strong>waste</strong>, food<strong>waste</strong>s, plasterboard,cleanfill material fromthroughout Aucklandand <strong>Waikato</strong>Construction &demolition <strong>waste</strong> fromthroughout Aucklandand <strong>Waikato</strong>Recyclable commoditiesfrom Auckland andTukauLocationHuntly TransferStationRaglan TransferStationTuakauMeremereOnehunga,AucklandCapacity & estimatedoperational lifeOngoingOngoingNot specified, butadditional capacityavailableNo specific tonnagelimits as long as consentconditions maintainedOpening date TBA70,000 tonnes per annumapproximately2.3.1 Assessment <strong>of</strong> recycling and reprocessing facilitiesThe <strong>Waikato</strong> district is well placed to access a wide range <strong>of</strong> facilities. There is existing availability for most<strong>waste</strong> streams to be diverted, and plans are underway for other <strong>waste</strong> streams (such as construction anddemolition <strong>waste</strong>). The district is also well served by transport routes north, south and east.18
3.0 Wastemanagement in the<strong>Waikato</strong> district3.1 <strong>Council</strong>-contracted servicesA weekly kerbside <strong>waste</strong> and recycling collection is provided to the majority <strong>of</strong> the 21,700 households inthe district. Some households in remote areas do not receive a kerbside collection. These households areencouraged to instead use the recycling facilities at one <strong>of</strong> the transfer stations, although the council willconsider providing a collection where it can be ‘economically provided’ and 65 per cent <strong>of</strong> ratepayers in thearea in question want to participate.Currently, the refuse and recycling contracts in the former Franklin district continue to be administered byAuckland <strong>Council</strong>. It has not yet been agreed how these services will transfer to the <strong>Waikato</strong> <strong>District</strong> <strong>Council</strong>.3.1.1 FundingCollection services are provided to residential properties only, and are largely funded through a targeted rate.The charge for pre-paid user charged services in Raglan are set by Xtreme Waste in consultation with thecouncil and the Raglan Community Board. Other <strong>waste</strong> management services are funded from the targetedrate or in some cases, such as loose litter and abandoned vehicles, from general rates.In the former Franklin area, services have been partly funded through the general rate, and partly through adirect user-pays charge.For the 2011/12 year, the refuse collection and disposal targeted rates are as shown in the table below.Table 7: 2011/12 Targeted ratesCustomer groupChargeAll serviced residential properties except Raglan, Te Mata and Te Uku $173All serviced residential properties, Raglan kerbside recycling $84Te Mata and Te Uku recycling (within specified area) $33.82Raglan pre-paid bags$2.60 for 65L$1.50 for 35LFormer Franklin area (excluding Tuakau) pre-paid bagsTuakau – new property 120L wheelie bin$2.50 eachNo chargeTuakau – 120L wheelie bin replacement $40.80Tuakau – replacement/new/additional recycling bins $13<strong>Waikato</strong> <strong>District</strong> <strong>Council</strong> <strong>waste</strong> <strong>assessment</strong> 201119
For the 2010/11 year, the refuse collection and disposal targeted rates were:Table 8: 2010/11 Refuse targeted rates and chargesCustomer groupAll serviced residential properties except Raglan, Te Mata and Te UkuAll serviced residential properties, Raglan kerbside recyclingTe Mata and Te Uku recycling (within specified area)Raglan pre-paid bagsCharge$172.75/annum$79.73/annum$32.71/annum$2.45 for 65L$1.40 for 35LFormer Franklin area (excluding Tuakau) pre-paid bag stickers$2.50 each3.<strong>1.2</strong> ServicesA variety <strong>of</strong> service arrangements are in place, as shown below.Table 9: Summary <strong>of</strong> servicesService Provision Service providerResidual <strong>waste</strong> collection to householdsonlyPre-paid in former Franklin area (excludingTuakau) using $2 pre-paid bagsTuakau township – 120L wheelie binsPre-paid in Raglan – 60-litre pre-paid bags–$2.50, 35-litre bags - $1.50In all other areas - customer-provided bags(black sacks, fertiliser bags, or supermarketbags) up to two per weekDry recyclables collection <strong>of</strong> sortedglass, plastic grades 1, 2, & 5, aluminium/tin/steel cans and metals, paper, and cardboardcollected from a 55L recycling crateWeekly to 2800 customersWeekly to approximately1700 customersWeekly to approximately 800householdsWeekly to all otherhouseholds (excluding isolatedrural customers)Weekly to approximately21,000 customersEnviro<strong>waste</strong> Services Ltd,contracted to Auckland<strong>Council</strong> until July 2013(with two one-year rights <strong>of</strong>renewal at Auckland <strong>Council</strong>’sdiscretion)As aboveXtreme <strong>waste</strong>, contracteduntil mid-2014Metro<strong>waste</strong> <strong>Waikato</strong>,contracted until mid-2014Tuakau – Transpacific AllbriteLtd contracted to Auckland<strong>Council</strong> until July 2013(with two one-year rights <strong>of</strong>renewal at Auckland <strong>Council</strong>’sdiscretion)Raglan – Xtreme Waste,contracted until mid-2014All other areas – Metro<strong>waste</strong><strong>Waikato</strong> contracted until mid-201420
Service Provision Service providerInorganic collection <strong>of</strong> a trailer load(2m by 1m by 1m) <strong>of</strong> inorganic rubbish(furniture, lawnmowers, bikes, televisions,carpet, metal items up to 2m long,appliances able to be lifted by two people).Waste transfer and disposalHazardous <strong>waste</strong>Drop-<strong>of</strong>f facilities recycling can bedropped <strong>of</strong>f at all three transfer stations, andat two drop-<strong>of</strong>f centresLitter bins are provided in townshipsaround the districtIllegal dumping is removed from aroundthe districtPublic place recycling 30 bins areprovided in RaglanAnnually in November tohouseholds in old <strong>Waikato</strong>district, excluding RaglanPart <strong>of</strong> refuse transfer stationcontracts – Raglan, Huntly andTe KauwhataPart <strong>of</strong> refuse transfer stationcontracts – Raglan, Huntly andTe KauwhataTe Mata and Te Uku drop<strong>of</strong>fcentres available for ruralhouseholdsEmptied as necessaryAs necessaryAs necessaryMetro<strong>waste</strong> <strong>Waikato</strong>Raglan – Xtreme WasteHuntly and Te Kauwhata –Metro<strong>waste</strong> <strong>Waikato</strong>Raglan – Xtreme WasteHuntly and Te Kauwhata –Metro<strong>waste</strong> <strong>Waikato</strong>Xtreme <strong>waste</strong> contracted tomid-2014Xtreme <strong>waste</strong> in Raglan,Some emptied by a roadingcontractorXtreme <strong>waste</strong> in Raglan,various other contractorsXtreme <strong>waste</strong>3.1.3 Kerbside collectionsThe collection schedule is shown in Table 10.Table 10: Collection scheduleDayMondayTuesdayWednesdayThursdayFridaySundayAreaAwaroa (Waiuku Urban), Ngaruawahia Road, Otaua, Raglan West, Rotokauri, TeKowhai, Whatawhata, Whiriwhiri.Aka Aka, Glen Afton, Huntly, Pukemiro, parts <strong>of</strong> Otaua Rd, Rotowaro, Tuakau(wheelie bin), Raglan East, Hakarimata Rd, Brownlee Ave, View Terrace,Thickpenny Ln, Coenen St, Waingaro Rd, Clark Rd.Gordonton, Horotiu, Ngaruawahia, Orini, Taupiri.Matangi, Tamahere, Eureka, Onewhero, Tuakau (rural), Pokeno.Maramarua, Meremere, River Road, Te Kauwhata, Te Ohaki Road, WarengaRoad, Mercer.Port <strong>Waikato</strong>Services that are not pre-paid (using purchased bags or stickers) are funded by rates. Those in rural areas thatdo not receive kerbside collection services are assumed to use the transfer stations and do not pay the targetedrate.<strong>Waikato</strong> <strong>District</strong> <strong>Council</strong> <strong>waste</strong> <strong>assessment</strong> 201121
3.1.4 Other council servicesIn addition to the services described above, there are other programs or services provide by the council or by apartnership supported by the council. These include:• Kahu’s nest: a shop in Raglan which sells second-hand goods. It is free to drop <strong>of</strong>f re-saleable items.• Enviroschools• Business <strong>waste</strong> and general <strong>waste</strong> advisory services.3.1.5 Assessment <strong>of</strong> council servicesMost refuse collections are either user pays or restrict the volume residents can put out for collection in someway. The only partial exception to <strong>this</strong> is the collection for rural residents, who are restricted to two bags perweek but can use any sized bag. This allowance is unlikely to be providing any significant pressure to minimise<strong>waste</strong> and use recycling drop-<strong>of</strong>f services. Kerbside refuse and recycling collections are provided to the majority<strong>of</strong> residents, with only some isolated rural areas not receiving a service.Due to <strong>this</strong>, rural residents experience less encouragement to divert <strong>waste</strong> by recycling and to reduce <strong>waste</strong>than other residents do.Recycling options extend beyond kerbside collections in some areas, with transfer stations and drop-<strong>of</strong>f centresaround the district. Raglan also has public place recycling bins.3.2 Non-council servicesWith the exception <strong>of</strong> Xtreme Waste, the council’s contractors also provide private collection services tohouseholds. EnviroWaste Services Ltd collects private wheelie bins at the same time as collecting council prepaidrefuse bags. Metro<strong>waste</strong> <strong>Waikato</strong> collects kerbside refuse from commercial properties.Refuse and recycling collection services are provided to commercial and industrial premises in the district byEnviroWaste Services Ltd, Transpacific Industries Group (NZ) Ltd, Franklin Rubbish Removal, and Metro<strong>waste</strong><strong>Waikato</strong>. Xtreme Waste provides skip bin and user pays bag services to businesses in Raglan.Garden <strong>waste</strong> collections are provided by Daisy Garden Bags collecting in and around Ngaruawahia, andGreenfingers Garden Bags and Bins collecting around Tuakau and the outskirts <strong>of</strong> Hamilton.3.2.1 Assessment <strong>of</strong> non-council servicesWith very little information on non-council services available, it is difficult to assess the extent to whichservices are appropriate and sufficient for the district’s needs. It is known that some customers in Tuakauand surrounding areas use a MGB collection provided by a private company. Generally the use <strong>of</strong> privatelycollected MGBs for residual <strong>waste</strong> results in an increase in <strong>waste</strong> disposal to landfill 7 .The lack <strong>of</strong> information and data is the key issue with non-council services. Except in the former Franklin area,there is no requirement for operators to be licensed and they are therefore unregulated beyond national legalrequirements. There is also no requirement for data regarding <strong>waste</strong> volumes, types, or destination to beprovided nor any system in place to collect <strong>this</strong> information.3.3 Solid <strong>waste</strong> bylawThe <strong>Waikato</strong> <strong>District</strong> <strong>Council</strong> is one <strong>of</strong> the few councils in New Zealand without a bylaw specifically dealingwith solid <strong>waste</strong> issues. The former Franklin <strong>District</strong> <strong>Council</strong> had a bylaw, which covered many <strong>waste</strong> issues,including a <strong>waste</strong> operators licensing scheme. Many <strong>of</strong> the provisions <strong>of</strong> <strong>this</strong> bylaw are still being applied to thearea now included in the <strong>Waikato</strong> district. The council has a trade <strong>waste</strong> bylaw adopted in 2008, but there isnothing in the bylaw relating specifically to solid <strong>waste</strong> management.7 Noted through experience by Waste Not Consulting. The payment <strong>of</strong> a fixed fee regardless <strong>of</strong> <strong>waste</strong> quantity (aslong as it is below the limit set by the size <strong>of</strong> the bin) and the provision <strong>of</strong> a receptacle <strong>of</strong>ten larger than that providedby the council both discourage <strong>waste</strong> minimisation and use <strong>of</strong> other options such as recycling.22
3.3.1 Assessment <strong>of</strong> solid <strong>waste</strong> bylawThe lack <strong>of</strong> a <strong>waste</strong> bylaw contributes to the general lack <strong>of</strong> data regarding <strong>waste</strong> flows in the district. It alsomeans that the <strong>Council</strong> have no control over what happens with <strong>waste</strong> other than that collected by theircontractors.A bylaw can make a significant positive contribution to <strong>waste</strong> management by addressing issues such as cleanfillmanagement and data provision, encouraging <strong>waste</strong> separation and recycling, and ensuring a ‘level playing field’for all operators.3.4 Waste education and minimisationprogrammesXtreme Waste is contracted to the council to provide <strong>waste</strong> education and minimisation programmes toschools and to the community across the district.<strong>Waikato</strong> <strong>District</strong> <strong>Council</strong> <strong>waste</strong> <strong>assessment</strong> 201123
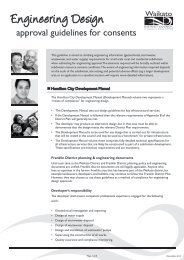
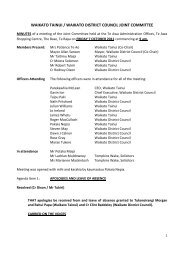
4.0 Waste within the<strong>Waikato</strong> district4.1 IntroductionThis section focuses on <strong>waste</strong> that is generated within the <strong>Waikato</strong> district. <strong>Waikato</strong> has a number <strong>of</strong> strategic<strong>waste</strong> processing and disposal facilities that accept <strong>waste</strong> from outside <strong>of</strong> the district, and flows <strong>of</strong> thesematerials are discussed in section 5.0.For local government planning purposes, the most important metrics relating to solid <strong>waste</strong> are the tonnageand composition <strong>of</strong> <strong>waste</strong> disposed <strong>of</strong> to landfill and the tonnage and composition <strong>of</strong> ‘diverted materials’.The WMA makes a clear distinction between these two types <strong>of</strong> ‘<strong>waste</strong>’ materials; ‘<strong>waste</strong>’ being defined as“any thing that is disposed <strong>of</strong> or discarded”, while ‘diverted materials’ is defined as “any thing that is no longerrequired for its original purpose and, but for commercial or other <strong>waste</strong> minimisation activities, would bedisposed <strong>of</strong> or discarded”.Measurements <strong>of</strong> <strong>waste</strong> disposed <strong>of</strong> to landfill are more readily compiled and more reliable than measurements<strong>of</strong> diverted materials. Waste to landfill is a well-defined, discrete material flow, handled by a relatively smallnumber <strong>of</strong> operators with all material generally being weighed and recorded at a common point – the landfillweighbridge.On the other hand, there is no general consensus on the boundaries <strong>of</strong> what constitutes a ‘diverted material’.Some materials, such as scrap metal and kraft cardboard collected for recycling, are widely accepted as beingdiverted materials, but for other materials, such as those handled by second-hand dealers, there is no suchagreement. Compounding the difficulties <strong>of</strong> quantifying diverted materials is the large number <strong>of</strong> businessesoperating in the industry (usually undocumented) and the wide range <strong>of</strong> unrelated disposal pathways for thematerials. The commercial sensitivity <strong>of</strong> quantitative information is another major complication, with manybusinesses in the industry being reluctant to voluntarily provide data.In relation to the objectives <strong>of</strong> the NZ Waste Strategy to ‘reduce harm’ and ‘increase resource efficiency’, athird distinct <strong>waste</strong> stream is <strong>of</strong> importance – cleanfill. ‘Cleanfills’ are meant to provide a low-cost alternative tolandfills for inert <strong>waste</strong>s that have no environmental impact when disposed <strong>of</strong> to land. However, as the Ministryfor the Environment’s 2002 guidelines for the management <strong>of</strong> cleanfills states:“...over time the term ‘cleanfill’ has been stretched and modified. Many cleanfills now mistakenly accept a multitude<strong>of</strong> construction and demolition <strong>waste</strong>, contaminated soils, green <strong>waste</strong> and many other materials that can result in anadverse effect on the environment”.It is very difficult to gather any data on <strong>waste</strong> material that is disposed <strong>of</strong> to ‘cleanfills’. ‘Cleanfills’ thatoperate with resource consents are rarely required to report on the quantity <strong>of</strong> material that is disposed <strong>of</strong>.Unconsented ‘cleanfills’ (both legal and illegal) present even greater difficulties with regards to data.As well as these ‘formal’ disposal pathways, <strong>waste</strong> can be disposed <strong>of</strong> through more ‘informal’ pathways,including illegal dumping and, particularly in rural areas, on-site incineration and burial.As a result <strong>of</strong> these factors, <strong>this</strong> summary <strong>of</strong> <strong>waste</strong> data and <strong>waste</strong> flows will focus on <strong>waste</strong> that is disposed<strong>of</strong> to landfill. Data on diverted materials will be limited to the council-controlled recycling systems (ie kerbsiderecycling and transfer station drop-<strong>of</strong>fs) and ‘commodities’ (ie paper, kraft, glass, plastic and metal containers)collected by commercial recyclers.4.2 Waste flows in the <strong>Waikato</strong> districtUsing information provided by the council and private <strong>waste</strong> operators, the flows <strong>of</strong> residual <strong>waste</strong> materials inthe district have been mapped as shown in Figure 2.24
Figure 2: Residual <strong>waste</strong> flows in the <strong>Waikato</strong> districtResidual <strong>waste</strong> from the <strong>Waikato</strong> district is disposed <strong>of</strong> directly to Hampton Downs landfill, at the threetransfer stations within the district, and other transfer stations in Auckland and Hamilton. As shown in thenext section, the largest single <strong>waste</strong> stream is general <strong>waste</strong> disposed <strong>of</strong> directly to landfill. This <strong>waste</strong> streamcomprises over 50 per cent <strong>of</strong> the total.The quantities <strong>of</strong> landfilled <strong>waste</strong> and diverted materials were determined through analysis <strong>of</strong> council recordsand information provided by private <strong>waste</strong> and recycling operators. The results for <strong>waste</strong> to landfill arepresented in Table 11 below. The results for diverted materials are presented in Table 12 on the followingpage. Both tables are divided into materials controlled by the council and materials controlled by commercial<strong>waste</strong> and recycling operators.The quantity <strong>of</strong> material that is disposed <strong>of</strong> to cleanfills is <strong>of</strong>ten greater than the amount going to landfill, butfew councils have any data on the quantity or composition. The only exception to <strong>this</strong> is Christchurch City<strong>Council</strong>, which has a bylaw requiring cleanfill operators to report regularly.4.2.1 Landfilled <strong>waste</strong> quantities for the <strong>Waikato</strong> districtTable 11: <strong>Waikato</strong> district <strong>waste</strong> to landfillWaste to landfill<strong>Council</strong>-controlled <strong>waste</strong> streamsTonnes perannum% <strong>of</strong> totalKerbside refuse collections direct to landfill 6,989 23%• Kerbside refuse collections into Raglan RTS439 1%• Kerbside refuse collections into Pukekohe RTS2,886• General <strong>waste</strong> into all transfer stations1,919 6%Subtotal - Transfer stations to landfill 5,243 18%Total - <strong>Council</strong>-controlled <strong>waste</strong> to landfill 12,232 41%10%<strong>Waikato</strong> <strong>District</strong> <strong>Council</strong> <strong>waste</strong> <strong>assessment</strong> 201125
Waste to landfillCommercial operator-controlled <strong>waste</strong> streamsTonnes perannum% <strong>of</strong> totalPrivate kerbside refuse collections 1,464 5%General <strong>waste</strong> 16,098 54%Total - Commercial operator-controlled <strong>waste</strong> to landfill 17,562 59%Total – <strong>waste</strong> to landfill 29,794 100%In total, close to 30,000 tonnes <strong>of</strong> <strong>waste</strong> are estimated to be disposed <strong>of</strong> to landfill from the <strong>Waikato</strong> districteach year.Of <strong>this</strong> total, the council controls about 41 per cent. This includes the council’s kerbside refuse collections and<strong>waste</strong> that passes through the council’s three transfer stations. The proportion <strong>of</strong> <strong>waste</strong> over which the councilhas direct control is important when planning <strong>waste</strong> minimisation services as different options are available tocouncil to mange those <strong>waste</strong> streams over which it has direct control.About 39 per cent <strong>of</strong> the <strong>waste</strong> being disposed <strong>of</strong> to landfill is from kerbside collections. These include thecouncil’s kerbside refuse collections, the council’s inorganic refuse collection, and private kerbside refusecollections.4.2.2 Diverted materials quantities for the <strong>Waikato</strong> districtThe data on council-controlled diverted materials in the table below is taken from council records. Estimates <strong>of</strong>commercial operator-controlled diverted materials are based on per capita data on diverted material generationgathered in other districts.In <strong>this</strong> analysis, ‘diverted materials’ includes only the council-controlled recycling systems (ie kerbside recyclingand transfer station drop-<strong>of</strong>fs) and ‘commodities’ (ie paper, kraft, glass, plastic and metal containers) collectedby commercial recyclers. No attempt has been made to quantify other diverted materials, such as:• Scrap metal• Concrete• Construction and demolition materials such as timber• Organic <strong>waste</strong> used for stock feed• Tyres• Second-hand goods• Timber processing <strong>waste</strong> used for hog fuel.Table 12: <strong>Waikato</strong> district diverted materialsDiverted materials<strong>Council</strong>-controlled diverted materialsTonnes perannum% <strong>of</strong> totalKerbside recycling collections and transfer station drop-<strong>of</strong>f recycling 6,989 T/annum 23%Green<strong>waste</strong> from transfer stations (Raglan only)Subtotal – <strong>Council</strong>-controlled diverted materials 4,320 62%Commercial operator-controlled diverted materials26
Diverted materialsTonnes perannum% <strong>of</strong> totalCommodities (glass, cardboard, plastics, cans only) 2,629 38%Subtotal – Commercial operator-controlled diverted materials 2,629 38%Total – diverted materials 6,949 100%About 7,000 tonnes <strong>of</strong> diverted materials are estimated to be collected annually in the <strong>Waikato</strong> district. Thecouncil’s kerbside recycling collection and transfer station drop-<strong>of</strong>fs comprise nearly 60 per cent <strong>of</strong> <strong>this</strong> total.Commercial recycling operators account for about 38 per cent <strong>of</strong> the total.4.2.3 Waste composition in the <strong>Waikato</strong> districtThe composition <strong>of</strong> solid <strong>waste</strong> from <strong>Waikato</strong> district was estimated for council by Waste Not Consulting in2010. No audits or surveys were used for <strong>this</strong> estimate; the composition was based on audits and surveys <strong>of</strong>the composition <strong>of</strong> <strong>waste</strong> in other districts adapted for the <strong>Waikato</strong> district. The results <strong>of</strong> the estimate areshown in Table 13 below for:1) The composition <strong>of</strong> all kerbside refuse collections combined – <strong>this</strong> includes the council’s baggedcollection, wheelie bins in Tuakau, and private operators’ collections.2) The composition <strong>of</strong> the overall <strong>waste</strong> stream from the district being disposed <strong>of</strong> to landfill.Table 13: <strong>Waikato</strong> district <strong>waste</strong> composition<strong>Waikato</strong> <strong>District</strong> <strong>Council</strong>kerbside refuse (counciland private combined)All <strong>waste</strong> to landfillfrom the <strong>Waikato</strong>district% <strong>of</strong> total T/annum % <strong>of</strong> total T/annumPaper – recyclable 9.2% 1,041 9.4% 2.801Paper – non-recyclable 2.6% 294 1.7% 507Plastics – recyclable 2.3% 260 1.5% 447Plastics – non-recyclable 10.2% 1,154 12.3% 3,665Organics (food and green<strong>waste</strong>) 50% 5684 34% 10,259Ferrous metals 2% 224 4% 1046Non-ferrous metals 1% 89 1% 258Glass – recyclable 3.2% 362 3.5% 1,043Glass – non-recyclable 0.7% 79 1.5% 447Textiles 3% 383 7% 2122Nappies & sanitary 11% 1209 8% 2463Rubble, concrete, etc. 1% 140 4% 1190Timber 2% 228 10% 3040Rubber 0% 19 1% 193Potentially hazardous 1% 155 1% 340Total 100% 11,313 100% 29,796Organic material, which includes primarily food <strong>waste</strong> and green<strong>waste</strong>, comprises the largest proportion <strong>of</strong> both<strong>Waikato</strong> <strong>District</strong> <strong>Council</strong> <strong>waste</strong> <strong>assessment</strong> 201127
the kerbside refuse and the overall <strong>waste</strong> stream to landfill. Plastics are the second largest component <strong>of</strong> both<strong>waste</strong> streams.4.3 Comparisons with other districtsThis section provides comparisons <strong>of</strong> several kerbside metrics between the <strong>Waikato</strong> district and neighbouringHauraki and Matamata-Piako districts. The data from the other districts is taken from those councils’ joint<strong>waste</strong> <strong>assessment</strong>.4.3.1 <strong>Council</strong> market share <strong>of</strong> kerbside refuse servicesIn all three districts included in <strong>this</strong> comparison, kerbside refuse collection services are provided by both thecouncil and private <strong>waste</strong> operators. While the councils’ services are used primarily by residential properties,anecdotal evidence suggests that the private <strong>waste</strong> operators’ services are also used by a significant proportion<strong>of</strong> commercial properties.A council’s market share <strong>of</strong> kerbside refuse collection services affects the financial parameters <strong>of</strong> the council’scollection and may affect the success <strong>of</strong> council’s <strong>waste</strong> reduction initiatives. Householders using a private userpaysMGB refuse collection service have no economic incentive to reduce the quantity <strong>of</strong> refuse they dispose<strong>of</strong> through the service. On the other hand, householders who use the user-pays council bag services can savemoney by reducing their <strong>waste</strong> to landfill.Each <strong>of</strong> the three councils’ market shares <strong>of</strong> the kerbside refuse market are calculated in Table 14. Theestimates for Hauraki and Matamata-Piako districts are considered to be more reliable than that for the<strong>Waikato</strong> district, as the information provided by the private <strong>waste</strong> industry in those districts was more detailed.Table 14: <strong>Council</strong> Market Share <strong>of</strong> Kerbside Refuse ServicesTonnes per annum <strong>Waikato</strong> district Hauraki district Matamata-Piakodistrict<strong>Council</strong> kerbside refuse 9,849 1,262 1,078Private kerbside refuse 1,464 1,224 4,093Total kerbside refuse 11,313 2,485 5,171<strong>Council</strong> market share 87% 51% 21%Whereas the council’s kerbside services account for nearly 90 per cent <strong>of</strong> the total kerbside refuse market,Matamata-Piako <strong>District</strong> <strong>Council</strong> controls slightly over 20 per cent. Hauraki’s kerbside services account for 51per cent <strong>of</strong> all kerbside refuse services.These differences are associated with the different proportions <strong>of</strong> properties receiving kerbside refuse services.<strong>Waikato</strong> <strong>District</strong> <strong>Council</strong> provides kerbside refuse services to a high proportion <strong>of</strong> properties, which providesprivate <strong>waste</strong> operators with less <strong>of</strong> an opportunity to establish an economically-viable collection service.Geographical factors must also be taken into account, as sparsely-populated areas or those with difficult terrainare less economically viable and hence less attractive to private <strong>waste</strong> operators.4.3.2 Kerbside refuse as a proportion <strong>of</strong> <strong>waste</strong> to landfillKerbside refuse services are used primarily by residential properties, with small-scale commercial businessescomprising a much lower proportion (on the order <strong>of</strong> 5-15 per cent, typically). Larger commercial andindustrial operations use other types <strong>of</strong> refuse collections, such as stationary compactors, front-loader skips,or gantry bins. As a result, in districts with a relatively low level <strong>of</strong> commercial/industrial activity, such as ruraldistricts, kerbside refuse services represent a larger proportion <strong>of</strong> <strong>waste</strong> to landfill than districts with higherlevels <strong>of</strong> commercial/industrial activity.Another factor determining the proportion <strong>of</strong> <strong>waste</strong> to landfill comprised <strong>of</strong> kerbside refuse is the relative usage<strong>of</strong> private wheelie bins. Households that use private wheelie bins tend to set out greater quantities <strong>of</strong> refuse28
than households that use refuse bags. Table 15 shows the proportion <strong>of</strong> <strong>waste</strong> to landfill comprised <strong>of</strong> kerbsiderefuse.Table 15: Kerbside refuse as a proportion <strong>of</strong> <strong>waste</strong> to landfill<strong>Waikato</strong> district Hauraki district Matamata-PiakodistrictTotal kerbside refuse 11,313 2,485 5,171Total <strong>waste</strong> to landfill 29,794 6,202 13,234Kerbside as % <strong>of</strong> total<strong>waste</strong> to landfill38% 40% 39%In the <strong>Waikato</strong> district kerbside refuse accounts for a very similar proportion <strong>of</strong> total <strong>waste</strong> to landfill as Haurakiand Matamata-Piako districts.4.3.3 Per capita <strong>waste</strong> to landfillThe quantity <strong>of</strong> <strong>waste</strong> disposed <strong>of</strong> to landfill in a given district is related to a large number <strong>of</strong> factors, including:1) The level and nature <strong>of</strong> economic activity2) The relationship between the costs <strong>of</strong> landfill disposal and the value <strong>of</strong> recovered materials3) The extent <strong>of</strong> resource recovery activity4) Seasonal fluctuations in population5) The affluence <strong>of</strong> the population.By combining Statistics NZ population estimates and the landfill <strong>waste</strong> data in section 4.2.1, the per capita perannum <strong>waste</strong> to landfill can be calculated as in Table 16 below.Table 16: Waste disposal per capita<strong>Waikato</strong> district Hauraki district Matamata-PiakodistrictPopulation 58,459 17,190 30,483Total <strong>waste</strong> to landfill(tonnes per annum)Tonnes/capita/annum <strong>of</strong><strong>waste</strong> to landfill29,794 6,202 13,2340.509 0.361 0.434The estimated per capita <strong>waste</strong> disposal is higher in the <strong>Waikato</strong> district than the other two districts.4.3.4 Per capita diverted materialsBy combining Statistics NZ population estimates and the combined council and private diverted materials datain section 4.2.2, the per capita per annum collection <strong>of</strong> diverted materials can be calculated as in Table 17below.It should be noted that ‘diverted materials’ in <strong>this</strong> context only includes the commodity-type materials, primarilypaper, kraft, glass, and plastic and metal containers. <strong>Council</strong> kerbside recycling collections, transfer stationrecycling drop-<strong>of</strong>fs, and transfer station green<strong>waste</strong> drop-<strong>of</strong>fs are also included.<strong>Waikato</strong> <strong>District</strong> <strong>Council</strong> <strong>waste</strong> <strong>assessment</strong> 201129
Table 17: Per capita diverted materials<strong>Waikato</strong> district Hauraki district Matamata-PiakodistrictPopulation 58,459 17,190 30,483Total diverted materials 6,949 2,230 3,111Tonnes/capita/annum <strong>of</strong>diverted materials0.119 0.130 0.102The per capita collection <strong>of</strong> diverted materials is similar between the three districts.4.3.5 Comparisons with other districts – <strong>waste</strong> to landfillIn previous surveys for other councils, Waste Not Consulting collected data on per capita disposal <strong>of</strong> <strong>waste</strong>to landfill. Table 18 compares the figures for a number <strong>of</strong> districts with the <strong>Waikato</strong> district. It is important tonote that some <strong>of</strong> the data were gathered before the global financial crisis <strong>of</strong> 2008. Waste to landfill tonnagesdecreased on the order <strong>of</strong> 20 per cent subsequent to that time.Table 18: Per capita <strong>waste</strong> to landfill compared to other districtsOverall <strong>waste</strong>(excluding cover materials and special <strong>waste</strong>)Tonnes per capitaper annumWaimakariri district 2010 0.336Hauraki district 2010 0.361Rodney district 2009 0.369Matamata-Piako district 2010 0.434Kapiti Coast district 2005 0.443Tauranga City and WBoP district 2010 0.452Southland district 2007 0.458Whakatane district 2007 0.465<strong>Waikato</strong> district 2010 0.509Waitaki district 2008 0.518Gore district 2007 0.519South <strong>Waikato</strong> district 2007 0.541Whangarei district 2008 0.570Rotorua 2009 0.574Napier/Hastings 2009 0.581Taupo district 2008 0.620Invercargill City 2007 0.684Thames-Coromandel district 0.695Napier/Hastings 2007 0.743Queenstown Lakes district 2008 <strong>1.2</strong>28The districts with the lowest per capita <strong>waste</strong> generation tend to be either rural areas or areas close to urbanareas but with relatively low levels <strong>of</strong> manufacturing activity. The areas with the highest per capita <strong>waste</strong>generation are those with significant primary manufacturing activity or with large numbers <strong>of</strong> tourists.30
4.4 Methodology for estimating <strong>waste</strong> tonnages andcompositionThe estimate <strong>of</strong> <strong>waste</strong> to landfill from the <strong>Waikato</strong> district has been calculated using the following types <strong>of</strong>information:1) Data provided by the council for 2009 on:a. Tonnage to landfill from the three transfer stations in the districtb. Tonnage to landfill from the council’s kerbside collectionsc. Tonnage to landfill from the council’s inorganic collection2) Statistics NZ sub-national population projections for 20093) Per capita <strong>waste</strong> generation figures from previous research conducted by Waste Not Consulting4) Composition <strong>of</strong> various <strong>waste</strong> streams as determined by previous surveys conducted by Waste NotConsulting5) Collection tonnage data provided by EnviroWaste Services Ltd and Transpacific Industries Group(NZ) LtdFor an overall estimate <strong>of</strong> <strong>waste</strong> to landfill to be made, separate estimates <strong>of</strong> <strong>waste</strong> tonnage and compositionwere made for:1) Five domestic kerbside refuse streams:a. <strong>Council</strong> refuse bags from the <strong>Waikato</strong> district, excluding Raglanb. <strong>Council</strong> refuse bags from Raglanc. Private wheelie bins from the <strong>Waikato</strong> districtd. Franklin <strong>District</strong> <strong>Council</strong> Tuakau MGBse. Franklin <strong>District</strong> <strong>Council</strong> refuse bags from the remainder <strong>of</strong> the area to be annexed to <strong>Waikato</strong> district2) <strong>Waikato</strong> <strong>District</strong> <strong>Council</strong>’s inorganic collection3) Huntly and Te Kauwhata transfer stations4) Raglan transfer station ‘general <strong>waste</strong>’ ie excluding council refuse bags5) Refuse from the former Franklin district taken to Pukekohe transfer station and from the Ngaruawahiaarea to Hamilton transfer stations6) Refuse taken directly to landfill by commercial <strong>waste</strong> operatorsTonnage and composition estimates for each <strong>of</strong> these <strong>waste</strong> streams are presented in section 4.2.3. Theestimate <strong>of</strong> the overall <strong>waste</strong> stream is presented in section 4.2.1. Waste streams that are not included in theestimate are discussed in section 4.1.Each <strong>waste</strong> stream is discussed below in more detail.4.4.1 Kerbside refuse collectionsThe composition and tonnage <strong>of</strong> kerbside refuse in post-1 November <strong>Waikato</strong> district has been estimated byseparately analysing five separate kerbside refuse streams and applying an assumed composition to each.The five kerbside refuse streams, and the assumptions that have been made relating to each, are:1) <strong>Waikato</strong> <strong>District</strong> <strong>Council</strong> refuse bags – excluding Raglan – As <strong>this</strong> refuse is disposed <strong>of</strong> directly toHampton Downs landfill, tonnage information is available. The composition is assumed to be thesame as for Franklin <strong>District</strong> <strong>Council</strong> refuse bags, which has been measured previously by Waste NotConsulting.<strong>Waikato</strong> <strong>District</strong> <strong>Council</strong> <strong>waste</strong> <strong>assessment</strong> 201131
2) <strong>Waikato</strong> <strong>District</strong> <strong>Council</strong> refuse bags from Raglan – This refuse is disposed <strong>of</strong> to the Raglan transferstation. As that facility does not have a weighbridge, an estimate <strong>of</strong> 330 tonnes has been made, basedon a relatively low per capita generation figure. The composition is assumed to be the same as forFranklin <strong>District</strong> <strong>Council</strong> refuse bags.3) <strong>Waikato</strong> and Franklin districts private MGBs – There is no tonnage information for <strong>this</strong> refuse streamavailable to either council, so it has been assumed that the tonnage <strong>of</strong> <strong>this</strong> <strong>waste</strong> stream is 20 per cent<strong>of</strong> the councils’ estimated refuse bag tonnage. The composition is assumed to be the same as privatewheelie bins in Rodney district, which has been measured previously by Waste Not Consulting.4) Franklin district MGBs – Tonnage information has been provided by EnviroWaste Services Ltd. Anaverage <strong>of</strong> 17.9 tonnes per week is collected from a total <strong>of</strong> 1628 properties (data provided by GregWebb, EnviroWaste Franklin). This includes both residential and commercial properties. The quantity<strong>of</strong> private domestic refuse collection in Tuakau is assumed to be zero.5) Franklin <strong>District</strong> <strong>Council</strong> refuse bags - There is no tonnage information for <strong>this</strong> refuse stream availableto Franklin <strong>District</strong> <strong>Council</strong>, as it is collected at the same time as the contractor’s private MGBs.The tonnage has been based on a population <strong>of</strong> 11,500, which comprises the 15,000 residents inFranklin district being annexed into <strong>Waikato</strong> district less 3500 residents in Tuakau. A ‘standard’per capita refuse generation rate <strong>of</strong> 150 kg has been used to calculate the tonnage for <strong>this</strong>population. The composition is assumed to be the same as for Franklin <strong>District</strong> <strong>Council</strong> refuse bags,which has been measured previously by Waste Not ConsultingThe results <strong>of</strong> these calculations are shown in Table 19 and Figure 3.Table 19: Kerbside refuse tonnages<strong>Waikato</strong> <strong>District</strong> - <strong>Council</strong> refuse bags –excluding Raglan<strong>Waikato</strong> <strong>District</strong> - <strong>Council</strong> refuse bags– RaglanPopulationusing serviceTonnes/capita/annumTonnes/annum42,000 0.131 55003,000 0.131 393Private MGBs 59,100 0.020 1,445Tuakau MGBs 3,500 0.266 931Franklin <strong>District</strong> – <strong>Council</strong> refuse bags 11,500 0.150 1,72532
Figure 3 - Composition <strong>of</strong> kerbside refuse collections4.5 Kerbside recycling collectionsThe diagram below summarises the <strong>waste</strong> flows and data available.Figure 4: Summary <strong>of</strong> Waste Flows and Available DataNo dataSomedataSomedataNo dataNo data<strong>Council</strong> holds information on its own kerbside collections and any material delivered to the transfer stations,<strong>Waikato</strong> <strong>District</strong> <strong>Council</strong> <strong>waste</strong> <strong>assessment</strong> 201133
ut no information on the other flows.4.6 Service user feedbackA 2009 customer satisfaction survey showed that 85 per cent <strong>of</strong> residents were very satisfied (34 per cent)/satisfied (51 per cent) with the refuse collection, and 82 per cent with the recycling collection (35 per centand 47 per cent respectively). There were few changes from previous customer surveys and no notabledifferences between wards or socio-economic groups.4.7 Summary and conclusionsThe main conclusion that can be drawn from <strong>this</strong> analysis is that there is a lack <strong>of</strong> detailed <strong>waste</strong> data availablein the <strong>Waikato</strong> district. As a result assumptions and estimates have had to be made to provide information forthe <strong>waste</strong> <strong>assessment</strong>.It is obvious however that there is a large amount <strong>of</strong> <strong>waste</strong> coming in to the district, given the presence <strong>of</strong>Hampton Downs Landfill. The types <strong>of</strong> industry and the current services provided by the council and privatecontractors also mean that the composition <strong>of</strong> the <strong>waste</strong> going to landfill can be estimated fairly reliably.4.7.1 Potential for further diversionIt is likely that the key <strong>waste</strong> streams that could be targeted for <strong>waste</strong> minimisation are the same as othercomparable districts:• Organic <strong>waste</strong> (food and garden <strong>waste</strong>)• Dry recyclables still in the <strong>waste</strong> stream – in some cases diversion rates can be as low as 50 per cent• Construction and demolition <strong>waste</strong>• Reusable materials.4.7.1.1 Kerbside refuseThe key divertible <strong>waste</strong> streams are:• Compostable: 46.6 per cent (<strong>of</strong> which almost 80 per cent is putrescible kitchen/food <strong>waste</strong>)• Recyclable: 14.7 per cent - 17.5 per cent 8These results are average compared to other districts 9 with similar collection and transfer station systems.4.7.<strong>1.2</strong> Waste to landfillOnce again, two key divertible <strong>waste</strong> streams are compostable and recyclable material, although organic<strong>waste</strong> is <strong>of</strong> reduced proportion compared to above (30.7 per cent). Other <strong>waste</strong> streams that are higher inproportion include timber, rubble and textiles.8 The exact figure would depend on what proportion <strong>of</strong> the ferrous and non-ferrous metals are recyclable; the actualproportion is likely to be somewhere towards the higher end9 Waste Not Consulting has access to composition data from a number <strong>of</strong> comparable districts.34
5.0 Waste flows in andout <strong>of</strong> the <strong>Waikato</strong>districtAs noted in earlier sections the <strong>Waikato</strong> district is in a strong strategic position with regard to <strong>waste</strong> flows. Itsits within a triangle <strong>of</strong> three <strong>of</strong> the North Island’s largest and fastest growing population centres - Auckland,Hamilton and Tauranga; making it strategically located in terms <strong>of</strong> <strong>waste</strong> and materials flows from these areas.Already there are a number <strong>of</strong> key large <strong>waste</strong> processing facilities located in the area including:• Hampton Downs landfill• Envir<strong>of</strong>ert - (organic <strong>waste</strong> processing and cleanfill)• Lowe Corporation (rendering plant)• Nikau Ltd (Construction and demolition facility)• Enviro landfill – (cleanfill, C&D <strong>waste</strong>, and tyre mon<strong>of</strong>ill facility).These facilities (and others) accept and process material from outside <strong>of</strong> the district. Although no data hasbeen made available it is likely that out <strong>of</strong> district material comprises the majority <strong>of</strong> material accepted intothese facilities.In addition <strong>waste</strong> materials flow out <strong>of</strong> the district to other facilities, in particular in Auckland. These flowsrelate in particular to commodity materials and include:• Sims Pacific – ferrous metals• Owens-Illinois - glass• Visy - commodities• CMA – scrap metals• Paper Reclaim – paper and kraft• Carter Holt Harvey – paper and kraft.Understanding these flows is important in the context <strong>of</strong> the <strong>waste</strong> <strong>assessment</strong> as <strong>Waikato</strong> <strong>District</strong> <strong>Council</strong>has a responsibility to plan for <strong>waste</strong> management and minimisation across all <strong>waste</strong> streams. There are alsopotential benefits from encouraging an expanding <strong>waste</strong> management sector in the district – <strong>this</strong> could provideeconomic and social benefits as well as allowing access to an increasing range <strong>of</strong> <strong>waste</strong> management options.There is currently demand for <strong>waste</strong> management facilities both within the region (<strong>Waikato</strong>), and nearby(Auckland and Bay <strong>of</strong> Plenty) 10 . The location, transport links, and the possible synergies with other <strong>waste</strong>management facilities already in the district make the <strong>Waikato</strong> district a logical location for large <strong>waste</strong>management facilities that are difficult to accommodate in more densely populated areas. Therefore much <strong>of</strong>the current and potential future demand for facilities is likely to be driven by material flows originating fromoutside <strong>of</strong> the district.10 This conclusion is partly based on the content <strong>of</strong> recent <strong>waste</strong> <strong>assessment</strong>s, and <strong>waste</strong> management andminimisation plans, published by councils in the <strong>Waikato</strong> and Bay <strong>of</strong> Plenty regions, and various <strong>waste</strong> datastudies carried out for the new Auckland <strong>Council</strong>. There has also been feedback from specific sectors, such as theconstruction and demolition <strong>waste</strong> industry, suggesting that a barrier to increased diversion from landfill is a lack <strong>of</strong>alternative facilities.<strong>Waikato</strong> <strong>District</strong> <strong>Council</strong> <strong>waste</strong> <strong>assessment</strong> 201135
Given the expected increasing quantities <strong>of</strong> <strong>waste</strong> material flowing in to the district, it is important that <strong>waste</strong>management and other planning documents outline how the council intends to accommodate <strong>this</strong>, and whatrole the council might choose to take in directing or influencing <strong>this</strong> sector.If <strong>this</strong> issue is not proactively managed, there is, conversely, a danger that the district could experience anincrease in detrimental <strong>waste</strong> activity such as illegal dumping and cleanfills operating outside the Ministry for theEnvironment’s cleanfill guidelines. Many nearby councils are expected to strengthen their regulatory regime(<strong>this</strong> intention is reflected in their <strong>waste</strong> <strong>assessment</strong>s and WMMPs) further exacerbating the danger <strong>of</strong> thedistrict being seen as an easy destination for difficult <strong>waste</strong> streams. For <strong>this</strong> reason, it will also be important forthe <strong>Waikato</strong> district to review their regulatory role with respect to <strong>waste</strong> management.36
6.0 Future demandand gap analysis6.1 Future demandIn general, total <strong>waste</strong> volumes in <strong>Waikato</strong> are expected to increase gradually in the short to medium term.This is largely due to anticipated population growth, largely as a result <strong>of</strong> the districts proximity to the Aucklandmetropolitan area. Expected growth figures take previous <strong>waste</strong> volumes for the <strong>Waikato</strong> district, plus aproportion <strong>of</strong> the old Franklin district, as a baseline.The focus <strong>of</strong> the council, as expressed in the 2010/11 Annual Plan 11 , is to encourage growth to occur in thetowns and villages <strong>of</strong> the district, while protecting valuable farmland and environmental assets. This will beachieved through tighter planning, and in particular restriction <strong>of</strong> subdividing rural properties. This is unlikelyto produce significant changes in types <strong>of</strong> services required however; as <strong>this</strong> is an approach that maintains thestatus quo.There are a wide range <strong>of</strong> factors that are likely to affect future demand for <strong>waste</strong> minimisation andmanagement. The extent to which these influence demand is likely to vary over time and in different localities.This means that predicting future demand has inherent uncertainties. Key factors in the <strong>Waikato</strong> district’scontext are likely to include the following:• Incorporation <strong>of</strong> a portion <strong>of</strong> the former Franklin district• Overall population growth• Tourism• Economic growth• Recycling markets• Local, Regional and Central Government Policy• Changes in lifestyle and consumption• Community expectations, (particularly given the new district boundaries).These are discussed in more detail in Appendix A.2.0.6.1.1 Demographic factorsThe district has changed significantly since the expansion <strong>of</strong> the boundary to the north. Previous predictionswere that the population <strong>of</strong> the district would increase by 97 per cent by 2061 12 . Estimates for the district’spopulation prior to the boundary changes are shown below.EstimatedpopulationNov 2010boundaries2001 2002 2003 2004 2005 2006 2007 2008 2009 201054,100 55,400 56,600 57,700 58,700 59,900 60,700 61,800 62,800 63,800Growth (%) 2.4% 2.2% 1.9% 1.7% 2.0% 1.3% 1.8% 1.6% 1.6%11 <strong>Waikato</strong> <strong>District</strong> <strong>Council</strong> “2010/11 Draft Annual Plan” available on www.waikatodistrict.govt.nz. The final planwas adopted in June 2011.12 Based on 2006 statistics NZ figures.<strong>Waikato</strong> <strong>District</strong> <strong>Council</strong> <strong>waste</strong> <strong>assessment</strong> 201137
EstimatedpopulationJune 2010boundaries2001 2002 2003 2004 2005 2006 2007 2008 2009 201045,400 47,600 48,300Source: www.stats.govt.nz, subnational population estimatesStatistics New Zealand has updated its population estimates to reflect the 1 November 2010 boundarychanges. This shows an estimated increase in population following the boundary changes <strong>of</strong> 15,500.Despite uncertainties around the current population and predicted growth in the district, it is very likely thatgrowth will continue, and current indications are that <strong>this</strong> growth will accelerate over the next 20 years.Analysis by the council in partnership with the University <strong>of</strong> <strong>Waikato</strong> have resulted in the predictions forpopulation shown below.Table 20: Forecasted district populationEstimated populationNov 2010 boundaries2009 2010 2011 2012 2021 2022 203162,800 63,800 64,066 65,081 75,740 76,997 86,982Growth (%) 1.6% 1.6% 0.42% 1.6%Estimated populationJune 2010 boundariesSource: <strong>Waikato</strong> <strong>District</strong> <strong>Council</strong>47,600 48,30016.4%(tenyears)1.7%13.0%(nineyears)The ethnic makeup <strong>of</strong> the district is unlikely to change significantly following the boundary changes. In 2009, thedistrict’s population was 69 per cent European (compared to 67.6 per cent across New Zealand) and 25.9 percent Maori (14.6 per cent across New Zealand). The remainder were <strong>of</strong> Pacific and Asian origin.6.<strong>1.2</strong> Commercial activityAs noted in section 5.0 the <strong>Waikato</strong> district is home to a number <strong>of</strong> large <strong>waste</strong> facilities, including HamptonDowns landfill, Envir<strong>of</strong>ert and Lowe Corp. Significant amounts <strong>of</strong> <strong>waste</strong> move in to the district fromsurrounding areas as a result. The <strong>waste</strong> industry has not previously been specifically recognised as an industrialsector in documents such as the <strong>Waikato</strong> <strong>District</strong> Growth Strategy (2009), although other industries such asdairy, coal mining, and forestry are mentioned.The role the district has as a key transport and energy corridor between the three urban centres <strong>of</strong> Tauranga,Hamilton and Auckland is also seen as a key factor in the location <strong>of</strong> commercial and industrial activity in thedistrict.The implications for <strong>waste</strong> management demand are two-fold: firstly the presence <strong>of</strong> strong industrial sectorrepresents <strong>waste</strong> streams that requirement management and secondly, the presence <strong>of</strong> such significant <strong>waste</strong>facilities presents the council with a number <strong>of</strong> options for managing <strong>waste</strong> in the district.A potentially negative outcome in terms <strong>of</strong> <strong>waste</strong> minimisation is the ease by which <strong>waste</strong> can be transportedand disposed <strong>of</strong> in a private facility without needing to pass through bulking or transfer stations, therebyreducing the options and degree to which the council can influence the management <strong>of</strong> these <strong>waste</strong> streams.This issue comes into particularly sharp focus with respect to cleanfill activity. Because <strong>of</strong> its proximity toAuckland it is likely that a substantial proportion <strong>of</strong> cleanfill type material from construction and demolition typeactivity makes is transported into the district. As much <strong>of</strong> <strong>this</strong> activity is uncontrolled there is no way <strong>of</strong> beingcertain <strong>of</strong> the extent <strong>of</strong> the issue, although anecdotal reports suggest that there is cause for concern and thelikelihood is that non-cleanfill type material is being disposed <strong>of</strong> to uncontrolled sites in the district.38
6.1.3 Innovative community <strong>waste</strong> managementThe <strong>Waikato</strong> district is home to Xtreme Waste, an organisation that is seen as one <strong>of</strong> the pioneers incommunity-based <strong>waste</strong> management, Xtreme Waste provide services only to a small area centred aroundRaglan. However their presence in the district, and the excellent outcomes they achieve in <strong>waste</strong> management,present real opportunities for the council to replicate <strong>this</strong> approach in other areas.Analysis <strong>of</strong> the <strong>waste</strong> streams managed by Xtreme Waste show that they collect between 213kg to 320kg <strong>of</strong>residual <strong>waste</strong> per household 13 , compared to the national average <strong>of</strong> 410kg per household.6.2 Future demand – gap analysisThe aim <strong>of</strong> <strong>waste</strong> planning at a territorial authority level is to achieve effective and efficient <strong>waste</strong> managementand minimisation. This should support the overall aims <strong>of</strong> the Waste Minimisation Act to “encourage <strong>waste</strong>minimisation and a decrease in <strong>waste</strong> disposal”.This step <strong>of</strong> the <strong>waste</strong> <strong>assessment</strong> is intended to identify areas where future demand for the council toundertake <strong>waste</strong> management and minimisation activities may increase, or areas that are not currently beingaddressed but may need to be in future.Analysis <strong>of</strong> the factors affecting demand, as described above, is made in detail in Appendix 2.0. This analysissuggests the areas outlined in the following subsections may require attention. These areas have been identifiedas those where future demand appears unlikely to be met if <strong>waste</strong> management practices do not change.6.2.1 Data and monitoringWith the district playing an increasingly important role in cross-regional <strong>waste</strong> management, the lack <strong>of</strong> data onthe district’s <strong>waste</strong> flows and monitoring <strong>of</strong> the various organisations involved in these flows will increasinglybecome an issue. Planning for the <strong>waste</strong> management sector’s presence in the district will be difficult.Identifying the best options for reducing <strong>waste</strong> to landfill, and measuring whether in fact <strong>this</strong> is occurring, iscurrently almost impossible for <strong>waste</strong> streams outside the council’s direct control.The lack <strong>of</strong> historical data on <strong>waste</strong> flows and composition data for the various council-collected andtransferred <strong>waste</strong> streams also makes it difficult to identify the best <strong>waste</strong> types to target. However in <strong>this</strong> case,there is a large amount <strong>of</strong> information available from other district councils. If the assumption is made that the<strong>Waikato</strong> district is not significantly different to other districts, then priority <strong>waste</strong> streams can be proposed.6.2.2 RegulationThis is a key tool by which the council could obtain information and improve <strong>waste</strong> management andminimisation among the commercial and industrial sectors. Regulation is also the logical way to reduceillegal management practices (although it is acknowledged that <strong>this</strong> should be supported with education andencouragement).Increasingly councils are choosing to use their ability to pass bylaws relating to <strong>waste</strong>. These can address a widerange <strong>of</strong> issues such as <strong>waste</strong> containment, licensing <strong>of</strong> <strong>waste</strong> operators, requirements to provide <strong>waste</strong> data,and the operation and management <strong>of</strong> facilities such as cleanfills.Anecdotal evidence suggests that many <strong>of</strong> the councils bordering the <strong>Waikato</strong> district are currently investigatingregulatory tools, and it is likely that regulation in general will increase in future in these areas. This will place anincreasing demand on the council to do the same. Retaining a regulatory approach to <strong>waste</strong> management thatis less rigorous than its neighbours could result in the district becoming a target for undesirable practices, suchas illegal dumping and poorly managed <strong>waste</strong> facilities.6.2.3 Waste streamsThe <strong>Waikato</strong> district is similar to many other districts in having a well-established kerbside collection for dryrecyclables, recycling facilities at transfer stations, and a residual <strong>waste</strong> collection for householders.Therefore in common with other districts the priority <strong>waste</strong> streams that could be targeted to further reduce13 The exact figure depends what assumptions are made about the occupation <strong>of</strong> baches and seasonal rentalproperties in the area.<strong>Waikato</strong> <strong>District</strong> <strong>Council</strong> <strong>waste</strong> <strong>assessment</strong> 201139
<strong>waste</strong> to landfill would include:• Non-household <strong>waste</strong>, particularly small to medium businesses• Organic <strong>waste</strong>, particularly food <strong>waste</strong>• Construction and demolition <strong>waste</strong>• Potentially reusable items.The district is in a fortunate position in that the infrastructure required to divert these <strong>waste</strong> streams islargely available. Analysis does indicate that diverting organic <strong>waste</strong> economically may require more localisedprocessing facilities, as transport to the nearest facility (Envir<strong>of</strong>ert) from the furthest point <strong>of</strong> the districtoutweighs the economic benefit <strong>of</strong> diverting the material 14 .Construction and demolition <strong>waste</strong> could be diverted to local recycling facilities, located centrally to serve thedistrict.Diverting reusable items requires staff and space resources rather than any specific processing infrastructure.6.2.4 Charging mechanismsThe amount <strong>of</strong> residual <strong>waste</strong> per household for Raglan has been calculated to be between 212 kg to 318kg per household per year. This is compared to a national average <strong>of</strong> 410 kg per household per year, and adistrict average <strong>of</strong> 455 kg per household per year.This suggests that the differences between the services provided in Raglan and those provided in the rest <strong>of</strong> thedistrict have a significant impact on the amount <strong>of</strong> <strong>waste</strong> sent to landfill, being (in no particular order):• Services provided by a community organisation• More items accepted for recycling at the transfer station• Provision <strong>of</strong> a reuse store at the transfer station• Demographic differences and attitude• A mixture <strong>of</strong> targeted rates for kerbside recycling and user-pays charges for residual <strong>waste</strong>.The last point is likely to have a significant impact on residual <strong>waste</strong> quantities and is something that can beeasily transferred to other areas.6.2.5 Economic developmentAs has been noted, the <strong>waste</strong> processing and disposal industry already has a significant presence in the district,and there may be potential to grow <strong>this</strong> industry still further, with a view to making the area a hub for <strong>waste</strong>minimisation related industries. Growth is likely to be driven by growth in surrounding areas forcing operationsthat have a relatively large land requirement into more rural areas such as the <strong>Waikato</strong> district. Economicdevelopment opportunities may exist in the following areas:• Organic <strong>waste</strong> processing• Construction and demolition <strong>waste</strong> processing• Utilising energy from organic <strong>waste</strong>s• Reuse <strong>of</strong> goods (in particularly for small rural towns)• Encouraging tourism through promotion <strong>of</strong> a zero <strong>waste</strong>/<strong>waste</strong> minimisation brand for the district• Utilising organic <strong>waste</strong> derived products on local farms and soils to improve productivity and reduce carbonimpacts.6.2.6 Rural <strong>waste</strong> sourcesLittle is known about the <strong>waste</strong> management practices <strong>of</strong> rural residents and businesses. Although some douse the council refuse and recycling services, many rural properties are not provided with a kerbside collection.It is assumed that they make use <strong>of</strong> the transfer stations; however anecdotal evidence also suggests that there14 Unpublished research carried out for Xtreme Waste, 2011.40
may be some self-management <strong>of</strong> <strong>waste</strong> on farms.National experience suggests there may be issues specifically with <strong>this</strong> customer group relating to agriculturalchemical containers, silage wrap, and on-site disposal or burning <strong>of</strong> <strong>waste</strong>s.The lack <strong>of</strong> reliable information on farm <strong>waste</strong> in the district and its potential impacts suggests a potential futurework area to ascertain any significant issues and what responses, if any, are appropriate.One <strong>of</strong> the areas that has received little attention and which may be important for further investigation is that<strong>of</strong> dairy shed effluent. <strong>Waikato</strong> is a major centre for dairy farming and dairy shed effluent <strong>waste</strong>s can createissues such as leachate and eutrophication <strong>of</strong> waterways and distribution <strong>of</strong> pathogens. Dairy shed effluent ishowever an ideal ingredient for processing in Anaerobic Digestion (AD). Once processed through AD energycan be recovered and the output can be used as a soil amendment for pasture without the same risks togroundwater, water ways and soil. There may be opportunities for development <strong>of</strong> on-site digesters or localfacilities that can take tankered material from several sources.6.2.7 Communication and educationWhile the council does undertake <strong>waste</strong> minimisation communication and education activities, any <strong>of</strong> the aboveareas are likely to require increased effort in <strong>this</strong> area to ensure that the community understand why actions arebeing taken, and to discourage unwanted behaviour such as illegal dumping.<strong>Waikato</strong> <strong>District</strong> <strong>Council</strong> <strong>waste</strong> <strong>assessment</strong> 201141
7.0 Statement <strong>of</strong>options7.1 Addressing demandThe areas <strong>of</strong> demand have been identified in sections 6.2.1 to 6.2.7. In the sections below, options foraddressing the areas <strong>of</strong> demand are outlined and the potential role for council discussed.7.1.1 Data and monitoringMore reliable data and monitoring <strong>of</strong> <strong>waste</strong> in the district will make it easier for the council to deliver itsstrategic <strong>waste</strong> management responsibilities as set out in the WMA. The council is also the best placed agencyto deliver data collection and monitoring through its ability to pass a bylaw that requires <strong>waste</strong> operators toprovide information.The council should take a lead agency role in <strong>this</strong> area as they require the information for <strong>waste</strong> management,and has the tools to require that the information be provided.At present there is limited ability for the council to access data outside <strong>of</strong> council controlled <strong>waste</strong> streams.Accessing <strong>this</strong> data may require a licensing regime to be established.7.<strong>1.2</strong> RegulationThe regulatory tool predominantly used by local authorities to manage <strong>waste</strong> is the bylaw.A <strong>waste</strong> bylaw could simply require <strong>waste</strong> operators to provide information, as discussed above, or morestringent requirements could be put in place such as compulsory recycling, separating <strong>waste</strong> streams forrecycling, extended litter and illegal dumping controls, and control <strong>of</strong> cleanfills.The community’s view on the extent <strong>of</strong> a <strong>waste</strong> bylaw should be assessed through the WMMP consultationprocess by proposing a range <strong>of</strong> areas which could be addressed through a bylaw. However the council shouldalso agree a minimum level <strong>of</strong> control they wish to achieve through a bylaw. The bylaw previously in place inthe Franklin district, which addresses definitions, receptacles, <strong>waste</strong> placement, collection arrangements, illegaldumping and litter, and licensing could be used as a minimum guideline. A regulatory approach could also beused to encourage or require businesses to manage their <strong>waste</strong> better, although better data and monitoringwould probably be required before <strong>this</strong> step could be taken.The council will need to take a lead agency role in <strong>this</strong> area as they are the only agency with the necessarypowers.It is worthwhile emphasising the potential impact <strong>of</strong> neighbouring areas on the need to introduce regulationand enforcement. This is particularly the case with regard to cleanfills. Auckland <strong>Council</strong>’s <strong>waste</strong> <strong>assessment</strong>includes a proposal to introduce a bylaw regulating cleanfills. If <strong>this</strong> is implemented it could precipitate themigration <strong>of</strong> significant quantities <strong>of</strong> material out <strong>of</strong> Auckland – in particular material that does not fit thedefinition <strong>of</strong> cleanfill material under the potential bylaw. In other words such a move could result in theuncontrolled disposal <strong>of</strong> large quantities <strong>of</strong> potentially harmful material into the <strong>Waikato</strong> district. It wouldtherefor, be prudent to monitor the situation in surrounding areas and ensure that regulations and enforcementare at least comparable to neighbouring districts.7.1.3 Waste streamsA significant amount <strong>of</strong> <strong>waste</strong> could be diverted from landfill by introducing new collections, altering existingcollection services, and enhancing separation <strong>of</strong> materials at transfer stations. Waste streams that have potentialfor enhanced diversion include:• Food <strong>waste</strong>42
• Garden <strong>waste</strong>• Introducing user pays/reduced frequency <strong>of</strong> residual <strong>waste</strong> collections• Timber• Paper and cardboard• Recycling services <strong>of</strong>fered to businesses, particularly small to medium businesses.It is difficult to estimate the impact that new collection services could have without better data and monitoring<strong>of</strong> <strong>waste</strong> flows.The council could take a lead agency and/or a supporting role in <strong>this</strong> area, depending on the extent to which itwishes to be involved in directing the management <strong>of</strong> non-household <strong>waste</strong> streams.7.1.4 Charging mechanismsAs discussed above, making residual <strong>waste</strong> collections user-pays could reduce <strong>waste</strong> to landfill significantly.There also appears to be potential to review the pricing at transfer stations to encourage desirable behaviour,while not increasing levels <strong>of</strong> undesirable behaviour such as illegal dumping.Introducing user-pays to varying degrees across the district should be proposed in the WMMP to assess thecommunity’s view. However the council should also consider the evidence demonstrating the effectiveness<strong>of</strong> user-pays services to reduce <strong>waste</strong> to landfill, and may wish to propose a minimum level <strong>of</strong> user-pays vs.targeted rates funding that it wishes to introduce or trial.Transfer station charges should be reviewed and a level <strong>of</strong> cross-subsidisation proposed (so residual <strong>waste</strong>charges are above cost recovery, to subsidise recycling operations) to assess community views.For the transfer stations operated on the council’s behalf by contractors, the council will need to take a leadagency role with support from its contractors.7.1.5 Economic developmentWhile local economic development is a key aspect <strong>of</strong> a zero <strong>waste</strong> approach promotion <strong>of</strong> these opportunitiesis not traditionally within the scope <strong>of</strong> <strong>waste</strong> management and minimisation planning. It will be importanttherefore to engage with the council’s economic development unit and other agencies to explore the potentialfor developing opportunities in <strong>this</strong> area. It is envisaged that council’s role could include:• Integration <strong>of</strong> zero <strong>waste</strong> related objectives into plans and policies• Facilitation <strong>of</strong> new facilities/expansion <strong>of</strong> existing facilities through planning rules and regulations• Establishment <strong>of</strong> incentives• Participation in/assistance with trials/pilots• Working with community organisations to establish reuse facilities• Development <strong>of</strong> appropriate branding and communications.7.1.6 Rural <strong>waste</strong> sourcesImproved data and monitoring will enable the council to assess whether <strong>this</strong> is an area requiring additionalaction. <strong>Council</strong> should propose reviewing <strong>this</strong> area <strong>of</strong> service once further information is available. One areathat may be worth further specific investigation is the potential to promote anaerobic digestion on dairy farms.This would lend itself to a cross-agency approach with involvement from the regional council, technologysuppliers, the farming sector, and local economic development agencies.The council should take a lead role in <strong>this</strong> area.7.1.7 Communication and educationWhile not an area <strong>of</strong> significant demand at present, taking action in any <strong>of</strong> the above areas will require increasedcommunication and education. When developing the statements <strong>of</strong> proposal in <strong>this</strong> <strong>waste</strong> <strong>assessment</strong>, anyaction areas that will impact on communication and education needs will be identified.The council could take a lead role in <strong>this</strong> area, or could take a supporting role and enable other agencies to<strong>Waikato</strong> <strong>District</strong> <strong>Council</strong> <strong>waste</strong> <strong>assessment</strong> 201143
deliver <strong>this</strong>. The role taken will probably depend on the area being addressed. For example in Raglan, it islogical that the council would support Xtreme Waste to deliver communication and education activities.7.2 Other <strong>waste</strong> management and minimisationIssues7.2.1 Collection servicesGenerally, customers appear to be satisfied with the collection services provided. There does not seem to beany reason for the council to reduce its role in providing these services. Therefore with the exception <strong>of</strong> theareas identified above, the council should propose to maintain its existing role in collection service provision.The types <strong>of</strong> services delivered and their configurations will need to be reviewed however, particularly in light<strong>of</strong> the new district boundaries which have resulted in a range <strong>of</strong> different collection services being provided.There are a range <strong>of</strong> options for kerbside collection services including:• Frequency <strong>of</strong> collection• Charges applied• Type <strong>of</strong> containment (wheeled bins or bags for refuse, wheeled bins or crates for recyclables)• Materials collected• Eligibility to receive the service.These are all potentially contentious issues that may be further complicated by how the provision <strong>of</strong> theseservices will be incorporated into existing contracts. Any change to the service will need to be fully costed andconsulted upon with householders, contractors and councillors.It is recommended, therefore, that the configuration <strong>of</strong> these services should be the subject <strong>of</strong> a separatereview which can ensure the issues are addressed in sufficient detail.7.2.2 Recovery and treatment services and facilitiesWith the exception <strong>of</strong> the specific areas mentioned above, an <strong>assessment</strong> <strong>of</strong> current services and facilitiesshows that the district has access to a wide range <strong>of</strong> options. It is not considered an area requiring any specificaction by the council.7.2.3 Hazardous and special <strong>waste</strong>sA review <strong>of</strong> existing services and facilities suggests that these <strong>waste</strong> streams are currently well managed, andthere are no significant areas <strong>of</strong> demand.7.2.4 DisposalThe availability <strong>of</strong> Hampton Downs landfill within the district’s boundaries means that any disposal needs aremet for the foreseeable future.7.2.5 Producer responsibilityThe council has no direct powers or responsibilities regarding producer responsibility, but may wish to lobbycentral government regarding certain priority products.44
8.0 Statement <strong>of</strong> thecouncil’s intended role8.1 Statutory obligations<strong>Council</strong>s have a number <strong>of</strong> statutory obligations in respect <strong>of</strong> the planning and provision <strong>of</strong> <strong>waste</strong> services.These include the following:• Under the WMA the council “must promote effective and efficient <strong>waste</strong> management and minimisationwithin its district” (s 42).• The WMA also requires territorial authorities (TAs) to develop and adopt a Waste Management andMinimisation Plan (WMMP) 15• The WMA also requires TAs to have regard to the New Zealand Waste Strategy. The NZ Waste Strategyhas two high levels goals: ‘Reducing the harmful effects <strong>of</strong> <strong>waste</strong>’ and ‘improving the efficiency <strong>of</strong> resourceuse’. These goals must be taken into consideration in the development <strong>of</strong> the council’s <strong>waste</strong> strategy• Under the Local Government Act 2002 (LGA) the council must consult the public about its plans formanaging <strong>waste</strong>• Under the Resource Management Act 1991 (RMA), TA responsibility includes controlling the effects <strong>of</strong>land-use activities that have the potential to create adverse effects on the natural and physical resources <strong>of</strong>their district. Facilities involved in the disposal, treatment or use <strong>of</strong> <strong>waste</strong> or recoverable materials may carry<strong>this</strong> potential. Permitted, controlled, discretionary, non-complying and prohibited activities and their controlsare specified within district planning documents, thereby defining further land-use-related resource consentrequirements for <strong>waste</strong>-related facilities.• Under the Litter Act 1979 TAs have powers to make bylaws, issue infringement notices, and require theclean-up <strong>of</strong> litter from land.• The Health Act 1956. Health Act provisions for the removal <strong>of</strong> refuse by local authorities have beenrepealed by local government legislation. The Public Health Bill is currently progressing through Parliament.It is a major legislative reform reviewing and updating the Health Act 1956, but it contains similar provisionsfor sanitary services to those currently contained in the Health Act 1956.• The Hazardous Substances and New Organisms Act 1996 (the HSNO Act). The HSNO Act providesminimum national standards that may apply to the disposal <strong>of</strong> a hazardous substance. However, under theRMA a regional council or TA may set more stringent controls relating to the use <strong>of</strong> land for storing, using,disposing <strong>of</strong> or transporting hazardous substances.The council, in determining its role, needs to ensure that its statutory obligations, including those noted above,are met.8.2 Overall strategic direction and roleFeedback from councillor and stakeholder workshops indicates that there is general support among thecommunity and council to continue with a zero <strong>waste</strong> philosophy, supported by realistic and achievable goalsand targets.A key part <strong>of</strong> a zero <strong>waste</strong> approach is to consider the role <strong>of</strong> <strong>waste</strong> in the wider economy – in other words toconsider issues <strong>of</strong> resource efficiency and viewing <strong>waste</strong> as a resource, rather than as an issue to be ‘managed’.15 The development <strong>of</strong> a WMMP in the WMA is a requirement modified from Part 31 <strong>of</strong> the LGA 1974, but witheven greater emphasis on <strong>waste</strong> minimisation.<strong>Waikato</strong> <strong>District</strong> <strong>Council</strong> <strong>waste</strong> <strong>assessment</strong> 201145
This means integrating <strong>waste</strong> into economic development plans and initiatives.Building on <strong>this</strong>, another key part <strong>of</strong> the zero <strong>waste</strong> approach is the view that <strong>waste</strong> is not just a councilproblem but ultimately resides with all sectors <strong>of</strong> the community to solve. While council, through its statutoryobligations and its traditional involvement in <strong>waste</strong> issues, has a natural leadership role, it is vital that part <strong>of</strong><strong>this</strong> role entails securing the commitment <strong>of</strong> all sectors, and ensuring that there are clear action plans for eachsector to follow.It is proposed that part <strong>of</strong> the council’s role may be to provide appropriate regulatory and economic incentiveframeworks to steer activity. 16In addition to the above it is proposed that council continue to provide a range <strong>of</strong> <strong>waste</strong> management andminimisation services similar to those in place currently.The council’s role is likely to be wide-ranging therefore and is expected to encompass the following:• Leadership in advocating zero <strong>waste</strong> in the community, including establishing partnerships and informationsharing as appropriate• Integration <strong>of</strong> zero <strong>waste</strong> into economic development, policy and planning• Integration <strong>of</strong> zero <strong>waste</strong> and local economic development impacts into council procurement policies• Development and monitoring <strong>of</strong> an appropriate framework <strong>of</strong> regulation and incentives• Monitoring and enforcement <strong>of</strong> <strong>waste</strong> related bylaws and legislation• Gathering, analysis and reporting <strong>of</strong> <strong>waste</strong> data• Provision (either directly or through contracts) <strong>of</strong> kerbside refuse and recycling collection services, transferstation operations, drop <strong>of</strong>f facilities, and communication and education• Development <strong>of</strong> new services as appropriate• Development <strong>of</strong> <strong>waste</strong> management and minimisation plans• Advocating policy positions to central government, neighbouring authorities, and private and communityorganisations that are consistent with the councils zero <strong>waste</strong> objectivesIt is expected that the implementation <strong>of</strong> these proposals will meet forecast demand for services as well assupport the council’s goals and objectives for <strong>waste</strong> management and minimisation. These goals and objectiveswill be confirmed as part <strong>of</strong> the development and adoption <strong>of</strong> the Waste Management and Minimisation Planprior to July 2012.16 Although there is concern that a stronger approach to regulatory and economic instrument tools might encouragemore unwanted activities such as illegal dumping, there is also a recognition that a stronger approach is probablyrequired to achieve a significant difference in <strong>waste</strong> going to landfill.46
9.0 Statement <strong>of</strong>proposalsThese statements <strong>of</strong> proposal form the action plan section <strong>of</strong> the draft Waste Management and MinimisationPlan. The key action areas are outlined below. The final actions undertaken will depend on the outcome <strong>of</strong>the statutory consultation process for the draft Waste Management and Minimisation Plan.9.1 Communication, education and consultation9.1.1 Community partnershipsThe council will support community <strong>waste</strong> partnerships (CWPs) where they exist, and encourage establishment<strong>of</strong> new partnerships. This will require input from the community as well as the council and will be fundedthrough <strong>waste</strong> levy funds.9.<strong>1.2</strong> Communication and consultationWaste levy funds will also be set aside to provide for community involvement in <strong>waste</strong> management planning,whether through CWPs or other means. Once again <strong>this</strong> will require input from the community as well as thecouncil.9.1.3 EducationThe council will use <strong>waste</strong> levy funds (approximately $90,000 in 2010/11, or $1.50 per capita per annum)to provide regular and detailed information about <strong>waste</strong> services, <strong>waste</strong> prevention and <strong>waste</strong> reduction, inpartnership with the community.9.1.4 Regional partnershipsThe council will continue their existing partnership working with other local authorities and regional councils.This will be carried out in consultation with CWPs where appropriate.9.2 Taking direct action, fostering new ideas9.2.1 Waste Management Sector Working GroupThe council will initiate the establishment <strong>of</strong> a working group for the <strong>waste</strong> management sector, to encouragecommunication between <strong>this</strong> sector, the council, and the community, and to have an input into the directiontaken by <strong>this</strong> sector, particularly with respect to facilities that are capable <strong>of</strong> diverting priority <strong>waste</strong> streams.While the working group will require the input <strong>of</strong> the <strong>waste</strong> sector, other councils, and community; the councilwill establish an internal working group to support their interaction with the working group, particularly focusingon definitions and policy approaches. This is envisaged to involve minimal cost.9.3 Changing the rules, monitoring and feedback9.3.1 Waste bylawThe <strong>Council</strong> will review the existing <strong>Waikato</strong> and Franklin <strong>District</strong> <strong>Council</strong> bylaws, and review as appropriateto address issues such as operator licensing, cleanfill operation, and service provision by the private sector, etc.The council will consult with the community to develop the bylaw, and the statutory consultation process alsoapplies. The review will be funded by general rates.9.3.2 Review <strong>waste</strong> chargesThe council will review all their <strong>waste</strong> charges, to ensure true cost-recovery pricing is in place where<strong>Waikato</strong> <strong>District</strong> <strong>Council</strong> <strong>waste</strong> <strong>assessment</strong> 201147
appropriate, while still encouraging reuse and recycling. It will also be important to ensure that public funds donot subsidise private operations. Where CWPs exist, <strong>this</strong> review will be carried out in discussion with them,and with the council’s contractors.9.3.3 EnforcementTo ensure the bylaw operates effectively, enforcement should be undertaken.The council will investigate the potential to delegate <strong>this</strong> role to CWPs and/or contractors where appropriate.To ensure that enforcement activity is proportionate and effective, there will be regular performance reviewsand the community will be consulted to identify areas where enforcement should be focused. While bylawenforcement operations can <strong>of</strong>ten be self-funding, there may be some funding required from general rates.9.3.4 Solid <strong>waste</strong> analysis surveysThe council will continue to carry out regular surveys <strong>of</strong> kerbside collections, and will expand these toincorporate other areas such as transfer station <strong>waste</strong>. This will ensure that the council is identifying allopportunities to improve <strong>waste</strong> minimisation and management, and to monitor progress <strong>of</strong> other actions.Depending on the scope and frequency <strong>of</strong> surveying agreed in the WMMP, the council may require <strong>waste</strong> levyfunding.9.3.5 Monitor <strong>waste</strong> flowsThe bylaw mentioned above in section 9.3.1 will also enable the council to monitor <strong>waste</strong> flows not collectedor transferred by them, and <strong>of</strong> <strong>waste</strong> flows into or out <strong>of</strong> the district. As occurs in other areas, the costs <strong>of</strong>administering <strong>this</strong> part <strong>of</strong> the bylaw will be recovered through administration charges for licensed contractors.9.4 Recyclable commodities9.4.1 Maintain/expand kerbside collectionThe council will continue to provide collection <strong>of</strong> recyclables at the kerbside, and to consider opportunitiesto expand the collection to new areas <strong>of</strong> the district. The council will also assess the potential to provide thekerbside recycling collection to schools, kindergartens, and kohanga reo. This process will involve CWPs and/orcontractors where applicable. Where new services are provided, they will be funded through targeted rates asat present.The council will also work with contractors and/or CWPs to identify initiatives that will expand the existingkerbside recycling collection, such as collecting additional recyclables on occasion, providing an additionalreceptacle which could target specific material streams, analysing <strong>waste</strong> analysis surveys to identify additionalmaterials to be included where a cost/benefit analysis supports inclusion.9.4.2 Commercial recycling collectionThe council will investigate the potential for a commercial recycling collection service in parts <strong>of</strong> the district,for businesses, large schools, etc. The council will discuss their findings with the Waste Management SectorWorking Group to explore options as to how these services could be provided and where material would beprocessed. This could result in several outcomes; services being <strong>of</strong>fered by community groups, and/or privatesector collectors, and/or the council.To support <strong>this</strong> initiative, the council will investigate how businesses could be encouraged to recycle throughbylaw mechanisms.This initiative will prioritise glass and paper/cardboard.9.4.3 Drop-<strong>of</strong>f facilitiesThe council will continue to maintain existing drop-<strong>of</strong>f facilities, and will investigate options to provide additionaldrop-<strong>of</strong>f facilities to service rural areas and holiday destinations. The council will work with and negotiate withcontractors and/or CWPs to provide necessary services, funded through targeted rates.9.4.4 RTS facilitiesExisting refuse transfer facilities will be maintained, but charging will be reviewed and the council will negotiate48
with contractors/CWPs to ensure consistent charging across the district.The council will also assess the capital required to upgrade existing RTSs so that all can accommodate reuse,C&D <strong>waste</strong> recycling, and expanded e-<strong>waste</strong> services.RTS provision and improvement would be a combination <strong>of</strong> user charges, targeted rates, and capitalexpenditure. The council would need to have the input <strong>of</strong> contractors, CWPs and the community.9.4.5 TransportThe council will continue to transport recyclables to markets for processing, funded by targeted rates.9.5 Food and garden <strong>waste</strong>9.5.1 Food <strong>waste</strong> collectionThe council will keep a watching brief on the Xtreme Waste organic <strong>waste</strong> trial project.Once outcomes from <strong>this</strong> trial are known, the council will decide whether to investigate the provision <strong>of</strong> auser-friendly weekly kerbside food <strong>waste</strong> collection and processing services. Investigations, and part <strong>of</strong> the cost<strong>of</strong> any new services, would be funded by <strong>waste</strong> levy funds and also by savings in expenditure in other <strong>waste</strong>management areas that should be realised at <strong>this</strong> point.The council will also investigate the potential for a commercial food <strong>waste</strong> collection on a user pays basis,working with the Waste Management Sector Working Group to explore options for service provision andprocessing.9.5.2 Garden <strong>waste</strong> collectionThe council will investigate the provision <strong>of</strong> a user-pays garden <strong>waste</strong> collection to parts <strong>of</strong> the district.9.6 Inorganic/C&D/litter9.6.1 C&D <strong>waste</strong>In addition to actions outlined above for RTSs, the council will also work with the Waste Management SectorWorking Group to improve services and facilities for C&D <strong>waste</strong> recycling in general, on a user pays basis.9.6.2 Inorganic <strong>waste</strong>The council will investigate making the transition from a rates funded inorganic collection service to an on-calluser pays service.9.6.3 Litter bins and collectionThe council will continue to provide the rates funded litter bin and loose litter collection services.9.6.4 Illegal dumpingIn addition to actions described above regarding bylaws and enforcement, the council will continue to providea rates-funded illegal dumping removal service. During removal, information will be collected to quantify <strong>waste</strong>,monitor locations and <strong>waste</strong> types, and define priority areas for enforcement action.9.7 Hazardous/liquid/gaseous <strong>waste</strong>s9.7.1 BiosolidsThe council will carry out a review <strong>of</strong> existing biosolids storage, including quantifying current and futurequantities <strong>of</strong> biosolids requiring management.This review will inform discussions with the Waste Management Sector Working Group, to ensure thatconsideration <strong>of</strong> service and facility provision accommodates biosolids management, particularly for beneficialend use.While alternative processing is not available, biosolids will be managed and disposed <strong>of</strong> responsibly.<strong>Waikato</strong> <strong>District</strong> <strong>Council</strong> <strong>waste</strong> <strong>assessment</strong> 201149
9.7.2 Hazardous <strong>waste</strong>sThe council will continue to <strong>of</strong>fer services for hazardous <strong>waste</strong> at RTSs, and will also work with CWPs/contractors to extend the range <strong>of</strong> hazardous <strong>waste</strong> items that are accepted at RTSs.9.8 Residual <strong>waste</strong>9.8.1 Residual <strong>waste</strong> collectionsThe council will investigate the potential to reduce residual <strong>waste</strong> collection frequencies alongside introduction<strong>of</strong> a food <strong>waste</strong> collection, user-pays green <strong>waste</strong> collection, and expanded recycling collections. Theintroduction <strong>of</strong> these other services will mean that residual <strong>waste</strong> collections no longer need to be so frequent.9.8.2 Transfer and disposalAny residual <strong>waste</strong> collected by the council or passing through RTSs will be transported to an appropriatedisposal facility.50
A.1.0 Medical <strong>of</strong>ficer <strong>of</strong>health statement<strong>Waikato</strong> <strong>District</strong> <strong>Council</strong> <strong>waste</strong> <strong>assessment</strong> 201151
A.2.0 Factors affectingfuture demandA.2.1A.2.1.1Population and household growthPopulation growthThe district has changed significantly since the expansion <strong>of</strong> the boundary to the north. Previous predictionswere that the population <strong>of</strong> the district would increase by 97 per cent by 2061 17 . Estimates for the district’spopulation prior to the boundary changes are shown below.EstimatedpopulationNov 2010boundaries2001 2002 2003 2004 2005 2006 2007 2008 2009 201054,100 55,400 56,600 57,700 58,700 59,900 60,700 61,800 62,800 63,800Growth (%) 2.4% 2.2% 1.9% 1.7% 2.0% 1.3% 1.8% 1.6% 1.6%EstimatedpopulationJune 2010boundariesSource: www.stats.govt.nz, subnational population estimates45,400 47,600 48,300Statistics New Zealand has updated its population estimates to reflect the 1 November 2010 boundarychanges. This shows an estimated increase in population following the boundary changes <strong>of</strong> 15,500.Despite uncertainties around the current population and predicted growth in the district, it is very likely thatgrowth will continue, and current indications are that <strong>this</strong> growth will accelerate over the next 20 years.Analysis by the council in partnership with the University <strong>of</strong> <strong>Waikato</strong> have resulted in the predictions forpopulation shown below.Table 21: Forecasted district populationEstimated populationNov 2010 boundaries2009 2010 2011 2012 2021 2022 203162,800 63,800 64,066 65,081 75,740 76,997 86,982Growth (%) 1.6% 1.6% 0.42% 1.6%Estimated populationJune 2010 boundariesSource: <strong>Waikato</strong> <strong>District</strong> <strong>Council</strong>47,600 48,30016.4%(tenyears)1.7%13.0%(nineyears)The ethnic makeup <strong>of</strong> the district is unlikely to change significantly following the boundary changes. In 2009, thedistrict’s population was 69 per cent European (compared to 67.6 per cent across New Zealand) and 25.9 percent Maori (14.6 per cent across New Zealand). The remainder were <strong>of</strong> Pacific and Asian origin.17 Based on 2006 statistics NZ figures<strong>Waikato</strong> <strong>District</strong> <strong>Council</strong> <strong>waste</strong> <strong>assessment</strong> 201153
A.2.2Economic growthEconomic growth has traditionally been correlated with <strong>waste</strong> production. Higher levels <strong>of</strong> economic activityleads to greater production and consumption <strong>of</strong> goods and <strong>this</strong> in turn can lead to higher quantities <strong>of</strong> <strong>waste</strong>.A common measure <strong>of</strong> economic growth is Gross Domestic Product (GDP). With no historical <strong>waste</strong> data, itis not possible to demonstrate a correlation between <strong>waste</strong> volumes and GDP within the district.However analysis <strong>of</strong> data from other parts <strong>of</strong> New Zealand has been analysed in <strong>this</strong> way, and shows a strongcorrelation between <strong>waste</strong> and GDP.In recent time, GDP growth has fallen sharply and at the time <strong>of</strong> writing <strong>this</strong> report NZ had experienced sevenconsecutive quarters <strong>of</strong> negative economic growth. Economic forecasts vary with some predicting an extendedperiod <strong>of</strong> weak growth 18 before the economy recovers to previous historical levels.In terms <strong>of</strong> planning for <strong>waste</strong> facilities and services however it is important to ensure demand is met and so itis prudent to take a more optimistic view. Below are GDP forecasts to 2016 which indicate a return to growth<strong>of</strong> around 3 per cent per annum by 2010.Table 22: GDP and GDP growth to 20162010 2011 2012 2013 2014 2015 2016GDP ($m) 34,140 35,329 36,151 37,248 38,378 39,542 40,439GDP growth 3.42% 3.48% 2.33% 3.03% 3.03% 3.03% 2.27%Source: Goldman Sachs JB WereOn the basis <strong>of</strong> the correlation noted above, the trend in GDP would indicate a reduction in <strong>waste</strong> over thecoming year followed by a return to historical levels <strong>of</strong> <strong>waste</strong> growth.A.2.3Recycling marketsRecovery <strong>of</strong> materials from the <strong>waste</strong> stream for recycling and reuse is heavily dependent on the recoveredmaterials having an economic value. This particularly holds true for recovery <strong>of</strong> materials in the private sector.Markets for recycled commodities are influenced by prevailing economic conditions and most significantly bycommodity prices for the equivalent virgin materials.In the latter part <strong>of</strong> 2008, after the global economic crisis, international markets for recycled commodities fellsharply. Prices for aluminium cans dropped from $1000 a tonne to $100. Plastics, on average, fell from $280a tonne to $200, steel from $700 to $100 and copper from $8000 to $4000. Cardboard and paper pricesalso dropped 90 per cent. 19 Since <strong>this</strong> time demand and prices have recovered to a degree but not to previouslevels. While the fall appears dramatic, prices were falling from record highs and have in real terms simplyreturned to pre-boom prices. This is illustrated in Figure 5.18 http://www.nzherald.co.nz/economy/news/article.cfm?c_id=34&objectid=10580231&pnum=219 http://www.stuff.co.nz/4810576a13.html54
Figure 5: International commodity prices 2001-2009Source: MfE Solid Waste Composition Report Card in http://www.mfe.govt.nz/environmental-reporting/report-cards/<strong>waste</strong>-composition/2009/index.htmlThe fall in the markets led to stockpiling <strong>of</strong> materials by recyclers, and has put strain on the industry. Althoughthe recycling industry is struggling and some collectors have pulled back from collecting materials to the sameextent as previously 20 the industry did not experience any significant exits from the market or reduction in totalcapacity. Markets and market prices have, to a large degree, stabilised in the period since the global financialcrisis, driven principally by the continued economic growth in China and other Asian economies.Therefore it seems likely that any increase in demand for processing would be able to be met by the privatesector, contingent on the ongoing transport <strong>of</strong> recyclables to these markets.A.2.4Central government policy & legislationThere are a number <strong>of</strong> key policies and pieces <strong>of</strong> legislation that may influence demand for <strong>waste</strong> minimisationand management in the <strong>Waikato</strong> district. These are discussed in the following subsections.A.2.4.1 The Waste Minimisation Act 2008The Waste Minimisation Act 2008 (WMA) provides a regulatory framework for <strong>waste</strong> minimisation thathad previously been based on largely voluntary initiatives and the involvement <strong>of</strong> territorial authorities underprevious legislation, including Local Government Act 1974, Local Government Amendment Act (No 4) 1996,and Local Government Act 2002. The purpose <strong>of</strong> the WMA is to encourage a reduction in the amount <strong>of</strong><strong>waste</strong> disposed <strong>of</strong> in New Zealand.In summary, the WMA:• Clarifies the roles and responsibilities <strong>of</strong> territorial authorities with respect to <strong>waste</strong> minimisation egupdating Waste Management and Minimisation Plans (WMMPs) and collecting/administering levy funding for20 http://www.nzherald.co.nz/recycling/news/article.cfm?c_id=614&objectid=10559396<strong>Waikato</strong> <strong>District</strong> <strong>Council</strong> <strong>waste</strong> <strong>assessment</strong> 201155
<strong>waste</strong> minimisation projects• Requires that a Territorial Authority promote effective and efficient <strong>waste</strong> management and minimisationwithin its district (Section 42)• Requires that when preparing a WMMP a Territorial Authority must consider the following methods <strong>of</strong><strong>waste</strong> management and minimisation in the following order <strong>of</strong> importance:• Reduction• Reuse• Recycling• Recovery• Treatment• Disposal.• Put a levy on all <strong>waste</strong> disposed <strong>of</strong> in a landfill, initially at $10 per tonne effective as <strong>of</strong> 1 July 2009; 50 percent <strong>of</strong> the funds collected will be provided to Territorial Authorities to be spent on the implementation<strong>of</strong> their <strong>waste</strong> minimisation and management plans. The remainder, less any administration costs, go into acontestable fund for <strong>waste</strong> minimisation initiatives. The levy will help dis-incentivise landfill and levy fundingis available to support <strong>waste</strong> diversion projects• Facilitates or enforces producers, brand owners, importers, retailers, consumers and other parties to takeresponsibility for the environmental effects <strong>of</strong> their products – from ‘cradle-to-grave’ through voluntary andmandatory product stewardship schemes. There may be implications for local authorities which currentlydeal with these products in their <strong>waste</strong> streams or who are party to voluntary programmes• Allows for regulations to be made making it mandatory for certain groups (for example, landfill operators)to report on <strong>waste</strong> to improve information on <strong>waste</strong> minimisation. This will impact on councils owning oroperating landfills• Introduces a new Waste Advisory Board to give independent advice to the Minister for the Environment on<strong>waste</strong> minimisation issues.Various aspects <strong>of</strong> the Waste Minimisation Act are discussed in more detail below.A.2.4.2National landfill levyFrom 1 July 2009 the National Waste Levy came in to effect, adding $10 per tonne to the cost <strong>of</strong> landfilldisposal. At $10 a tonne, the levy appears unlikely in the short term to encourage more businesses to findalternatives to landfilling their <strong>waste</strong>. The government has indicated that the levy will increase – howevertimeframes surrounding the increase are currently unknown. Nevertheless, when the increase is announced theimpact will become gradually more significant as a proportion <strong>of</strong> disposal costs – a cost which will undoubtedlybe passed directly onto customers. This provides a clear driver for reducing <strong>waste</strong> to landfill over the short tomedium term in anticipation <strong>of</strong> the inevitable increasing costs associated with landfill.A.2.4.3Product stewardshipThe Waste Minimisation Act (2008) (Part 2) makes provision for the government to introduce a requirementfor products to be declared priority products and for such products to be required to be part <strong>of</strong> a productstewardship scheme. The purpose <strong>of</strong> product stewardship schemes are to ensure effective reduction, reuse,recycling or recovery <strong>of</strong> the product and to manage any environmental harm arising from the product when itbecomes <strong>waste</strong> 21 .The Ministry for the Environment’s 2009 discussion document 22 identifies three <strong>waste</strong>s: agricultural chemicals,used oil and refrigerant gases as primary candidates for priority products. A further eight products are identifiedas potential priority products including computers and electronic equipment, packaging, paint, plasterboard and21 Waste Management Act 2008 2(8)22 Ministry for the Environment (2009), Waste Minimisation in New Zealand – A discussion document from theMinistry for the Environment. Wellington56
tyres. Most <strong>of</strong> these products are the subject <strong>of</strong> voluntary schemes currently and the government has indicatedit will monitor the outcomes <strong>of</strong> these voluntary schemes before deciding on their priority product status.The following schemes have currently been accredited by the Minister for the Environment:• Geocycle Holcim Used Oil Recovery Scheme – used oil collection and disposal scheme.• The PlasbackTM - scheme to recover used farm plastics for recycling.• The Glass Packaging Forum’s glass packaging product stewardship scheme - scheme for reducing theamount <strong>of</strong> glass packaging sent to landfill.• Agrecovery Rural Recycling Programme– scheme to recover agrichemical plastic containers, silage wrap,crop protection net and agrichemicals.• Refrigerant Recovery- scheme to collect and destruct unwanted synthetic refrigerants, chlor<strong>of</strong>luorocarbons(CFCs), hydrochlor<strong>of</strong>luorocarbons (HCFCs) and hydr<strong>of</strong>luorocarbons.The council has the opportunity to benefit from the introduction <strong>of</strong> product stewardship schemes as they mayimprove the recovery and diversion <strong>of</strong> products the council currently manages. Of particular importance in the<strong>Waikato</strong> district is the Agrecovery scheme.A.2.4.4Waste minimisation fundThe Waste Minimisation Fund has been set up by the Ministry for the Environment to help fund <strong>waste</strong>minimisation projects and to improve New Zealand’s <strong>waste</strong> minimisation performance through:• Investment in infrastructure• Investment in <strong>waste</strong> minimisation systems• Increasing educational and promotional capacity.Criteria for the Waste Minimisation Fund have been published:1. Only <strong>waste</strong> minimisation projects are eligible for funding. Projects must promote or achieve <strong>waste</strong>minimisation. Waste minimisation covers the reduction <strong>of</strong> <strong>waste</strong> and the reuse, recycling andrecovery <strong>of</strong> <strong>waste</strong> and diverted material. The scope <strong>of</strong> the fund includes educational projectsthat promote <strong>waste</strong> minimisation activity.2. Projects must result in new <strong>waste</strong> minimisation activity, either by implementing new initiatives or asignificant expansion in the scope or coverage <strong>of</strong> existing activities.3. Funding is not for the ongoing financial support <strong>of</strong> existing activities, nor is it for the running costs <strong>of</strong>the existing activities <strong>of</strong> organisations, individuals, councils or firms.4. Projects should be for a discrete timeframe <strong>of</strong> up to three years, after which the project objectives willhave been achieved and, where appropriate, the initiative will become self-funding.5. Funding can be for operational or capital expenditure required to undertake a project.6. For projects where alternative, more suitable, government funding streams are available (such asthe Sustainable Management Fund, the Contaminated Sites Remediation Fund, or research fundingfrom the Foundation for Research, Science and Technology), applicants should apply to these fundingsources before applying to the Waste Minimisation Fund.7. The applicant must be a legal entity.8. The fund will not cover the entire cost <strong>of</strong> the project. Applicants will need part funding from othersources.9. The minimum grant for feasibility studies will be $10,000.00. The minimum grant for other projects willbe $50,000.00.(Source: www.mfe.govt.nz)Assessment criteria have also been published by the Ministry, and workshops have been held around NewZealand to explain the application process and the criteria. Those applying for funding need to remember the<strong>Waikato</strong> <strong>District</strong> <strong>Council</strong> <strong>waste</strong> <strong>assessment</strong> 201157
goal <strong>of</strong> the Fund, and ensure that their application demonstrates a contribution to these goals.The latest information available on the fund suggests that the main <strong>assessment</strong> point is likely to be whatthe Ministry describe as ‘largest net benefit over time’ eg amount <strong>of</strong> <strong>waste</strong> diverted from landfill per dollar<strong>of</strong> funding), alongside supporting criteria such as likelihood <strong>of</strong> success, reducing environmental harm, widersustainability benefits, and longevity. Projects that can act as trailblazers for the rest <strong>of</strong> New Zealand will also befavoured. The Ministry strongly encourages partnership working and collaboration.While no minimum ‘match’ funding has been specified, the Ministry has made it clear that projects with higherlevels <strong>of</strong> match funding will be seen as demonstrating successful collaboration and a greater likelihood <strong>of</strong> successand longevity.The first funding round opened on 1 December 2009, and applications closed at 5pm on 1 March 2010.Successful projects commenced in August 2010. The next funding round ran during in January – March2011, with projects starting in August/September 2011. A third round is expected in late 2011 and MfE hasannounced that <strong>this</strong> will be a ‘targeted’ round.A.2.4.5Emissions Trading Scheme (ETS)In its current form, The Climate Change (Emissions Trading) Amendment Act 2008 will require landfill ownersto surrender emission units to cover methane emissions generated from the landfill, thereby impacting on thecost <strong>of</strong> landfilling. Should any future solid <strong>waste</strong> incineration plants be constructed, the Act would also requireemission units to be surrendered to cover carbon dioxide, methane and nitrous oxide emissions from theincineration <strong>of</strong> household <strong>waste</strong>s. The <strong>waste</strong> sector will not formally enter the ETS until 1 January 2011, atwhich time voluntary reporting can occur. Mandatory reporting requirements will apply from January 2012 andemission units will need to be surrendered as <strong>of</strong> 2013.Emissions for <strong>waste</strong> will be accounted for within the year that the <strong>waste</strong> is disposed <strong>of</strong> to landfill – ie the totalamount <strong>of</strong> methane that <strong>waste</strong> is expected to produce will be calculated, reported, and require NZUs in theyear it goes to landfill. This does mean that closed landfills will not require any reporting or NZUs. ‘Legacy’closed landfills have been excluded from the ETS.The definition <strong>of</strong> a disposal facility will be the same as applies in the Waste Minimisation Act (2008).This DEF assumes that no landfill gases are collected or destroyed in any way, and incorporates an assumptionthat 10 per cent <strong>of</strong> methane in a capped landfill is oxidised to CO2 before being emitted to the atmosphere.For a DFO to use a UEF, they must carry out a prescribed Solid Waste Analysis Protocol (SWAP) surveyprocess for a year’s <strong>waste</strong>. This SWAP survey must categorise the <strong>waste</strong> by source, as municipal solid <strong>waste</strong>,commercial and industrial, building and demolition, and other. Within each source, the fraction <strong>of</strong> the following<strong>waste</strong> materials must be calculated: food <strong>waste</strong>, garden <strong>waste</strong>, paper, wood, textiles, nappies, sewage sludge,and other.For each <strong>of</strong> these <strong>waste</strong> materials, a standard proportion <strong>of</strong> degradable organic carbon (DOC) has beencalculated. These are shown in Table 23. ‘Other materials’ are assumed to have zero DOC.Table 23: Proportions <strong>of</strong> degradable organic carbon, by materialWaste materialDOCFood <strong>waste</strong> 0.15Green <strong>waste</strong> 0.20Paper 0.40Wood 0.43Textiles 0.24Nappies 0.24Sewage sludge 0.05The regulations require landfill operators to undertake two <strong>waste</strong> surveys over a 12 month period with the58
surveys at least three months apart to allow for seasonal variation – although it could be argued <strong>this</strong> would bemore accurately measured if surveys were required to be five - six months apart.The users <strong>of</strong> SWAP surveys, and UEFs, are required to re-establish the composition <strong>of</strong> each <strong>waste</strong> source at 10yearly intervals.DFOs that reduce their methane emissions to the atmosphere by flaring or through energy production carryout a net methane calculation. Once again, these DFOs need to apply for a UEF. DFOs are required tocalculate their own efficiency rate <strong>of</strong> methane collection and destruction. These calculations must incorporatean assumption that 10 per cent <strong>of</strong> methane in a capped landfill is oxidised to CO2 before being emitted to theatmosphere (although the TAG report notes that DFOs could apply to calculate their own unique oxidationfactor).A.2.4.6NZ Waste Strategy targetsThe revised NZWS was released in October 2010. The new strategy adopts two <strong>of</strong> the three overarchinggoals from the previous (2002) NZWS. These are:1. Reducing the harmful effects <strong>of</strong> <strong>waste</strong>2. Improving the efficiency <strong>of</strong> resource useThe NZWS 2010 is a departure from the previous strategy in that it has moved away from an overarchingobjective <strong>of</strong> zero <strong>waste</strong>, and that it does not present any specific targets for <strong>waste</strong> minimisation.The intent <strong>of</strong> the 2010 strategy is to enable a more flexible approach to <strong>waste</strong> management and encouragedevelopment <strong>of</strong> locally-appropriate targets and solutions, and to efficiently allocate <strong>waste</strong> management andminimisation effort and resources.A.2.5Changes in lifestyles and consumptionHousehold <strong>waste</strong> growth is not just a New Zealand phenomenon. In 1997 OECD countries produced 540million tonnes <strong>of</strong> MSW annually (approximately 500kg per person). Waste grew at an average annual rate <strong>of</strong>1.8 per cent between 1980 and 1985, 3.6 per cent between 1985 and 1990, and 1 per cent between 1990 and1997 23 . A report by the OECD 24 noted the following driving forces behind current and projected householdconsumption patterns:1. Rising per capita income2. Demographics (more working women, more single person households, larger retirement population)3. Accompanying changes in lifestyles leading to individualised buying patterns4. Shift towards more processed and packaged products5. Higher levels <strong>of</strong> appliance ownership6. Wider use <strong>of</strong> services and recreation7. Technology8. Institutions and infrastructure that create the prevailing conditions faced by householders23 Towards Sustainable Household Consumption? Trends and Policies in OECD Countries, OECD 2002, p 5324 Ibid, p12.<strong>Waikato</strong> <strong>District</strong> <strong>Council</strong> <strong>waste</strong> <strong>assessment</strong> 201159
Figure 6 below shows the growth in municipal <strong>waste</strong> plotted against GDP and population. The chart showsthat <strong>waste</strong> has tended to increase at a rate slightly below GDP but noticeably above the level <strong>of</strong> populationgrowth.Figure 6: Municipal <strong>waste</strong> generation, GDP and population in OECD countries 1980 - 2020source OECD 2001A study by the EPA 25 compared levels <strong>of</strong> GDP, population growth, and consumer spending as measures topredict <strong>waste</strong> arisings. The study used historical data to establish the predictive accuracy <strong>of</strong> these measures andfound the best predictor <strong>of</strong> <strong>waste</strong> arisings levels to be consumer spending.Research from the UK suggests that underlying the longer-term pattern <strong>of</strong> household <strong>waste</strong> growth is anincrease in the quantity <strong>of</strong> materials consumed by the average household and that <strong>this</strong> in turnsource is drivenby rising levels <strong>of</strong> household expenditure 26 .At a district level the data regarding economic growth projections is sparse. At a national level, TheDepartment <strong>of</strong> Building and Housing report on projections from the Reserve Bank, whose GDP forecasts for2011 stood at 2.8 per cent, but which had previously been forecast at 3.5 per cent. Recent New ZealandInstitute <strong>of</strong> Economic Research (NZIER) predictions also became more pessimistic in September 2010 thanthey previously had been with a forecast <strong>of</strong> 2.2 per cent growth in 2010 and <strong>1.2</strong> per cent in 2011. 27Forecasts therefore appear to be predicting gradual economic recovery – but the climate is uncertain. Theimplications for <strong>waste</strong> management are therefore that no significant increases should be expected as a result<strong>of</strong> any rapid growth in economic activity, but there is a need to ensure that planned changes in services andfacilities are sufficiently ‘future pro<strong>of</strong>ed’.25 EPA, 1999. National Source Reduction Characterisation Report For Municipal Solid Waste in the United States26 Eunomia (2007), Household Waste Prevention Policy Side Research Programme, Final Report for Defra, London,England27 Department <strong>of</strong> Building and Housing (2010) Website page: Economic growth and industry, Updated September2010, Available: http://www.dbh.govt.nz/economic-growth-industry60
A.3.0 <strong>Council</strong>lorworkshopA.3.1IntroductionA.3.1.1 Date & timeThe workshop was held from 9:30 to 10:30am on 11 April 2011, at the council <strong>of</strong>fices in Galileo St,Ngaruawahia.A.3.<strong>1.2</strong><strong>Purpose</strong>The purpose <strong>of</strong> the workshop was to explain the new <strong>waste</strong> management planning process to councillors,present initial results for <strong>waste</strong> data, and hear the views <strong>of</strong> councillors on how <strong>waste</strong> management andminimisation services in the district should be developed, with a focus on the areas that are relevant to the<strong>waste</strong> <strong>assessment</strong> stage.Under the Waste Minimisation Act 2008 all councils must review their Waste Management and MinimisationPlans (WMMPs) prior to June 2012. As part <strong>of</strong> <strong>this</strong> review, <strong>Waikato</strong> <strong>District</strong> <strong>Council</strong> is undertaking a <strong>waste</strong><strong>assessment</strong>.The <strong>waste</strong> <strong>assessment</strong> takes stock <strong>of</strong> current services, looks at potential future demand for <strong>waste</strong> services,and develops initial options for addressing future demand. A <strong>waste</strong> <strong>assessment</strong> is a mandatory first step toproducing a new <strong>waste</strong> management and minimisation plan.The focus at <strong>this</strong> point <strong>of</strong> the process is on a few key areas where feedback from the council and thecouncillors is important. This workshop aimed to explore councillors’ opinions on these areas, but also toexplain how the process will work and why the council is undertaking <strong>this</strong> process now.A.3.2Time9:30amItemAgendaWelcome – Glen McIntosh and Richard Bax, <strong>Waikato</strong> <strong>District</strong> <strong>Council</strong>9:35am Presentation from Lisa Eve, Eunomia Research and Consulting, and Bruce Middleton, WasteNot Consulting – <strong>waste</strong> <strong>assessment</strong> and WMMP process, <strong>Waikato</strong> <strong>District</strong> <strong>waste</strong> services and<strong>waste</strong> data9:40am Presentation from Lisa Eve, Eunomia Research and Consulting on the <strong>waste</strong> <strong>assessment</strong> andWMMP process, <strong>Waikato</strong> <strong>District</strong> <strong>waste</strong> services, and <strong>waste</strong> data10:20am Plenary Session led by Lisa Eve, Eunomia Research and Consulting -10:30am10:45amDiscussion <strong>of</strong> broad aims and objectivesIdentification <strong>of</strong> key issues for discussion (e.g.):• <strong>Council</strong>’s role• <strong>Council</strong>’s vision• Meeting demandC<strong>of</strong>fee BreakContinuing discussion <strong>of</strong> key issues11:30amSession close<strong>Waikato</strong> <strong>District</strong> <strong>Council</strong> <strong>waste</strong> <strong>assessment</strong> 201161
A.3.3Plenary sessionThe plenary session involved canvassing ideas on the overall direction for <strong>waste</strong> management in the district,with a view to these ideas feeding into the <strong>waste</strong> <strong>assessment</strong>, and the development <strong>of</strong> a vision and set <strong>of</strong> aimsand objectives for the WMMP. There was also discussion as to the extent to which the council might bemeeting demand for <strong>waste</strong> management in the district.Many points were noted during <strong>this</strong> session, and these have been categorised under these topic headings. Foreach heading, the comments made during the session are summarised, and a summary <strong>of</strong> potential issues forfuture discussion or consideration are highlighted:A.3.3.1Current servicesIn general councillors believe that feedback on services is excellent at the moment and residents appear tobe very happy with the kerbside services provided to them. Comments were made such as ‘council needs tokeep it simple – the current system seems to work’. Some believed that it may be better to make incrementalchanges than to implement complicated solutions – and that it is important to manage <strong>waste</strong> well at areasonable price.A.3.3.2Facility and processing optionsA few councillors queried whether incineration might be a potential management option. Transfer stationswere also identified as facilities where attention was required – such as addressing perceived operational issues,potentially introducing remuneration-linked KPIs for contractors to improve performance, and reviewing thesystem <strong>of</strong> gate fees (although there was little consensus on how – with increases, decreases, and variablepricing to encourage recycling all mentioned). A number <strong>of</strong> councillors mentioned that perceived high costs fordisposal discourages responsible behaviour, with the potential outcome being increased illegal dumping whichis also council’s problem. On the other hand, the point was also raised that there needed to be incentives toseparate <strong>waste</strong> streams, which is a key to diverting more <strong>waste</strong> from landfill.A.3.3.3Regulatory approach<strong>Council</strong>lors would prefer to have a framework through which people are encouraged to do the right thingrather than ‘draconian regulations’. There was some discussion around the role <strong>of</strong> the regional council inenforcement and regulation, particularly as <strong>this</strong> relates to cleanfills, and whether <strong>this</strong> should be a regional or adistrict council responsibility.Later in the session there was further discussion <strong>of</strong> illegal dumping and similar problems. There was generalacknowledgement that while more education on <strong>this</strong> issue was required, the problem was unlikely to go awaythrough education alone.A.3.3.4<strong>Council</strong>’s vision<strong>Council</strong>lors continue to support the vision <strong>of</strong> zero <strong>waste</strong>, and would like to see <strong>this</strong> remain in some form thatcommunicates the concept properly.It was agreed that during the process <strong>of</strong> drafting the <strong>waste</strong> <strong>assessment</strong>, the project team would propose draftvisions for consideration.A.3.3.5Meeting demand<strong>Council</strong>lors believe that they are meeting the demand for household <strong>waste</strong> services quite well. They wouldlike to see contractors operating the transfer stations controlled more tightly to better reduce <strong>waste</strong>, and forcouncil to lobby central government for product stewardship schemes.A.3.3.6ConclusionThe views received at <strong>this</strong> councillor’s workshop, and the later stakeholder’s workshop, will be incorporatedin to the draft <strong>waste</strong> <strong>assessment</strong>. Certain areas will be emphasised to ensure that the full responsibilities, andpotentially expanded role, <strong>of</strong> council is appreciated by councillors when considering <strong>this</strong> draft.62
A.4.0 StakeholderworkshopA.4.1A.4.1.1IntroductionDate & timeThe workshop was held from 4:30pm to 6:30pm, 27 April, at the <strong>Council</strong> <strong>of</strong>fices, Galileo St, Ngaruawahia.A.4.<strong>1.2</strong><strong>Purpose</strong>The purpose <strong>of</strong> the workshop was to hear the views <strong>of</strong> key members <strong>of</strong> the community on how <strong>waste</strong>management and minimisation services in the district should be developed.Under the Waste Minimisation Act 2008 all councils must review their Waste Management and MinimisationPlans (WMMPs) prior to June 2012. As part <strong>of</strong> <strong>this</strong> review, <strong>Waikato</strong> <strong>District</strong> <strong>Council</strong> is undertaking a <strong>waste</strong><strong>assessment</strong>.The <strong>waste</strong> <strong>assessment</strong> takes stock <strong>of</strong> current services, looks at potential future demand for <strong>waste</strong> services, anddevelops initial options for addressing future demand. A <strong>waste</strong> <strong>assessment</strong> is an essential first step to producinga new <strong>waste</strong> management and minimisation plan.Although there is no formal requirement for consultation as part <strong>of</strong> the <strong>waste</strong> <strong>assessment</strong>, the council believesthe views <strong>of</strong> key stakeholders in the community are vital in shaping any plans, and therefore commissioned <strong>this</strong>workshop to ensure these views are taken into account at an early stage.As such, the workshop was not aiming to reach any form <strong>of</strong> consensus or broad agreement regarding thepotential direction or content <strong>of</strong> the plan, but simply to canvass the range <strong>of</strong> views held by the community.A.4.2Time4:15pm4:30pmAgendaItemRegistrationWelcome – Glen McIntosh, <strong>Waikato</strong> <strong>District</strong> <strong>Council</strong>4:35pm Presentation from Lisa Eve, Eunomia Research and Consulting on the <strong>waste</strong> <strong>assessment</strong> andWMMP process, <strong>Waikato</strong> <strong>District</strong> <strong>waste</strong> services, and <strong>waste</strong> data4:55pm Plenary Session led by Lisa Eve, Eunomia Research and Consulting -5:35pmDiscussion <strong>of</strong> broad aims and objectivesIdentification <strong>of</strong> key issues for discussion (e.g.):• <strong>Council</strong>’s role• Cleanfills• Regulation• Education and communicationC<strong>of</strong>fee Break<strong>Waikato</strong> <strong>District</strong> <strong>Council</strong> <strong>waste</strong> <strong>assessment</strong> 201163
Time5:45pmItemGroup working:(continuation <strong>of</strong> discussion <strong>of</strong> key issues):Group 1: <strong>Council</strong>’s role, regulation, incentives, leviesGroup 2: Opportunities, economic development, responsibility for targets, communication andeducation6:20pm6:30pmGroup 3: Special <strong>waste</strong>s, illegal dumping, cleanfills, other <strong>waste</strong> streamsReporting back and summary <strong>of</strong> workshopSession closeA.4.3NameLisa EveWorkshop attendeesOrganisationEunomia Research and ConsultingDuncan WilsonGlen McIntoshRichard BaxRachael GoddardJacqui ForbesRich ThorpeDanelle MatthewsTrish ForsythSue EdmondsClaire BullMaggie WilcockJohn BridgmanJudy JamiesonRobert LindGary McGuireBill Van der VlietBernadette JacksonEunomia Research and Consulting<strong>Waikato</strong> <strong>District</strong> <strong>Council</strong><strong>Waikato</strong> <strong>District</strong> <strong>Council</strong>ECOESXtreme WasteXtreme WasteMetro WasteNgaruawahia Community BoardEureka Community CommitteeGlen Massey Community CommitteeTamahere Community CommitteeGordonton Community CommitteeMaramarua Community CommitteeEnvir<strong>of</strong>ertEnvir<strong>of</strong>ertFulton HoganPrimary FocusA.4.4Plenary workshop sessionThe plenary session involved canvassing ideas on the overall direction for <strong>waste</strong> management in the district,with a view to these ideas feeding into the <strong>waste</strong> <strong>assessment</strong>, and the development <strong>of</strong> a vision and set <strong>of</strong> aimsand objectives for the WMMP.The following points were noted from the session:64
• A vision <strong>of</strong> zero <strong>waste</strong> is supported – but it needs to be communicated clearly to avoid putting people <strong>of</strong>f.Zero <strong>waste</strong> should be the overall vision, supported by specific targets. Prefer the term ‘resource’ to ‘<strong>waste</strong>’– should focus on opportunities and benefits• Goals and targets that focus on 2020 are still useful• Targets should be set for benefits as well as more traditional diversion objectives• Education and communication – need to reassure that recycling is actually recycled, perhaps by providinginformation about what goes where for final useThe second part <strong>of</strong> the plenary session focused on generating ideas for the topics that would form the basis <strong>of</strong>the discussions in the groups. The first four topics were the key areas <strong>of</strong> discussion at the councillor’s workshopand the group agreed they should be carried over to <strong>this</strong> workshop. From the discussion the following topicswere agreed:1. The council’s role2. Cleanfills3. Regulation4. Education & communication5. Regulation6. Incentives/levies7. Opportunities8. Economic development9. Responsibility – for targets10. Special <strong>waste</strong>s & other specific <strong>waste</strong> streams11. Illegal dumpingA.4.5Group workshop sessionThe topics developed in the plenary session and noted above were divided into three sets for one <strong>of</strong> threegroups to work on. Participants were asked to choose the group they wanted to attend based on the topicsselected for discussion in that group.The groups and topics were as follows:Group 1:Group 2:Group 3:A.4.5.1<strong>Council</strong>’s role, regulation, incentives, leviesOpportunities, economic development, responsibility for targets, education & communicationSpecial <strong>waste</strong>s, illegal dumping, cleanfills, and other <strong>waste</strong> streams.Group 1 - workshop notesThis is a summary <strong>of</strong> the points raised during the workshops. They are the views <strong>of</strong> the individual participantsand do represent council’s policy.<strong>Council</strong>’s role• Issue• Don’t want an overly prescriptive approach, but do want the council support to create a level playingfield• Potential solutions include: • The council provides a framework to support good <strong>waste</strong> management, not necessarily delivering <strong>this</strong>themselves but encouraging the private sector to work in ways that will achieve goals and objectives<strong>Waikato</strong> <strong>District</strong> <strong>Council</strong> <strong>waste</strong> <strong>assessment</strong> 201165
• Contracts could form a part <strong>of</strong> <strong>this</strong> but in a partnership approach based on goals and objectives; notnecessarily specific service contractsRegulation• Issues• Little information and data available – statistics are important• Some poor operating practice• Use <strong>of</strong> regulation could include:• Licensing operators• Requiring robust reporting across the board• Ensuring the level playing field mentioned aboveLevyThere was little discussion <strong>of</strong> the levy as the group felt that central government held responsibility for <strong>this</strong>.Spending <strong>of</strong> the council’s portion <strong>of</strong> the levy was not seen as a key issue at <strong>this</strong> stage.Incentives• Issues• Residents are seen as being apathetic in some cases• Solutions• A ‘user-pays’ system such as that used in Raglan and other parts <strong>of</strong> the district could be implementedconsistently.• Areas with no kerbside rubbish collection could pose concerns – although collections could be used bylinking in with existing collections (customer makes part <strong>of</strong> the journey themselves)• Potentially costs could be reduced by doing things smarter/less <strong>of</strong>ten – e.g. reducing frequency <strong>of</strong>rubbish collections when possible• The benefit <strong>of</strong> these changes needs to be communicated• User-paid bags or stickers accepted at all transfer stations• Support transfer station pricing that encourages good behaviour i.e. incentivises recycling/separation• Segregation <strong>of</strong> materials at the transfer station is seen as key.A.4.5.2Opportunities• Financial savingsGroup 2 – workshop notes• Employment opportunities• Environmental benefits• Tourism – brand the district• Develop and attract the re-processing industry• <strong>District</strong> is ideally placed for economic development around <strong>this</strong> industry – in the ‘golden triangle’between Auckland, Tauranga and Hamilton• Dairy effluent should go to anaerobic digestion• Carbon neutral – is it possible? Can we?• Carbon sequestration through organics back into soils • Organic <strong>waste</strong> – opportunities at Envir<strong>of</strong>ert. If organic <strong>waste</strong> is collected, residual <strong>waste</strong> collectionscould be fortnightly66
• Agriculture, energy and dairy opportunities• Environmental Fertilisers are also not far away (Kerepehi)• Reuse is important – maximise access to unwanted household goods, and by doing so, create jobs,income, and make life easier for low-income families (note that <strong>this</strong> links strongly to education)• Resource recovery centres in all small towns i.e. Tuakau, Ngaruawahia, and Huntly – should be fore<strong>waste</strong>, whiteware and C&D <strong>waste</strong> at least.Economic development• When contracting for services, need to consider the total cost/value <strong>of</strong> the contract – ie not necessarilybest price, but best value. Comment that contracting services to international companies is likeexporting ratepayer dollars• <strong>Council</strong> procurement policy – the council could set an example through what they spend their moneyon [The council does do <strong>this</strong> but does not publicise it]• ‘power the farm’ – small-scale windpower, anaerobic digestion and feed back in to the national grid?Latter would also produce bio-product which could be spread.Education• Need an enabling policy for new technologies – consents and funding• Look at publications that could be used• Important to bring ‘the people’ on board and raise awareness• “What’s in it for me”: free power, less costs, great compost• Need a composting programme along the lines <strong>of</strong> ‘create your own eden’• Definitely need to advertise the benefits• Look at the barriers – eg rats and turning compost heaps for organic <strong>waste</strong>.Responsibility• The council should work together with community groups to deliver educationA.4.5.3 Group 3 – workshop notesSpecial <strong>waste</strong>s• Could have special collection days – good model systems are available e.g. hazmobile• E-<strong>waste</strong> and tyres also <strong>waste</strong> streams that need managing.Transfer station development• Transfer stations are important – need to become better focal points for the community, and provideleverage for new opportunities i.e. beneficial re-use.Illegal landfilling• Need to get it out <strong>of</strong> the ‘too hard’ basket• Be more proactive.Cleanfills• Traceability is important.A.4.6ConclusionThe purpose <strong>of</strong> workshop was to hear the communities’ views on priorities for <strong>waste</strong> and recycling in the<strong>Waikato</strong> district, and on specific areas that will be fed in to the <strong>waste</strong> <strong>assessment</strong> process. The outcomes <strong>of</strong><strong>this</strong> workshop will inform the <strong>waste</strong> <strong>assessment</strong> for the district, and <strong>this</strong> is a foundation document for thendeveloping a <strong>waste</strong> management and minimisation plan.<strong>Waikato</strong> <strong>District</strong> <strong>Council</strong> <strong>waste</strong> <strong>assessment</strong> 201167