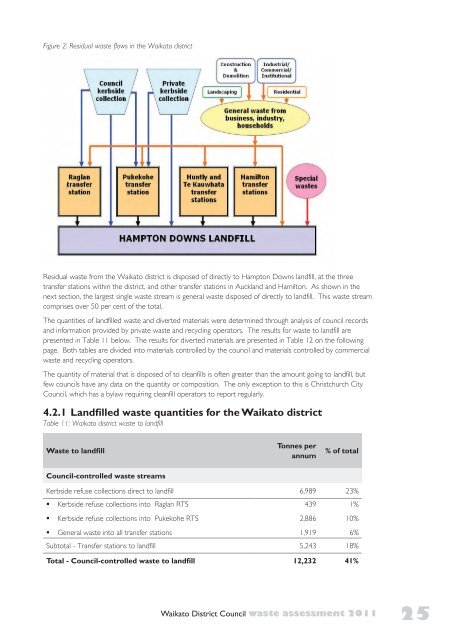
4.0 Waste within the<strong>Waikato</strong> district4.1 IntroductionThis section focuses on <strong>waste</strong> that is generated within the <strong>Waikato</strong> district. <strong>Waikato</strong> has a number <strong>of</strong> strategic<strong>waste</strong> processing and disposal facilities that accept <strong>waste</strong> from outside <strong>of</strong> the district, and flows <strong>of</strong> thesematerials are discussed in section 5.0.For local government planning purposes, the most important metrics relating to solid <strong>waste</strong> are the tonnageand composition <strong>of</strong> <strong>waste</strong> disposed <strong>of</strong> to landfill and the tonnage and composition <strong>of</strong> ‘diverted materials’.The WMA makes a clear distinction between these two types <strong>of</strong> ‘<strong>waste</strong>’ materials; ‘<strong>waste</strong>’ being defined as“any thing that is disposed <strong>of</strong> or discarded”, while ‘diverted materials’ is defined as “any thing that is no longerrequired for its original purpose and, but for commercial or other <strong>waste</strong> minimisation activities, would bedisposed <strong>of</strong> or discarded”.Measurements <strong>of</strong> <strong>waste</strong> disposed <strong>of</strong> to landfill are more readily compiled and more reliable than measurements<strong>of</strong> diverted materials. Waste to landfill is a well-defined, discrete material flow, handled by a relatively smallnumber <strong>of</strong> operators with all material generally being weighed and recorded at a common point – the landfillweighbridge.On the other hand, there is no general consensus on the boundaries <strong>of</strong> what constitutes a ‘diverted material’.Some materials, such as scrap metal and kraft cardboard collected for recycling, are widely accepted as beingdiverted materials, but for other materials, such as those handled by second-hand dealers, there is no suchagreement. Compounding the difficulties <strong>of</strong> quantifying diverted materials is the large number <strong>of</strong> businessesoperating in the industry (usually undocumented) and the wide range <strong>of</strong> unrelated disposal pathways for thematerials. The commercial sensitivity <strong>of</strong> quantitative information is another major complication, with manybusinesses in the industry being reluctant to voluntarily provide data.In relation to the objectives <strong>of</strong> the NZ Waste Strategy to ‘reduce harm’ and ‘increase resource efficiency’, athird distinct <strong>waste</strong> stream is <strong>of</strong> importance – cleanfill. ‘Cleanfills’ are meant to provide a low-cost alternative tolandfills for inert <strong>waste</strong>s that have no environmental impact when disposed <strong>of</strong> to land. However, as the Ministryfor the Environment’s 2002 guidelines for the management <strong>of</strong> cleanfills states:“...over time the term ‘cleanfill’ has been stretched and modified. Many cleanfills now mistakenly accept a multitude<strong>of</strong> construction and demolition <strong>waste</strong>, contaminated soils, green <strong>waste</strong> and many other materials that can result in anadverse effect on the environment”.It is very difficult to gather any data on <strong>waste</strong> material that is disposed <strong>of</strong> to ‘cleanfills’. ‘Cleanfills’ thatoperate with resource consents are rarely required to report on the quantity <strong>of</strong> material that is disposed <strong>of</strong>.Unconsented ‘cleanfills’ (both legal and illegal) present even greater difficulties with regards to data.As well as these ‘formal’ disposal pathways, <strong>waste</strong> can be disposed <strong>of</strong> through more ‘informal’ pathways,including illegal dumping and, particularly in rural areas, on-site incineration and burial.As a result <strong>of</strong> these factors, <strong>this</strong> summary <strong>of</strong> <strong>waste</strong> data and <strong>waste</strong> flows will focus on <strong>waste</strong> that is disposed<strong>of</strong> to landfill. Data on diverted materials will be limited to the council-controlled recycling systems (ie kerbsiderecycling and transfer station drop-<strong>of</strong>fs) and ‘commodities’ (ie paper, kraft, glass, plastic and metal containers)collected by commercial recyclers.4.2 Waste flows in the <strong>Waikato</strong> districtUsing information provided by the council and private <strong>waste</strong> operators, the flows <strong>of</strong> residual <strong>waste</strong> materials inthe district have been mapped as shown in Figure 2.24
Figure 2: Residual <strong>waste</strong> flows in the <strong>Waikato</strong> districtResidual <strong>waste</strong> from the <strong>Waikato</strong> district is disposed <strong>of</strong> directly to Hampton Downs landfill, at the threetransfer stations within the district, and other transfer stations in Auckland and Hamilton. As shown in thenext section, the largest single <strong>waste</strong> stream is general <strong>waste</strong> disposed <strong>of</strong> directly to landfill. This <strong>waste</strong> streamcomprises over 50 per cent <strong>of</strong> the total.The quantities <strong>of</strong> landfilled <strong>waste</strong> and diverted materials were determined through analysis <strong>of</strong> council recordsand information provided by private <strong>waste</strong> and recycling operators. The results for <strong>waste</strong> to landfill arepresented in Table 11 below. The results for diverted materials are presented in Table 12 on the followingpage. Both tables are divided into materials controlled by the council and materials controlled by commercial<strong>waste</strong> and recycling operators.The quantity <strong>of</strong> material that is disposed <strong>of</strong> to cleanfills is <strong>of</strong>ten greater than the amount going to landfill, butfew councils have any data on the quantity or composition. The only exception to <strong>this</strong> is Christchurch City<strong>Council</strong>, which has a bylaw requiring cleanfill operators to report regularly.4.2.1 Landfilled <strong>waste</strong> quantities for the <strong>Waikato</strong> districtTable 11: <strong>Waikato</strong> district <strong>waste</strong> to landfillWaste to landfill<strong>Council</strong>-controlled <strong>waste</strong> streamsTonnes perannum% <strong>of</strong> totalKerbside refuse collections direct to landfill 6,989 23%• Kerbside refuse collections into Raglan RTS439 1%• Kerbside refuse collections into Pukekohe RTS2,886• General <strong>waste</strong> into all transfer stations1,919 6%Subtotal - Transfer stations to landfill 5,243 18%Total - <strong>Council</strong>-controlled <strong>waste</strong> to landfill 12,232 41%10%<strong>Waikato</strong> <strong>District</strong> <strong>Council</strong> <strong>waste</strong> <strong>assessment</strong> 201125