1.2 Purpose of this waste assessment - Waikato District Council
1.2 Purpose of this waste assessment - Waikato District Council
1.2 Purpose of this waste assessment - Waikato District Council
- No tags were found...

Create successful ePaper yourself
Turn your PDF publications into a flip-book with our unique Google optimized e-Paper software.
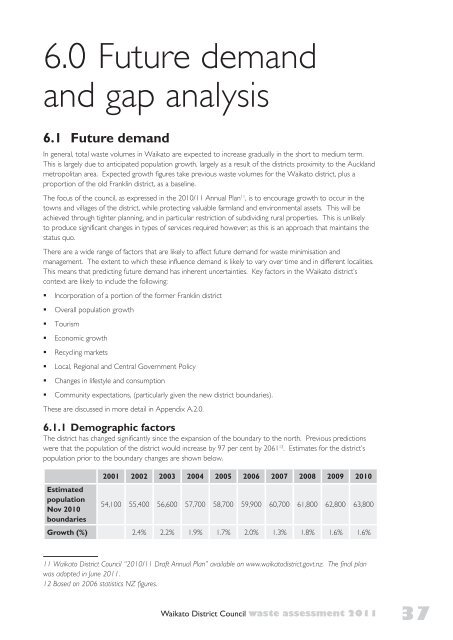
6.0 Future demandand gap analysis6.1 Future demandIn general, total <strong>waste</strong> volumes in <strong>Waikato</strong> are expected to increase gradually in the short to medium term.This is largely due to anticipated population growth, largely as a result <strong>of</strong> the districts proximity to the Aucklandmetropolitan area. Expected growth figures take previous <strong>waste</strong> volumes for the <strong>Waikato</strong> district, plus aproportion <strong>of</strong> the old Franklin district, as a baseline.The focus <strong>of</strong> the council, as expressed in the 2010/11 Annual Plan 11 , is to encourage growth to occur in thetowns and villages <strong>of</strong> the district, while protecting valuable farmland and environmental assets. This will beachieved through tighter planning, and in particular restriction <strong>of</strong> subdividing rural properties. This is unlikelyto produce significant changes in types <strong>of</strong> services required however; as <strong>this</strong> is an approach that maintains thestatus quo.There are a wide range <strong>of</strong> factors that are likely to affect future demand for <strong>waste</strong> minimisation andmanagement. The extent to which these influence demand is likely to vary over time and in different localities.This means that predicting future demand has inherent uncertainties. Key factors in the <strong>Waikato</strong> district’scontext are likely to include the following:• Incorporation <strong>of</strong> a portion <strong>of</strong> the former Franklin district• Overall population growth• Tourism• Economic growth• Recycling markets• Local, Regional and Central Government Policy• Changes in lifestyle and consumption• Community expectations, (particularly given the new district boundaries).These are discussed in more detail in Appendix A.2.0.6.1.1 Demographic factorsThe district has changed significantly since the expansion <strong>of</strong> the boundary to the north. Previous predictionswere that the population <strong>of</strong> the district would increase by 97 per cent by 2061 12 . Estimates for the district’spopulation prior to the boundary changes are shown below.EstimatedpopulationNov 2010boundaries2001 2002 2003 2004 2005 2006 2007 2008 2009 201054,100 55,400 56,600 57,700 58,700 59,900 60,700 61,800 62,800 63,800Growth (%) 2.4% 2.2% 1.9% 1.7% 2.0% 1.3% 1.8% 1.6% 1.6%11 <strong>Waikato</strong> <strong>District</strong> <strong>Council</strong> “2010/11 Draft Annual Plan” available on www.waikatodistrict.govt.nz. The final planwas adopted in June 2011.12 Based on 2006 statistics NZ figures.<strong>Waikato</strong> <strong>District</strong> <strong>Council</strong> <strong>waste</strong> <strong>assessment</strong> 201137