1.2 Purpose of this waste assessment - Waikato District Council
1.2 Purpose of this waste assessment - Waikato District Council
1.2 Purpose of this waste assessment - Waikato District Council
- No tags were found...

Create successful ePaper yourself
Turn your PDF publications into a flip-book with our unique Google optimized e-Paper software.
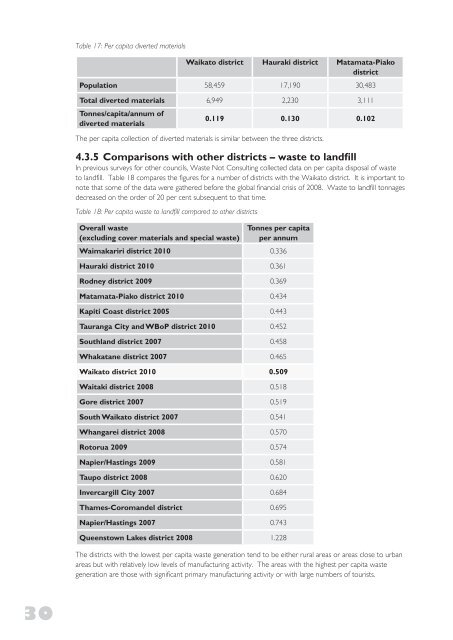
Table 17: Per capita diverted materials<strong>Waikato</strong> district Hauraki district Matamata-PiakodistrictPopulation 58,459 17,190 30,483Total diverted materials 6,949 2,230 3,111Tonnes/capita/annum <strong>of</strong>diverted materials0.119 0.130 0.102The per capita collection <strong>of</strong> diverted materials is similar between the three districts.4.3.5 Comparisons with other districts – <strong>waste</strong> to landfillIn previous surveys for other councils, Waste Not Consulting collected data on per capita disposal <strong>of</strong> <strong>waste</strong>to landfill. Table 18 compares the figures for a number <strong>of</strong> districts with the <strong>Waikato</strong> district. It is important tonote that some <strong>of</strong> the data were gathered before the global financial crisis <strong>of</strong> 2008. Waste to landfill tonnagesdecreased on the order <strong>of</strong> 20 per cent subsequent to that time.Table 18: Per capita <strong>waste</strong> to landfill compared to other districtsOverall <strong>waste</strong>(excluding cover materials and special <strong>waste</strong>)Tonnes per capitaper annumWaimakariri district 2010 0.336Hauraki district 2010 0.361Rodney district 2009 0.369Matamata-Piako district 2010 0.434Kapiti Coast district 2005 0.443Tauranga City and WBoP district 2010 0.452Southland district 2007 0.458Whakatane district 2007 0.465<strong>Waikato</strong> district 2010 0.509Waitaki district 2008 0.518Gore district 2007 0.519South <strong>Waikato</strong> district 2007 0.541Whangarei district 2008 0.570Rotorua 2009 0.574Napier/Hastings 2009 0.581Taupo district 2008 0.620Invercargill City 2007 0.684Thames-Coromandel district 0.695Napier/Hastings 2007 0.743Queenstown Lakes district 2008 <strong>1.2</strong>28The districts with the lowest per capita <strong>waste</strong> generation tend to be either rural areas or areas close to urbanareas but with relatively low levels <strong>of</strong> manufacturing activity. The areas with the highest per capita <strong>waste</strong>generation are those with significant primary manufacturing activity or with large numbers <strong>of</strong> tourists.30