1.2 Purpose of this waste assessment - Waikato District Council
1.2 Purpose of this waste assessment - Waikato District Council
1.2 Purpose of this waste assessment - Waikato District Council
- No tags were found...
Create successful ePaper yourself
Turn your PDF publications into a flip-book with our unique Google optimized e-Paper software.
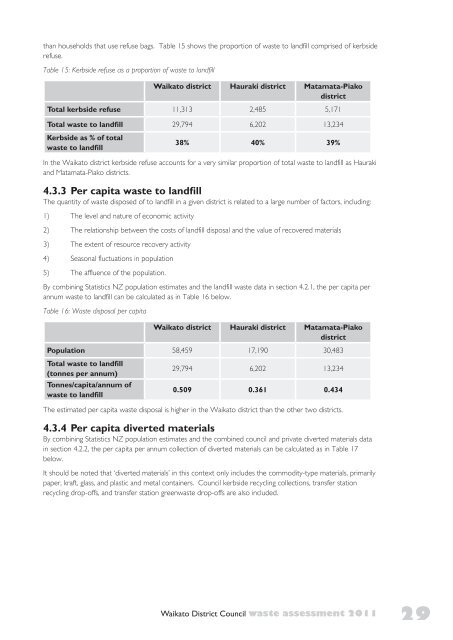
than households that use refuse bags. Table 15 shows the proportion <strong>of</strong> <strong>waste</strong> to landfill comprised <strong>of</strong> kerbsiderefuse.Table 15: Kerbside refuse as a proportion <strong>of</strong> <strong>waste</strong> to landfill<strong>Waikato</strong> district Hauraki district Matamata-PiakodistrictTotal kerbside refuse 11,313 2,485 5,171Total <strong>waste</strong> to landfill 29,794 6,202 13,234Kerbside as % <strong>of</strong> total<strong>waste</strong> to landfill38% 40% 39%In the <strong>Waikato</strong> district kerbside refuse accounts for a very similar proportion <strong>of</strong> total <strong>waste</strong> to landfill as Haurakiand Matamata-Piako districts.4.3.3 Per capita <strong>waste</strong> to landfillThe quantity <strong>of</strong> <strong>waste</strong> disposed <strong>of</strong> to landfill in a given district is related to a large number <strong>of</strong> factors, including:1) The level and nature <strong>of</strong> economic activity2) The relationship between the costs <strong>of</strong> landfill disposal and the value <strong>of</strong> recovered materials3) The extent <strong>of</strong> resource recovery activity4) Seasonal fluctuations in population5) The affluence <strong>of</strong> the population.By combining Statistics NZ population estimates and the landfill <strong>waste</strong> data in section 4.2.1, the per capita perannum <strong>waste</strong> to landfill can be calculated as in Table 16 below.Table 16: Waste disposal per capita<strong>Waikato</strong> district Hauraki district Matamata-PiakodistrictPopulation 58,459 17,190 30,483Total <strong>waste</strong> to landfill(tonnes per annum)Tonnes/capita/annum <strong>of</strong><strong>waste</strong> to landfill29,794 6,202 13,2340.509 0.361 0.434The estimated per capita <strong>waste</strong> disposal is higher in the <strong>Waikato</strong> district than the other two districts.4.3.4 Per capita diverted materialsBy combining Statistics NZ population estimates and the combined council and private diverted materials datain section 4.2.2, the per capita per annum collection <strong>of</strong> diverted materials can be calculated as in Table 17below.It should be noted that ‘diverted materials’ in <strong>this</strong> context only includes the commodity-type materials, primarilypaper, kraft, glass, and plastic and metal containers. <strong>Council</strong> kerbside recycling collections, transfer stationrecycling drop-<strong>of</strong>fs, and transfer station green<strong>waste</strong> drop-<strong>of</strong>fs are also included.<strong>Waikato</strong> <strong>District</strong> <strong>Council</strong> <strong>waste</strong> <strong>assessment</strong> 201129


