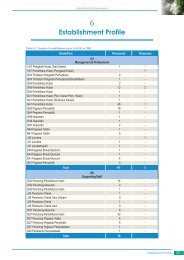
Figure 9.1: Organizational Chart of DFR and FMU 17A (2006 – 2015)
Table 9.2: Budget and Projected Cost (2006 – 2015) for FMU 17ACOST CENTERSalary & AllowancesSilviculture<strong>Forest</strong> RestorationPower Generator<strong>Forest</strong> Mgmt.CertificationYEAR2006 2007 2008 2009 2010 2011 2012 2013 2014 2015712,0011,400,000224,08518,00022,000712,0011,400,000300,73818,00022,000712,0011,400,000706,21318,00022,000712,0011,400,000700,97518,00022,000712,0011,400,000690,97518,00022,000854,401175,000745,74618,00022,000854,401175,0001,175,24318,00022,000854,401175,000964,24618,00022,000854,401175,000854,401175,000TOTAL%7,832,009 21.27,875,000 21.3843,496 1,159,746 7,511,463 20.318,00022,00018,00022,000180,000 0.5220,000 1Administration 89,249 89,249 89,249 89,249 89,249 95,000 95,000 95,000 95,000 95,000 921,247 2.5Road/Bridge/CulvertConst& MaintenanceBoundary Demarcation.500,00060,000130,00060,000130,00060,000130,00060,000130,00060,000800,00060,000800,00060,000800,00060,000800,00060,000800,00060,0005,020,000 14600,000 2Protection 20,000 20,000 20,000 20,000 20,000 20,000 20,000 20,000 20,000 20,000 200,000 1Aerial SurveillanceFuel & Lubricant20,00070,000Machineries 1,398,764Maint. of Vehicles &MachineriesBuilding ConstructionBuilding Maintenance250,000150,00050,00020,00070,000250,000250,00050,00020,00070,000250,00050,00020,00070,000250,00050,000TOTAL 4,984,099 3,391,988 3,547,463 3,542,225 3,532,225 3,880,147 3,659,643 3,448,647 3,327,897 3,644,14720,00070,000250,00050,00020,00070,000400,000300,000250,00050,00020,00070,000300,00050,00020,00070,000300,00050,00020,00070,000300,00050,00020,00070,000300,00050,000200,000 1700,000 21,798,764 52,750,000 7650,000 2500,000 136,958,482 100