NATIONAL PROFILE on Chemicals Management - UNITAR
NATIONAL PROFILE on Chemicals Management - UNITAR
NATIONAL PROFILE on Chemicals Management - UNITAR
- No tags were found...

You also want an ePaper? Increase the reach of your titles
YUMPU automatically turns print PDFs into web optimized ePapers that Google loves.
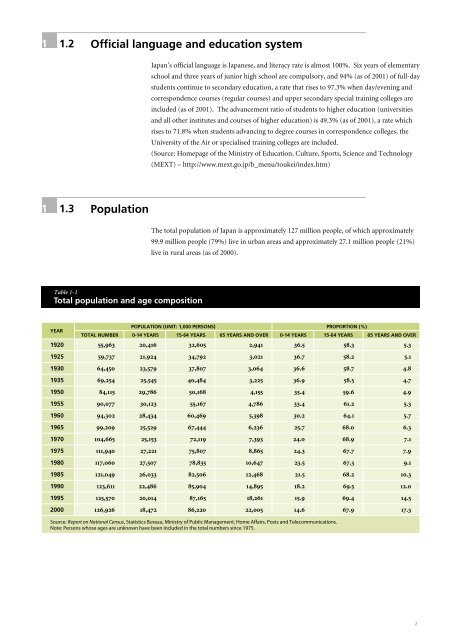
1 1.2 Official language and educati<strong>on</strong> systemJapan’s official language is Japanese, and literacy rate is almost 100%. Six years of elementaryschool and three years of junior high school are compulsory, and 94% (as of 2001) of full-daystudents c<strong>on</strong>tinue to sec<strong>on</strong>dary educati<strong>on</strong>, a rate that rises to 97.3% when day/evening andcorresp<strong>on</strong>dence courses (regular courses) and upper sec<strong>on</strong>dary special training colleges areincluded (as of 2001). The advancement ratio of students to higher educati<strong>on</strong> (universitiesand all other institutes and courses of higher educati<strong>on</strong>) is 49.3% (as of 2001), a rate whichrises to 71.8% when students advancing to degree courses in corresp<strong>on</strong>dence colleges, theUniversity of the Air or specialised training colleges are included.(Source: Homepage of the Ministry of Educati<strong>on</strong>, Culture, Sports, Science and Technology(MEXT) – http://www.mext.go.jp/b_menu/toukei/index.htm)1 1.3 Populati<strong>on</strong>The total populati<strong>on</strong> of Japan is approximately 127 milli<strong>on</strong> people, of which approximately99.9 milli<strong>on</strong> people (79%) live in urban areas and approximately 27.1 milli<strong>on</strong> people (21%)live in rural areas (as of 2000).Table 1-1Total populati<strong>on</strong> and age compositi<strong>on</strong>YEARPOPULATION (UNIT: 1,000 PERSONS) PROPORTION (%)TOTAL NUMBER 0-14 YEARS 15-64 YEARS 65 YEARS AND OVER 0-14 YEARS 15-64 YEARS 65 YEARS AND OVER1920 55,963 20,416 32,605 2,941 36.5 58.3 5.31925 59,737 21,924 34,792 3,021 36.7 58.2 5.11930 64,450 23,579 37,807 3,064 36.6 58.7 4.81935 69,254 25,545 40,484 3,225 36.9 58.5 4.71950 84,115 29,786 50,168 4,155 35.4 59.6 4.91955 90,077 30,123 55,167 4,786 33.4 61.2 5.31960 94,302 28,434 60,469 5,398 30.2 64.1 5.71965 99,209 25,529 67,444 6,236 25.7 68.0 6.31970 104,665 25,153 72,119 7,393 24.0 68.9 7.11975 111,940 27,221 75,807 8,865 24.3 67.7 7.91980 117,060 27,507 78,835 10,647 23.5 67.3 9.11985 121,049 26,033 82,506 12,468 21.5 68.2 10.31990 123,611 22,486 85,904 14,895 18.2 69.5 12.01995 125,570 20,014 87,165 18,261 15.9 69.4 14.52000 126,926 18,472 86,220 22,005 14.6 67.9 17.3Source: Report <strong>on</strong> Nati<strong>on</strong>al Census, Statistics Bureau, Ministry of Public <strong>Management</strong>, Home Affairs, Posts and Telecommunicati<strong>on</strong>s.Note: Pers<strong>on</strong>s whose ages are unknown have been included in the total numbers since 1975.2