NATIONAL PROFILE on Chemicals Management - UNITAR
NATIONAL PROFILE on Chemicals Management - UNITAR
NATIONAL PROFILE on Chemicals Management - UNITAR
- No tags were found...

Create successful ePaper yourself
Turn your PDF publications into a flip-book with our unique Google optimized e-Paper software.
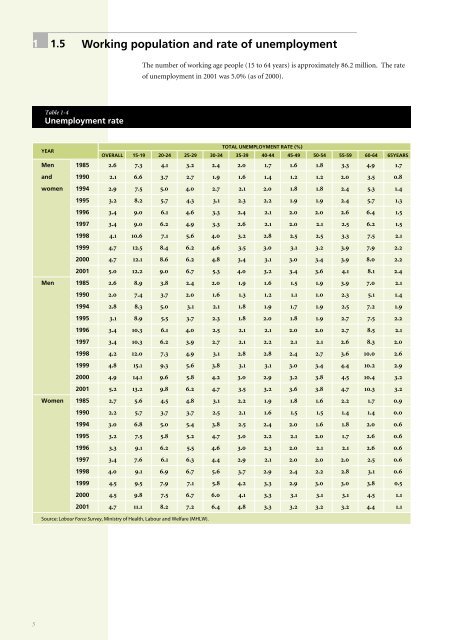
1 1.5 Working populati<strong>on</strong> and rate of unemploymentThe number of working age people (15 to 64 years) is approximately 86.2 milli<strong>on</strong>. The rateof unemployment in 2001 was 5.0% (as of 2000).Table 1-4Unemployment rateTOTAL UNEMPLOYMENT RATE (%)YEAROVERALL 15-19 20-24 25-29 30-34 35-39 40-44 45-49 50-54 55-59 60-64 65YEARSMen 1985 2.6 7.3 4.1 3.2 2.4 2.0 1.7 1.6 1.8 3.3 4.9 1.7and 1990 2.1 6.6 3.7 2.7 1.9 1.6 1.4 1.2 1.2 2.0 3.5 0.8women 1994 2.9 7.5 5.0 4.0 2.7 2.1 2.0 1.8 1.8 2.4 5.3 1.41995 3.2 8.2 5.7 4.3 3.1 2.3 2.2 1.9 1.9 2.4 5.7 1.31996 3.4 9.0 6.1 4.6 3.3 2.4 2.1 2.0 2.0 2.6 6.4 1.51997 3.4 9.0 6.2 4.9 3.3 2.6 2.1 2.0 2.1 2.5 6.2 1.51998 4.1 10.6 7.1 5.6 4.0 3.2 2.8 2.5 2.5 3.3 7.5 2.11999 4.7 12.5 8.4 6.2 4.6 3.5 3.0 3.1 3.2 3.9 7.9 2.22000 4.7 12.1 8.6 6.2 4.8 3.4 3.1 3.0 3.4 3.9 8.0 2.22001 5.0 12.2 9.0 6.7 5.3 4.0 3.2 3.4 3.6 4.1 8.1 2.4Men 1985 2.6 8.9 3.8 2.4 2.0 1.9 1.6 1.5 1.9 3.9 7.0 2.11990 2.0 7.4 3.7 2.0 1.6 1.3 1.2 1.1 1.0 2.3 5.1 1.41994 2.8 8.3 5.0 3.1 2.1 1.8 1.9 1.7 1.9 2.5 7.2 1.91995 3.1 8.9 5.5 3.7 2.3 1.8 2.0 1.8 1.9 2.7 7.5 2.21996 3.4 10.3 6.1 4.0 2.5 2.1 2.1 2.0 2.0 2.7 8.5 2.11997 3.4 10.3 6.2 3.9 2.7 2.1 2.2 2.1 2.1 2.6 8.3 2.01998 4.2 12.0 7.3 4.9 3.1 2.8 2.8 2.4 2.7 3.6 10.0 2.61999 4.8 15.1 9.3 5.6 3.8 3.1 3.1 3.0 3.4 4.4 10.2 2.92000 4.9 14.1 9.6 5.8 4.2 3.0 2.9 3.2 3.8 4.5 10.4 3.22001 5.2 13.2 9.8 6.2 4.7 3.5 3.2 3.6 3.8 4.7 10.3 3.2Women 1985 2.7 5.6 4.5 4.8 3.1 2.2 1.9 1.8 1.6 2.2 1.7 0.91990 2.2 5.7 3.7 3.7 2.5 2.1 1.6 1.5 1.5 1.4 1.4 0.01994 3.0 6.8 5.0 5.4 3.8 2.5 2.4 2.0 1.6 1.8 2.0 0.61995 3.2 7.5 5.8 5.2 4.7 3.0 2.2 2.1 2.0 1.7 2.6 0.61996 3.3 9.1 6.2 5.5 4.6 3.0 2.3 2.0 2.1 2.1 2.6 0.61997 3.4 7.6 6.1 6.3 4.4 2.9 2.1 2.0 2.0 2.0 2.5 0.61998 4.0 9.1 6.9 6.7 5.6 3.7 2.9 2.4 2.2 2.8 3.1 0.61999 4.5 9.5 7.9 7.1 5.8 4.2 3.3 2.9 3.0 3.0 3.8 0.52000 4.5 9.8 7.5 6.7 6.0 4.1 3.3 3.1 3.1 3.1 4.5 1.12001 4.7 11.1 8.2 7.2 6.4 4.8 3.3 3.2 3.2 3.2 4.4 1.1Source: Labour Force Survey, Ministry of Health, Labour and Welfare (MHLW).5