Consolidated Financial Statements - Acer Group
Consolidated Financial Statements - Acer Group
Consolidated Financial Statements - Acer Group

You also want an ePaper? Increase the reach of your titles
YUMPU automatically turns print PDFs into web optimized ePapers that Google loves.
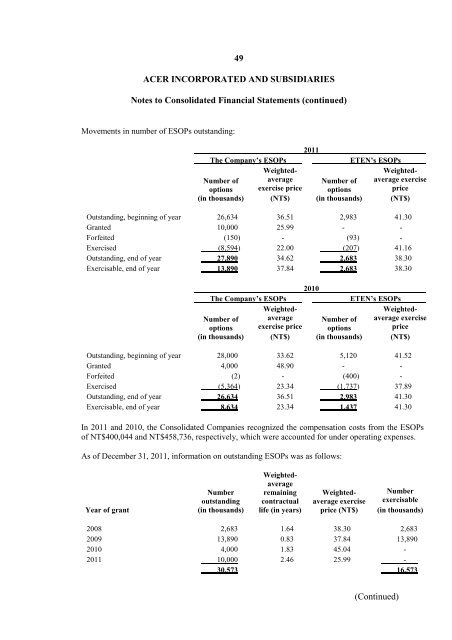
49ACER INCORPORATED AND SUBSIDIARIESNotes to <strong>Consolidated</strong> <strong>Financial</strong> <strong>Statements</strong> (continued)Movements in number of ESOPs outstanding:The Company’s ESOPsNumber ofoptions(in thousands)Weightedaverageexercise price(NT$)2011Number ofoptions(in thousands)ETEN’s ESOPsWeightedaverageexerciseprice(NT$)Outstanding, beginning of year 26,634 36.51 2,983 41.30Granted 10,000 25.99 - -Forfeited (150) - (93) -Exercised (8,594) 22.00 (207) 41.16Outstanding, end of year 27,890 34.62 2,683 38.30Exercisable, end of year 13,890 37.84 2,683 38.30The Company’s ESOPsNumber ofoptions(in thousands)Weightedaverageexercise price(NT$)2010Number ofoptions(in thousands)ETEN’s ESOPsWeightedaverageexerciseprice(NT$)Outstanding, beginning of year 28,000 33.62 5,120 41.52Granted 4,000 48.90 - -Forfeited (2) - (400) -Exercised (5,364) 23.34 (1,737) 37.89Outstanding, end of year 26,634 36.51 2,983 41.30Exercisable, end of year 8,634 23.34 1,437 41.30In 2011 and 2010, the <strong>Consolidated</strong> Companies recognized the compensation costs from the ESOPsof NT$400,044 and NT$458,736, respectively, which were accounted for under operating expenses.As of December 31, 2011, information on outstanding ESOPs was as follows:Year of grantNumberoutstanding(in thousands)Weightedaverageremainingcontractuallife (in years)Weightedaverageexerciseprice (NT$)Numberexercisable(in thousands)2008 2,683 1.64 38.30 2,6832009 13,890 0.83 37.84 13,8902010 4,000 1.83 45.04 -2011 10,000 2.46 25.99 -30,573 16,573(Continued)